Trapezium Bone Density-A Comparison of Measurements by DXA and CT - MDPI
←
→
Page content transcription
If your browser does not render page correctly, please read the page content below
Journal of
           Functional
           Biomaterials

Article
Trapezium Bone Density—A Comparison of
Measurements by DXA and CT
Sebastian Breddam Mosegaard 1,2, * ID , Kamille Breddam Mosegaard 1 , Nadia Bouteldja 3 ,
Torben Bæk Hansen 1,2 ID and Maiken Stilling 1,2
 1    University Clinic for Hand, Hip and Knee Surgery, Regional Hospital Holstebro, Hospital Unit West,
      7500 Holstebro, Denmark; kamille.breddam@gmail.com (K.B.M.); torbehns@rm.dk (T.B.H.);
      maiken.stilling@clin.au.dk (M.S.)
 2    Department of Clinical Medicine, University of Aarhus, 8000 Aarhus, Denmark
 3    Department of Radiology, Regional Hospital Holstebro, Hospital Unit West, 7500 Holstebro, Denmark;
      nadibout@rm.dk
 *    Correspondence: sebmos@rm.dk; Tel.: +45-31-33-02-88

 Received: 6 December 2017; Accepted: 16 January 2018; Published: 18 January 2018

 Abstract: Bone density may influence the primary fixation of cementless implants, and poor bone
 density may increase the risk of implant failure. Before deciding on using total joint replacement as
 treatment in osteoarthritis of the trapeziometacarpal joint, it is valuable to determine the trapezium
 bone density. The aim of this study was to: (1) determine the correlation between measurements
 of bone mineral density of the trapezium obtained by dual-energy X-ray absorptiometry (DXA)
 scans by a circumference method and a new inner-ellipse method; and (2) to compare those to
 measurements of bone density obtained by computerized tomography (CT)-scans in Hounsfield units
 (HU). We included 71 hands from 59 patients with a mean age of 59 years (43–77). All patients had
 Eaton–Glickel stage II–IV trapeziometacarpal (TM) joint osteoarthritis, were under evaluation for
 trapeziometacarpal total joint replacement, and underwent DXA and CT wrist scans. There was an
 excellent correlation (r = 0.94) between DXA bone mineral density measures using the circumference
 and the inner-ellipse method. There was a moderate correlation between bone density measures
 obtained by DXA- and CT-scans with (r = 0.49) for the circumference method, and (r = 0.55) for the
 inner-ellipse method. DXA may be used in pre-operative evaluation of the trapezium bone quality,
 and the simpler DXA inner-ellipse measurement method can replace the DXA circumference method
 in estimation of bone density of the trapezium.

 Keywords: trapezium; bone mineral density; Hounsfield units; TM joint osteoarthritis; bone quality

1. Introduction
     Implant failure in total joint replacement of the trapeziometacarpal joint is a major problem,
especially concerning the trapezium cup component [1–6]. The reasons are unclear, and implant
failures may be caused by multiple independent factors such as implant design, insertion technique,
and patient-related factors [7]. Impaired bone quality of the trapezium may represent a failure risk
especially in cementless implants, but the relation between hand osteoarthritis and osteoporosis
is unclear [8–14]. Assessment of bone quality is not straightforward, as it is influenced by factors
including the bone mineral, bone collagen, and microscopic architecture of the bone [15]. Predicting
poor bone density of the trapezium before surgery may therefore guide the choice of surgery
towards non-prosthetic treatment and potentially reduce the failure rate of TM total joint implants.
Hansen et al. [16] tested the precision and reliability of measurements of trapezium bone mineral
density (BMD) in patients with osteoarthritic TM joints using dual-energy X-ray absorptiometry
scans (DXA-scans), and found that it is possible to measure the BMD of the trapezium with sufficient

J. Funct. Biomater. 2018, 9, 9; doi:10.3390/jfb9010009                              www.mdpi.com/journal/jfb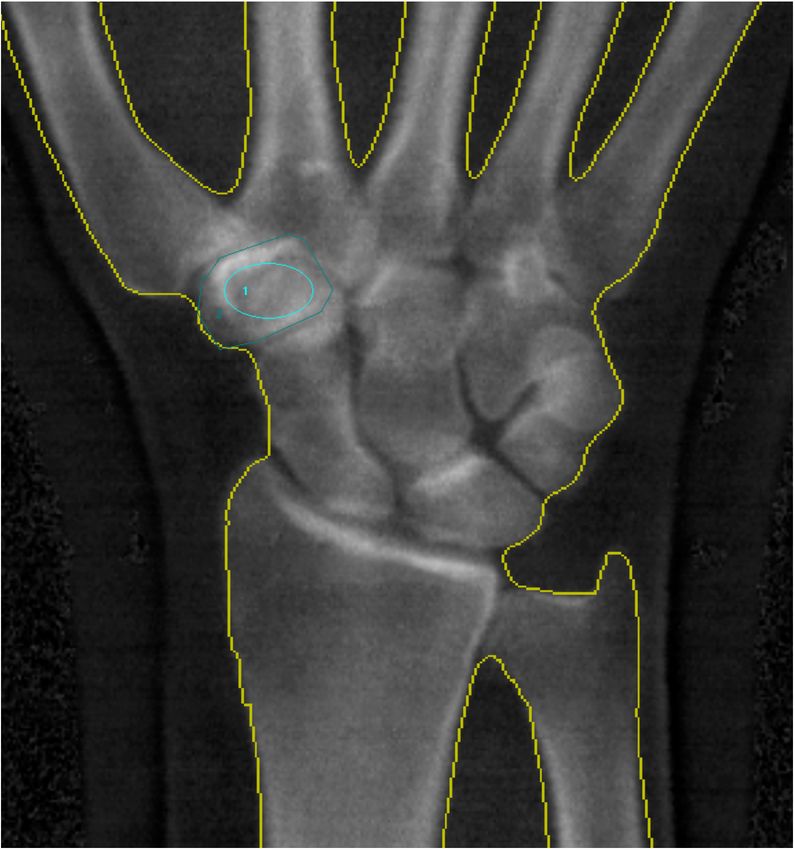
J. Funct. Biomater. 2018, 9, 9                                                                                                  2 of 8

precision for clinical use. However, identification of the borders of the trapezium is difficult and
time-consuming, although precision has been shown to be acceptable [16]. DXA scans may not always
be available, and therefore alternative measurement methods should be considered. Hounsfield units
are a standardized computed tomography (CT) attenuation coefficient. Schreiber et al. [17] tested
if Hounsfield units on CT scans correlated with BMD in a clinical study with patients undergoing
both lumbar spine DXA and CT imaging. They found moderate correlations between both BMD
(r2 = 0.44) and T-scores (r2 = 0.48) using DXA scans and Hounsfield units, and concluded that relevant
clinical CT scans performed for other purposes can provide an alternative method for determining
regional bone density at no additional expense for the patient. If the correlation between DXA and CT
measured bone mineral density of the trapezium is good, the preoperative CT scans of the wrist may
be used to determine the trapezium bone density prior to decision making of surgical treatment in TM
joint osteoarthritis.
      The aim of this study was to: (1) compare the DXA bone mineral density measurements of
the trapezium using a previously described method to mark the circumference of the trapezium
in comparison with a new and simpler method to mark the inner-ellipse of the trapezium;
and (2) determine whether these DXA measurements correlate with Hounsfield units obtained from
CT scans of the trapeziums.

2. Results
     Our BMD measurements did not differ from the reference material in any of the three age groups
(Table 1). We found higher trapezium BMD for men using DXA circumference method (p < 0.001)
and by using DXA inner-ellipse method (p = 0.01). We did not find a difference in CT-measured HU
between males and females (p = 0.42) (Table 2).

      Table 1. Mean BMD from total, ultradistal, and radius 33% measures and the reference mean, reference
      upper limits for osteopenia and osteoporosis, and p value for the difference between data mean and
      reference mean for Northern Europeans.

                  Reference Mean       Data                                 Reference    Reference   Reference
                                                 SEM         95% CI                                                   p Value
                  And Data Mean        Mean                                  Normal      Osteopenia Osteoporosis
                                                                   Total BMD
                   Males (N = 14)       0.71      0.02       0.67–0.74        0.74           0.67              0.56    0.06
                  Females (N = 57)      0.61      0.01       0.58–0.63        0.63           0.57              0.48    0.05
                                                                Ultra distal BMD
                   Males (N = 14)       0.50      0.01       0.47–0.52        0.51           0.46              0.38    0.22
                  Females (N = 57)      0.42      0.01       0.39–0.44        0.43           0.38              0.32    0.25
                                                                Radius 33% BMD
                   Males (N = 14)       0.94      0.02       0.90–0.98        0.96           0.86              0.71    0.36
                  Females (N = 57)      0.81      0.01       0.78–0.83        0.81           0.72              0.59    0.74
      SEM, Standard error of the mean; Reference Osteopenia, Upper BMD limit for reference osteopenia (Reference
      mean—(1 × SD)); Reference Osteoporosis, Upper BMD limit for reference osteoporosis (Reference mean—(2.5 × SD));
      p value, p value for the difference between data mean and reference normal.

                        Table 2. Means from the two DXA methods and the CT method by sex.

                                     DXA And CT Mean                Mean             SEM              95% CI
                                                         DXA circumference (g/cm2 )
                                      Male hands (n = 14)            0.78            0.05             0.68–0.89
                                     Female hands (n = 57)           0.65            0.02             0.62–0.69
                                                         DXA inner-ellipse (g/cm2 )
                                      Male hands (n = 14)            0.73            0.05             0.63–0.83
                                     Female hands (n = 57)           0.61            0.02             0.57–0.64
                                                                 CT scans (HU)
                                      Male hands (n = 14)          277.43            17.89          241.75–313.11
                                     Female hands (n = 57)         298.44            11.89          274.72–322.15
                                                  SEM, Standard error of the mean.
J. Funct. Biomater. 2018, 9, 9 3 of 8
We found no significant difference in CT-measured HU between age groups (p = 0.09), neither
in DXA circumference measured BMD (p = 0.19) or in DXA inner-ellipse measured BMD (p = 0.17)
between age groups (Table 3).
Table 3. Means from the two DXA methods and CT method by age group.
DXA and CT Mean Mean SEM 95% CI
DXA circumference (g/cm2 )
Age group 1 (N = 24) 0.72 0.03 0.66–0.77
Age group 2 (N = 23) 0.64 0.03 0.59–0.69
Age group 3 (N = 24) 0.69 0.04 0.62–0.77
DXA inner-ellipse (g/cm2 )
Age group 1 (N = 24) 0.67 0.03 0.62–0.77
Age group 2 (N = 23) 0.59 0.03 0.53–0.64
Age group 3 (N = 24) 0.64 0.04 0.56–0.71
CT scans (HU)
Age group 1 (N = 24) 310.71 17.72 275.34–346.04
Age group 2 (N = 23) 309.72 20.62 268.59–350.85
Age group 3 (N = 24) 263.10 12.83 237.52–288.69
SEM, Standard error of the mean.
This was further analyzed using multiple regression analysis, showing no effects of sex and age
on CT-measured Hounsfield units (HU), or any effect of age on DXA inner-ellipse measured BMD or
on DXA circumference measured BMD (Table 4). The analysis showed higher BMD for men measured
by the DXA inner-ellipse method (p = 0.004) and DXA circumference method (p = 0.002) (Table 4).
Table 4. Multiple regression analysis showing the effects of sex and age on CT measured HU and DXA
measured BMD by the circumference and inner-ellipse method respectively.
Variable Coef. SEM t p > [t] 95% CI
DXA circumference (g/cm2 )
Sex −0.13 0.04 −3.22 0.002 −0.22–−0.05
Age −0.00 0.00 −1.65 0.103 −0.01–0.00
DXA inner-ellipse (g/cm2 )
Sex −0.13 0.04 −3.00 0.004 −2.11–−0.04
Age −0.00 0.00 −1.79 0.078 −0.01–0.00
CT scans (HU)
Sex 17.24 25.26 0.68 0.497 −33.16–67.65
Age −2.23 1.19 −1.87 0.065 −4.60–0.14
SEM, Standard error of the mean. Note: Bold p value denotes significance.
We found excellent repeatability for intra-observer repeated measurements with DXA inner-ellipse
method and CT (Table 5).
Table 5. Repeatability measurements (intra-observer) of trapezium BMD measurements by the
inner-ellipse method and the CT HU trapezium measurement.
Measurement Mean (95% CI), g/cm3 SDdif Bias (LOA), g/cm3 p Value ICC
Intra-observer repeated measurements
DXA Scan 1 (N = 71) 0.62 (0.58–0.65) 0.058 −0.007 (0.114) 0.00 0.93
DXA Scan 2 (N = 71) 0.64 (0.61–0.62) 0.061 0.003 (0.120) 0.00 0.92
CT Scan (N = 71) 294.30 (274.0–314.6) 47.88 18.79 (93.84) 0.00 0.84
SDdif, Random variation of double measurements or scans; Bias, Systematic variation between two measurements
or two scans; LOA: Limits of agreement around the bias (SDdif * 1.96); Intra-observer repeated measurement,
trapezium BMD, and HU measured twice on the same scan.J. Funct. Biomater. 2018, 9, 9 4 of 8
We found an excellent correlation (r = 0.94 (95% CI: 0.90–0.96), p < 0.001) between the DXA
circumference measured BMD of the trapezium and the DXA inner-ellipse measured BMD of the
trapezium. In the trapezium there was a moderate correlation between the CT-measured HU and
the DXA-measured BMD using the circumference method (r = 0.49 (95% CI: 0.29–0.65), p < 0.001),
and with the DXA-measured BMD using the inner-ellipse method (r = 0.55 (95% CI: 0.36–0.69),
p < 0.001). In the distal radius we also found a moderate/good correlation (r = 0.67 (95% CI: 0.52–0.78),
p < 0.001) between the CT-measured HU and the BMD measured by DXA. We did not find a statistically
significant difference between the correlations of the CT-measured HU and the circumference method,
and between the CT-measured HU and the inner-ellipse method (p = 0.093).
3. Discussion
Bone density may influence the primary fixation of cementless implants [18], and poor bone
density is likely to increase the risk of implant failure. Before deciding on the treatment of
TM osteoarthritis, it would therefore be useful to determine the bone density of the trapezium,
as a surrogate marker of bone quality. Identification of the cortical perimeter of the trapezium on
an anteroposterior (AP) DXA scan is visually challenging, requiring knowledge of the trapezium’s
three-dimensional shape and orientation in the wrist, and is therefore time-consuming and error-prone.
Furthermore, some overlap between other carpal/metacarpal bones and the trapezium in the scans
is unavoidable, whereby bone density from neighboring bones may be included with the trapezium
circumference BMD measurement method. This study describes a novel and more simple method,
where the BMD of the osteoarthritic trapezium can be determined by measuring the BMD in the center
of the trapezium—in the cancellous bone zone within the cortical edges. This is much simpler to
mark, and has several clinical advantages. Avoiding the trapezium cortex on the DXA scans eliminates
higher BMD values from subchondral sclerosis, cortical bone, and overlap of neighboring bones.
In addition, the BMD measured by the inner-ellipse method is likely to be of greater clinical relevance,
as it is measured in the center of the trapezium bone where the cup of the TM arthroplasty is fixed.
The present study found the two DXA methods—the circumference method and the inner-ellipse
method—to have an excellent correlation.
Substitution of DXA scans with HU measurements from pre-existing CT scans performed for
other purposes (such as visualizing the degenerative changes in the TM or neighboring joints) has
the advantage of providing an alternative method for determining regional bone quality without
additional expense for the hospital or a radiation dose to the patient. However, we only found
a moderate correlation between trapezium bone attenuation values (HU units) obtained from CT
scans and BMD as measured by DXA. This is in accordance with the findings from a similar study by
Schreiber et al. [17] that compared HU units with BMD in the lumbar spine (r2 = 0.44, p < 0.001).
In the distal radius, we also found a moderate correlation between DXA and HU measurements.
Where CT is already used as a pre-operative examination when treating comminuted distal radius
fractures, HU may give an indication of the bone quality of the radius and be of value when deciding on
the specific fracture treatment e.g., augmentation by external fixation. In a recent study, HU was used
to examine bone quality in the trapezium and revealed that bone density of the proximal metacarpal
bone and the trapezium was lower in patients with first grade osteoarthritis in the trapeziometacarpal
joint as compared to patients with no osteoarthritis [19]. We found 22% lower HU in the trapezium in
high grade osteoarthritis patients (HU mean 288) compared with low grade osteoarthritis (HU mean
369) in Schreiber et al. [19]. The low grade osteoarthritis patients from Schreiber et al. had 12% lower
HU than control subjects, and our high grade osteoarthritis patients had 31% lower HU then control
subjects from Schreiber et al. [19]. However, a limitation may be that OA grading has low intra-rater
and inter-rater reliability [20].
BMD was significantly higher in men compared to women with both DXA methods, and also we
found a trend in BMD towards a higher BMD in the young age group (mean 49 years) compared withJ. Funct. Biomater. 2018, 9, 9 5 of 8
the next age group (mean 59 years). In a comparison with a large European reference data, we found
similar BMD of the distal radius for both women and men in the current study.
A major limitation of this study is that only one observer performed the measurements. However,
the inner-ellipse method for DXA BMD measurement is technically less difficult than the circumference
method, and we postulate that this technique will highly useful for daily clinical use. We have previously
tested the inter-observer reliability of trapezium BMD measurement where we found a great correlation
of both repeated measurements Concordance correlation coefficient (CCC = 0.96) and repeated scans
(CCC = 0.89) [16]. Due to this previous study we did not include inter-observer measurements in
this study.
In addition, the HU measurements should be easily applicable to CT scans made for other
purposes, and may be considered for an objective judgement of the bone quality when DXA scans
are not available. Another limitation of this study is that we did not include a healthy control group.
This would be of interest in order to examine the effect of sex and age on BMD measured by DXA
and CT.
The influence of bone density and quality on implant survival in TM total joint arthroplasty
still remains unclear, and normative data so far have not been presented in larger studies. With the
availability of reliable methods for determining the bone density of the trapezium, future research
should focus on the relation between implant failure and trapezium bone density.
4. Materials and Methods
As part of the standard preoperative evaluation for planned TM total joint arthroplasty,
we performed CT and DXA scans of the trapezium on all patients.
4.1. Patients
Sixty-five consecutive patients diagnosed with Eaton–Glickel stage II-IV [21] osteoarthritis of
the TM joint were initially included. Six patients had to be excluded due to insufficient CT scanning
material, leaving 71 hands (14 male and 57 female) in 59 patients (13 males and 46 females), with a mean
age of 59 years; range (40–77).
4.2. Image Acquisition and Analysis
In all patients, we measured the BMD of the trapezium with a GE Lunar iDXA scanner
(GE Healthcare, Milwaukee, WI, USA). The hands were placed with the palm against the scanner bed.
Image files were processed using the software enCORE version 11.40 (GE Healthcare, Milwaukee, WI,
USA) by one observer. In the circumference method, the perimeter of the trapezium was outlined
manually, and the BMD calculated based on the outlined area (Figure 1) [16]. In the inner-ellipse
method, the BMD in the centre of the trapezium was calculated by placing an ellipse inside the
trapezium, avoiding the cortical bone (Figure 1). All measurements were performed by one observer
and repeated within eight weeks by the same observer. The BMD and T-score (German reference
database) of the distal radius was calculated by the software program, which automatically defined
the distal radius very well, but could be corrected manually if needed.
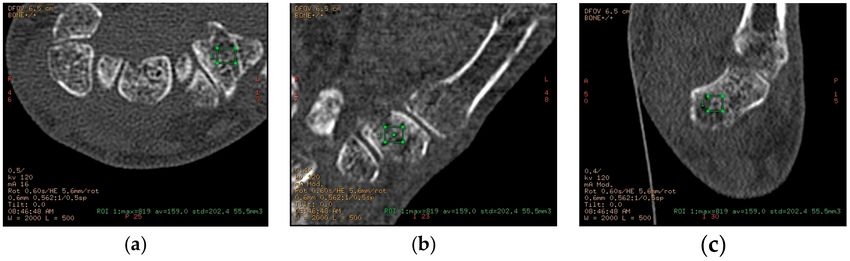
The HU measurements were made by one observer using CT scans of the hand and wrist, which
had been performed to evaluate osteoarthritic changes in the TM joint (Figure 2). All wrists were CT
scanned using a standard bone protocol (0.625 mm slice thickness, bone reconstruction algorithm).
Most scans were with the wrist in question (left or right) scanned alone, but in a small number of
patients both wrists were scanned together in a larger field of view. Axial images were sent to a General
Electric Healthcare Advantage workstation, where sagittal and coronal multiplanar reconstructions
were performed. Measurements of attenuation values in a three-dimensional (3D) volume of trabecular
bone in both trapezium and distal radius were performed on this workstation (Figure 2).
A three-dimensional region of interest (ROI) was defined by manually drawing a rectangular
ROI in all three planes (axial, coronal, sagittal), according to the following constraints: a minimumJ. Funct. Biomater. 2018, 9, 9 6 of 8
volume of 50 mm3 (trapezium) or 250 mm3 (distal radius), no cortical bone was visibly included,
and large focal alterations in bone structure were avoided—such as cysts or islands of sclerotic bone.
In some cases, such focal changes could not be entirely excluded from the ROI. For each ROI, the
following parameters were noted: volume (in mm3 ), maximum attenuation value (in Hounsfield units
(HU)), average attenuation (HU), and standard deviation. Each set of measurements (trapezium and
distal radius) was performed twice for each wrist by the same observer, with at least 14 days’ (up to
28 days) interval.
Figure 1. BMD measurement using the inner-ellipse method (1), and the circumference method (2).
The BMD is calculated on the basis of the outlined area.
Figure 2. (a) Bone mineral density determination by measuring CT attenuation (in HU) in
a three-dimensional volume, defined by a rectangular ROI in axial plane; (b) Bone mineral density
determination by measuring CT attenuation (in HU) in a three-dimensional volume, defined by
a rectangular ROI in coronal plane; (c) Bone mineral density determination by measuring CT attenuation
(in HU) in a three-dimensional volume, defined by a rectangular ROI in sagittal plane. Green square:
The region of interest on CT scan which was placed in the cancellous bone of the trapezium in all three
(a, b, c) scan planes for assessment of HU values.
4.3. Statistical Analysis
We created an age group variable, consisting of three categories from the youngest to oldest
with the 24 youngest in the first group (mean age 49.8, 95% CI (47.9–51.8)), the next 23 in the second
group (mean age 59.1, 95% CI (58.3–60.0)), and the oldest 24 in the third group (mean age 68.3,
95% CI (66.6–69.9)). These were used to compare the patients’ distal radius BMDs to the referenceJ. Funct. Biomater. 2018, 9, 9 7 of 8
distal radius BMD values for Northern Europeans [22] within each age group and total by sex using
a one-sample t-test (Table 1). Test for normality was made using Shapiro-Wilk W test, histograms,
and quantile-quantile (QQ) plots. The significance level was set to 0.05. The mean DXA trapezium
BMD measurements and CT HU measurement was compared between sex (Table 2) and age groups
(Table 3). The effects of sex and age on CT-measured HU and trapezium DXA-measured BMD were
tested using multiple regression analysis (Table 4).
The correlation between DXA trapezium BMD inner-ellipse method, DXA trapezium BMD
circumference method, and CT HU was tested using Pearson’s correlation test. A significance level of
0.05 was used. We used the Fisher’s z transformation to transform the r-values to z-values, making it
possible to calculate 95% confidence intervals (95% CI) to the z-value, which was then transformed back
to r-values using Fisher’s reverse transformation. We used the cocor statistical software package [23] to
test the difference between the correlations of: (1) CT-measured HU and DXA trapezium inner-ellipse
measured BMD and (2) CT-measured HU and DXA trapezium circumference measured BMD.
4.4. Reproducibility
We tested the DXA inner-ellipse method intra-observer repeatability comparing the rater’s two
measurements on each scan giving two repeatability values. This was further tested by comparing
the mean of the two measurements of the first scan to the mean of the two measurements of the
second scan.
5. Conclusions
The new and technically easier DXA inner-ellipse method can replace the DXA circumference
method in estimation of bone density of the trapezium, as there is an excellent correlation between
methods. CT scans correlated moderately with DXA measurements in the trapezium and might be
useful to examine the bone quality.
Further research should determine the correlation between CT scans and DXA measurements and
whether or not poor bone quality may lead to an increased risk of implant failure in trapeziometacarpal
total joint replacement.
Author Contributions: Maiken Stilling and Torben Bæk Hansen designed the study; Kamille Breddam Mosegaard
and Nadia Bouteldja performed the measurements; Sebastian Breddam Mosegaard and Maiken Stilling performed
the analysis and interpretation of data; all authors wrote the paper.
Conflicts of Interest: The authors declare no conflict of interest.
References
1. Hansen, T.B.; Snerum, L. Elektra trapeziometacarpal prosthesis for treatment of osteoarthrosis of the basal
joint of the thumb. Scand. J. Plast. Reconstr. Surg. Hand Surg. 2008, 42, 316–319. [CrossRef] [PubMed]
2. Hansen, T.B.; Vainorius, D. High loosening rate of the moje acamo prosthesis for treating osteoarthritis of the
trapeziometacarpal joint. J. Hand Surg. Eur. Vol. 2008, 33, 571–574. [CrossRef] [PubMed]
3. Hernandez-Cortes, P.; Pajares-Lopez, M.; Robles-Molina, M.J.; Gomez-Sanchez, R.; Toledo-Romero, M.A.;
De Torres-Urrea, J. Two-year outcomes of elektra prosthesis for trapeziometacarpal osteoarthritis:
A longitudinal cohort study. J. Hand Surg. Eur. Vol. 2012, 37, 130–137. [CrossRef] [PubMed]
4. Klahn, A.; Nygaard, M.; Gvozdenovic, R.; Boeckstyns, M.E. Elektra prosthesis for trapeziometacarpal osteoarthritis:
A follow-up of 39 consecutive cases. J. Hand Surg. Eur. Vol. 2012, 37, 605–609. [CrossRef] [PubMed]
5. Perez-Ubeda, M.J.; Garcia-Lopez, A.; Marco Martinez, F.; Junyent Vilanova, E.; Molina Martos, M.;
Lopez-Duran Stern, L. Results of the cemented sr trapeziometacarpal prosthesis in the treatment of thumb
carpometacarpal osteoarthritis. J. Hand Surg. 2003, 28, 917–925. [CrossRef]
6. Wachtl, S.W.; Guggenheim, P.R.; Sennwald, G.R. Cemented and non-cemented replacements of the
trapeziometacarpal joint. J. Bone Joint Surg. Br. Vol. 1998, 80, 121–125. [CrossRef]J. Funct. Biomater. 2018, 9, 9 8 of 8
7. Hansen, T.B.; Meier, M.; Moller, M.C.; Larsen, K.; Stilling, M. Primary cup fixation with different designs of
trapeziometacarpal total joint trapezium components: A radiostereometric analysis in a pig bone model.
J. Bone Joint Surg. Br. Vol. 2011, 36, 285–290. [CrossRef] [PubMed]
8. Brownbill, R.A.; Ilich, J.Z. Validation of the use of the hand for estimating bone mineral density in other
skeletal sites by dxa in healthy and osteoarthritic women. J. Clin. Densitom. 2002, 5, 273–282. [CrossRef]
9. El-Sherif, H.E.; Kamal, R.; Moawyah, O. Hand osteoarthritis and bone mineral density in postmenopausal
women; clinical relevance to hand function, pain and disability. Osteoarthr. Cartil. 2008, 16, 12–17. [CrossRef]
[PubMed]
10. Haara, M.M.; Arokoski, J.P.; Kroger, H.; Karkkainen, A.; Manninen, P.; Knekt, P.; Impivaara, O.; Heliovaara, M.
Association of radiological hand osteoarthritis with bone mineral mass: A population study. Rheumatology
2005, 44, 1549–1554. [CrossRef] [PubMed]
11. Haugen, I.K.; Slatkowsky-Christensen, B.; Orstavik, R.; Kvien, T.K. Bone mineral density in patients with hand
osteoarthritis compared to population controls and patients with rheumatoid arthritis. Ann. Rheum. Dis. 2007,
66, 1594–1598. [CrossRef] [PubMed]
12. Kim, S.K.; Park, S.H.; Choe, J.Y. Lower bone mineral density of forearm in postmenopausal patients with
radiographic hand osteoarthritis. Rheumatol. Int. 2010, 30, 605–612. [CrossRef] [PubMed]
13. Schneider, D.L.; Barrett-Connor, E.; Morton, D.J.; Weisman, M. Bone mineral density and clinical hand
osteoarthritis in elderly men and women: The rancho bernardo study. J. Rheumatol. 2002, 29, 1467–1472.
[PubMed]
14. Zoli, A.; Lizzio, M.M.; Capuano, A.; Massafra, U.; Barini, A.; Ferraccioli, G. Osteoporosis and bone metabolism in
postmenopausal women with osteoarthritis of the hand. Menopause 2006, 13, 462–466. [CrossRef] [PubMed]
15. Licata, A. Bone density vs bone quality: What’s a clinician to do? Clevel. Clin. J. Med. 2009, 76, 331–336. [CrossRef]
[PubMed]
16. Hansen, T.B.; Mosegaard, K.B.; Sorensen, O.G.; Mortensen, J.; Stilling, M. Bone mineral density of the
trapezium in osteoarthritic trapeziometacarpal joints. J. Hand Surg. Eur. Vol. 2013, 38, 875–879. [CrossRef]
[PubMed]
17. Schreiber, J.J.; Anderson, P.A.; Rosas, H.G.; Buchholz, A.L.; Au, A.G. Hounsfield units for assessing bone
mineral density and strength: A tool for osteoporosis management. J. Bone Joint Surg. Am. Vol. 2011, 93,
1057–1063. [CrossRef] [PubMed]
18. Westphal, F.M.; Bishop, N.; Honl, M.; Hille, E.; Puschel, K.; Morlock, M.M. Migration and cyclic motion
of a new short-stemmed hip prosthesis—A biomechanical in vitro study. Clin. Biomech. 2006, 21, 834–840.
[CrossRef] [PubMed]
19. Schreiber, J.J.; McQuillan, T.J.; Halilaj, E.; Crisco, J.J.; Weiss, A.P.; Patel, T.; Kenney, D.; Ladd, A.L. Changes
in local bone density in early thumb carpometacarpal joint osteoarthritis. J. Hand Surg. 2018, 43, 33–38.
[CrossRef] [PubMed]
20. Hansen, T.B.; Sorensen, O.G.; Kirkeby, L.; Homilius, M.; Amstrup, A.L. Computed tomography improves
intra-observer reliability, but not the inter-observer reliability of the eaton-glickel classification. J. Hand Surg.
Eur. Vol. 2013, 38, 187–191. [CrossRef] [PubMed]
21. Eaton, R.G.; Glickel, S.Z. Trapeziometacarpal osteoarthritis. Staging as a rationale for treatment. Hand Clin.
1987, 3, 455–471. [PubMed]
22. GE Healthcare Lunar. User Manual: Encore-Based Densitometer LU43616DK; Revision 16 July 2015; GE Healthcare
Lunar: St. Clair, MI, USA, 2015.
23. Diedenhofen, B.; Musch, J. Cocor: A comprehensive solution for the statistical comparison of correlations.
PLoS ONE 2015, 10, e0121945. [CrossRef] [PubMed]
© 2018 by the authors. Licensee MDPI, Basel, Switzerland. This article is an open access
article distributed under the terms and conditions of the Creative Commons Attribution
(CC BY) license (http://creativecommons.org/licenses/by/4.0/).You can also read