A Study on the Laterally Loaded Pile Behaviour in Liquefied Soil Using P-Y Method - IOPscience
←
→
Page content transcription
If your browser does not render page correctly, please read the page content below
IOP Conference Series: Materials Science and Engineering

PAPER • OPEN ACCESS

A Study on the Laterally Loaded Pile Behaviour in Liquefied Soil Using
P-Y Method
To cite this article: Pinar Sezin Ozturk Kardogan et al 2019 IOP Conf. Ser.: Mater. Sci. Eng. 471 042015

View the article online for updates and enhancements.

                               This content was downloaded from IP address 46.4.80.155 on 15/11/2020 at 18:21
WMCAUS 2018 IOP Publishing
IOP Conf. Series: Materials Science and Engineering 471 (2019) 042015 doi:10.1088/1757-899X/471/4/042015
A Study on the Laterally Loaded Pile Behaviour in Liquefied
Soil Using P-Y Method
Pinar Sezin Ozturk Kardogan 1, Nihat Sinan Isik 1, Mehmet Inanc Onur 2
Subhamoy Bhattacharya 3
1
Gazi University Faculty of Technology, Department of Civil Engineering, Turkey
2
Anadolu University, Engineering Faculty, Department of Civil Engineering, Turkey
3
University of Surrey, Department of Civil and Environmental Engineering, UK
sezinozturk@gazi.edu.tr
Abstract. Under repeated seismic loads during an earthquake, increase of pore water pressure in
cohesionless, saturated and loose soils leads to decreased shear strength and therefore
liquefaction occurs. Literature reports of numerous cases involving damage due to liquefied soil
which makes the pile behaviour and performance in liquefied soil even more important. It is
possible to investigate the behaviour of piles located in the liquefied soil under inertial loads
using linear spring model, p-y method or numerical analyses and a suitable liquefaction
constitutive model in time. This study investigates the behaviour of two piles, located in the
foundation of the ''Niigata Family Courthouse” which was damaged during the Niigata
earthquake of 1964, under inertial loads in liquefied soil. The soil profile identified for this case
and the piles are analyzed using p-y method and linear spring approach. Pile deformations and
bending moments calculated with these two methods were compared.
1. Introduction
Piles are structural members commonly made of wood, concrete, steel or composite materials in order
to convey the load arising from upper structure to the load bearing lower layers which are located deep
in the soil profile [1]. General purpose of piles is to convey the vertical loads of the foundation acting
on soil layers with poor load bearing properties to soil layer with better loadbearing capacity [2].
Moreover, piles are also designed in order to bear lateral loads in some cases. It is possible to conduct
simple calculations with empirical approaches for piles performing under vertical loads, however, it is
rather hard to talk about a widely accepted design principle for piles bearing lateral loads. The behaviour
of laterally loaded piles is a problem of three dimensional and nonlinear soil-structure interaction which
is significantly affected by the stress-deformation behaviour of the soil (shear strength, elasticity
modulus and volume change characteristics of soil) and the soil-pile interface behaviour [3].
Laterally loaded piles are significantly distinguished from vertically loaded piles in terms of their
behaviour under load and design principles. The design of laterally loaded piles requires the estimation
of bending moment and the lateral displacement under the load with respect to desired project criteria,
soil conditions and pile geometry [4].
It is not uncommon for the pile foundations to be damaged with varying deformations due to
liquefaction under repeated loads during earthquakes. Damages in piles due to liquefied soil are a result
of the lack of definition of the additional dynamic loads acting on the piles as soil liquefies during an
earthquake in the design process [5].
Content from this work may be used under the terms of the Creative Commons Attribution 3.0 licence. Any further distribution
of this work must maintain attribution to the author(s) and the title of the work, journal citation and DOI.
Published under licence by IOP Publishing Ltd 1WMCAUS 2018 IOP Publishing
IOP Conf. Series: Materials Science and Engineering 471 (2019) 042015 doi:10.1088/1757-899X/471/4/042015
Literature offers many studies on the damages on laterally loaded piles during an earthquake which
also included small scale lab and centrifugal experiments. Many of these studies identified the pile
length, its diameter and soil profile as the factors effecting pile behaviour.
Cubronovski and Bowen (2008) reported a case analysis for liquefied soil profile. This study
compared the effective stress analysis and pseudo-static analysis. Authors investigated the performance
of pile foundations in liquefied soil, under seismic loads using time-history analysis [6]. Takahashi and
Takemura (2005) analyzed the pile-supported port structure which was damaged in the Hyogo-ken
Nambu earthquake in Takahama, 1995 using a parametric design and centrifugal experiments [7]. Finn
and Fujita (2002) emphasized the importance of pile design for soil liquefied under earthquake loads.
Authors investigated a pile sample of 1.5 m diameter designed for a 14-floors building and its
foundation. Their conclusion was that the most critical criteria for pile design is secured pile tips, the
ability to find the soil with liquefying and non-liquefying layered structure and inclusion of earthquake
loads [8]. Bhattacharya and Bolton (2004) noted that bending effects must be considered when designing
a pile under earthquake loads in liquefied soil. Bhattacharya (2003) found in a centrifugal test that piles
placed in liquefied soil are not supported sufficiently as the soil loses its strength which in return leads
to the collapse of piles due to the bending effect. Authors suggested that load carrying capacity tests
along with bending investigations must be conducted when designing piles [10]. Finn (2015)
investigated in a structural model the changes in rigidity due to the rotation and displacement of piles
under earthquake loads in liquefied soil. As a conclusion, author emphasized the importance of
considering the structure-pile-soil interaction and the environmental loading in the pile design [11].
Hamada (1992) reported the damages the Niigata Family Courthouse suffered during the Niigata
Earthquake of 1964 [12]. In their publication, Madabhushi, Knappett and Haigh (2010) used the data
from Hamada’s report and explored the damages in the piles [13]. Yao et al., (2004) conducted a
vibrating table experiment in order to explore the pile-soil-upper structure behaviour in liquefied soil
using a laminar box of 4 m in length and 2 m in width and height. Authors emphasized the need to
consider the non-steady state of soil before liquefaction as bending moment and the pressure of the soil
acting on the pile may reach the maximum level at the liquefaction process [14].
In the current study, displacement and bending moments which may act on the laterally loaded pile
in liquefied soil are analyzed using p-y method in LPILE software and linear spring method in SAP2000
software considering only the inertial loads. Deformation profiles and moments were compared with the
data obtained from the analyses.
2. Modelling Methods for the Laterally Loaded Pile Behaviour
The issue of laterally loaded piles is a problem of nonlinear structure-soil interaction and the pile
behaviour under lateral loads concerns the interaction between the pile and the soil.
Available methods for the analysis of a single laterally loaded pile can be listed as follows: [15]
• Limit state method,
• Foundation soil reaction method,
• P-Y curve method,
• Elasticity analysis method, and
• Finite element method.
Broms method [16] is a limit state method used in order to determine the ultimate lateral load bearing
capacity of a single laterally loaded pile. Foundation soil reaction method [16];
1. While the soil strength and pile displacement values are modeled proportionally, studies
show that soil strength is not a linear variable.
2. Horizontal coefficient is rather a parameter of the model than an essential soil property.
3. Although soil is continuous, soil strength is modeled using discontinuous springs.
4. Pile geometry is implicitly considered. Soil strength in P-Y method shows properties
similar to those in foundation soil method except the fact that it is a nonlinear function of
pile displacement.
2WMCAUS 2018 IOP Publishing
IOP Conf. Series: Materials Science and Engineering 471 (2019) 042015 doi:10.1088/1757-899X/471/4/042015
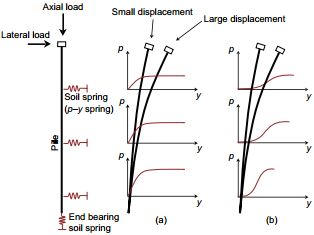
P-y method is described as spring systems placed with specific intervals along the pile. Where “y” is
the displacement of the pile due to lateral forces, “pu” is the force soil acts on the unit length of the pile
as a result of the displacement. Figure 1(a) shows the soil-pile interaction, lateral, vertical, and end
bearing capacity, lateral springs (p-y spring), vertical springs (t-z springs), end springs (q-z spring) in
BNWF model [17]. P-Y curves method is efficient in evaluating the behaviour of laterally loaded piles.
Figures 1(b) and 1(c) shows the states of p-y curves before and during liquefaction. Following steps
must be observed when creating p-y curves [17];
1. Drill logs must be assessed for soil parameters,
2. The length of the pile foundation must be defined,
3. A stress-unit deformation graph must be produced for liquefying soil,
4. P-Y curves must be produced using the soil stress-unit deformation graph.
Foundation soil reaction method has found itself an extensive area of use as the p-y curve method
and beams on elastic foundation method are easy to use also offering logical results.
Figure 1. (a) BNWF model of pile-soil interaction, (b) pre-liquefaction, and (c) post-liquefaction p-y
curves [17].
Elastic analysis method is an easy-to-use method for pile displacement calculations taking into
account the soil at all times. Moreover, soil modulus is taken elastic and considered to be changing with
the changes in the stress.
The concept of modulus of subgrade reaction is based on the assumption that the soil is elastic and
that it consists of an infinite number of springs with minimal distance between them. Where modulus of
subgrade reaction is ks, stress at any point of the soil is q and the placement at that point is calculated as
a ratio of ∆H in Figure 2 [18].
Figure 2. Definition of modulus of subgrade reaction [18]
3WMCAUS 2018 IOP Publishing
IOP Conf. Series: Materials Science and Engineering 471 (2019) 042015 doi:10.1088/1757-899X/471/4/042015
In the aforementioned methods, the displacement of the foundation system due to lateral load will
not reach to a point to affect the upper structure, a range of load will be defined to not exceed the soil
collapse threshold taking into consideration the shear strength of the soil around the pile under load, and
the pile dimensions will be defined accordingly. The lateral load acting on the pile will be sufficient
against bending and collapse and a security coefficient will be utilized. Among these methods, the
modulus of subgrade reaction method and p-y method are the most commonly preferred in practice. In
the modulus of subgrade reaction method, it is assumed that soil acts as a vertical beam having modeled
it with individual springs. p-y method, on the other hand, takes the plasticity properties into account and
defines the changes in the form as a function of these properties.
Literature offers abundant research on the analysis of laterally loaded piles in liquefying soil. These
studies commonly used p-y method and modulus of subgrade reaction method. Among the techniques
used in p-y curves are as follows [19]:
• p multiplier (α): This technique uses strength reduction factor SPT N1(60) number of impacts
[18], This technique is the most popular one for the liquefying soils in the BNWF (Beam on
Nonlinear Winkler Foundation) model [19]. Figure 3(a) shows that when lateral displacement
relatively small, soil-pile interaction depends on the onset rigidity of the curve. However, when
the displacement is significant, then the ultimate soil strength is affected by the foundation
rigidity. If p-y curves are concave upward, then the pile will have a nonlinear behavior with
small displacement and zero strength (Figure 3(b)) [20]. In liquefying soil, a pile will behave
like a free moving column and will bend under significant axial loads.
Figure 3. Effect of the shape of p–y curve on the mobilised strength and stiffness of a pile foundation
in a liquefied layer (solid lines schematically indicate the deflected shape of the pile at small and large
displacement): (a) p–y curves from p-multiplier approach; (b) proposed strain-hardening p–y curves
[20].
• Cu factor: This method presumes that strength reduction factor changes depending on the level
of liquefaction in a totally liquefied soil in accordance with the p multiplier method [19].
4WMCAUS 2018 IOP Publishing
IOP Conf. Series: Materials Science and Engineering 471 (2019) 042015 doi:10.1088/1757-899X/471/4/042015
• Residual strength method: Many researchers claimed that sandy soil acts like soft clay at the
moment of total liquefaction. According to researchers, p-y curves are similar to the curves of
soft clay under repeated loading [19]. However, maximum lateral strength can be replaced with
undrained residual shear strength of sand [19].
• Zero strength method: Residual shear strength in liquefying soil depends on several parameters
which in return makes it rather challenging to assess [19]. It was speculated that effective stress
must be zero at the total liquefaction moment and that the shear strength of the soil must also
be zero [19].
Indeed, p-y curve will show increased slope with increased deformation in liquefying soil, but this
behaviour can be explained as hardening with larger displacement and it occurs under specific
conditions. Nevertheless, the common practice attempts to decrease the slope of the p-y curve for
liquefied soils. A comparison of the results obtained from analyses and experiments showed that p-y
method is more reliable in the estimation of pile behaviour than modulus of subgrade reaction method.
Experiments conducted on sand samples with varying density showed that soil density affects the pile
behavior. It was reported that pile displacement decreases as the level of soil density increases [21].
Dynamic soil-pile interaction is a complicated phenomenon. Lateral soil rigidity is generally
explained as a p-y curve for earthquake load and it is accepted as a parameter used to estimate the pile
reaction. The shape of p-y curve and rigidity parameters play an important role in the pile reaction to
lateral seismic loading [13]. In pile groups, the slope of p-y curves decreases for continued deformation
in non-liquefying sand soil, while the slope increases for liquefying soils [22]. This tendency is
explained by the load-induced expansion and the decreasing pore water pressure around the piles [22].
Rigidity of p-y curves and excessive pore water pressure decreased with increasing depth. Structure-soil
interaction is a result of the inertial and kinematic interactions. The assumption that inertial effect is not
significant when compared to kinematic interaction for high-rise, long-period structure is generally
valid, however, it is a simple idea [23].
In this study, only the inertial effects and not the kinematic effects were considered in the analyses.
It is necessary to obtain design extents having combined the effects actin on the soil and piles during
kinematic and inertial interaction phases, taking both interactions into account [24]. The effect of inertial
interaction (for the range of foundations and structure parameters considered) is, in general, to increase
the pile head response but to significantly decrease the response of the structure [25]. It was found that
the LPILE software is recommendable for soil-pile interaction analyses when SAP2000, Abaqus/Cae
and LPILE software, were compared. Increased number of springs improves the results obtained from
the analyses conducted on SAP2000 [26]. Numerical analyses were run on LPILE and SAP2000
software. Rollins’ liquefaction model is used with LPILE software, while analyses were conducted using
modulus of subgrade reaction with SAP2000. Empirical formulas were used in the definition of
coefficients in SAP2000 model and the modulus of subgrade reactions were reduced by one tenth at the
liquefying soil layer as the p multiplier of N1(60) corrected SPT value 7-8 corresponds to 0.1 as suggested
by Brandenberg et al., (2005) [27]. Deformation profiles and moments were compared with the data
obtained from the analyses.
3. A case sample and parametric study
For the parametric study, the case of Niigata Family Courthouse (NFCH) building which was damaged
in the Niigata earthquake of 1964 was taken. The pile system available for the NFCH building was
damaged due to displacement which in return led to 1ᵒ vertical slope of the building. After being used
for another 25 years, the building was rebuilt. During the construction work, 2 piles were extracted and
investigated. 1st pile was 6 m long and 35 cm in diameter and the 2nd pile was 9 m long and 35 cm in
diameter [13]. Pile samples were then analyzed comparing the displacement and moment values for
liquefying and non-liquefying soil profiles at 4 m, 5 m, and 8 m using LPILE and SAP2000 software.
Table 1 shows the properties of the piles with 35 cm diameter [28].
5WMCAUS 2018 IOP Publishing
IOP Conf. Series: Materials Science and Engineering 471 (2019) 042015 doi:10.1088/1757-899X/471/4/042015
Table 1. Material properties for piles
Pile Properties Pile No 1 Pile No 2
Length (m) 6 9
EI (kN.m2 ) 5625 7500
Length (m) 6 9
Analyses with LPILE software were proved to be impossible as the pile was too fragile and the cross-
section was insufficient which leads to yielding to the bending effects. Table 2 shows the maximum
pile displacement and maximum moment values for Piles No. 1 and 2 obtained from the analysis
conducted with SAP2000 software.
Table 2. Results of SAP2000 for piles no 1 and piles no 2.
SAP2000 Results
Liquefaction Depth Max. displacement (mm) Max. moment (kN.m)
Pile No 1
4 54 37.26
5 54 37.24
No Liquefaction 9 20.08
Pile No 2
4 50 40.49
5 51 40.40
8 51 40.06
No Liquefaction 4 15.89
In this case sample, nonlinear analyses conducted with LPILE software were overwhelmed due to
the mechanical properties of the piles and insufficient diameter, however, analyses conducted with
SAP2000 software gave results as it runs elastic analyses. The analyses with SAP2000 were not the
correct approach as it assumes that the soil is linear and as it models using springs. In the SAP2000
analysis, moment values and displacements were not significantly different as the liquefaction depth
increased. The differences found are in relation with the socketing depth of the pile and the pile behaved
more rigidly as the depth decreased receiving more moment. As the cross-section and mechanical
properties of the pile were insufficient, a parametric design was used increasing the cross-section and
mechanical properties of the pile. In this study, two piles, 9 m long with 70 cm in diameter and 6 m long
with 50 cm in diameter were analyzed. The effects of pile diameter and length were investigated for the
pile behavior in liquefying soil. Analyses were run on SAP2000 and LPILE software for pile models
with 50 cm and 70 cm diameter. Liquefied soil profile was altered in the analyses and the analyses were
repeated with 50 kN lateral load per pile for liquefaction at 4m, 5m and 8m. Soil properties are shown
in Table 3 and the properties of the concrete used for the pile are shown in Table 4.
Table 3. Soil properties
Precedent Soil Profile (Sand) Effective Unit p-y curve Soil model name
Weight (kN/m3 )
Liquefaction 0-8 Loose 7 Liquefied Sand (Rollins)
at 8 m 8-9 Medium Dense 10 Sand (Reese)
Liquefaction 0-5 Loose 7 Liquefied Sand (Rollins)
at 5 m 5-9 Medium Dense 10 Sand( Reese)
Liquefaction 0-4 Loose 7 Liquefied Sand (Rollins)
at 4 m 4-9 Medium Dense 10 Sand( Reese)
6WMCAUS 2018 IOP Publishing
IOP Conf. Series: Materials Science and Engineering 471 (2019) 042015 doi:10.1088/1757-899X/471/4/042015
Table 4. Concrete properties of piles
Concrete Type Characteristic Unit Weight Modulus of
Compressive (kN/m3 ) Elasticity (MPa)
Strength (MPa)
C25 25 24 30000
Table 5 shows the maximum moment and maximum displacement values obtained from the analyses
performed on LPILE and SAP2000 software for the sample of 9 m length and 70 cm diameter.
Table 5. Maximum moment and maximum displacement values obtained for the sample of 70 cm
diameter
LPILE Results
Liquefaction Depth Max. displacement (mm) Max. moment (kN.m)
4 200 225
5 140 263
8 110 128
No Liquefaction 77 108
SAP2000 Results
Liquefaction Depth Max. Displacement (mm) Max. Moment (kN.m)
4 13.5 149.91
5 17.3 130.6
8 21.3 95.96
No Liquefaction 1.6 44.53
Figure 4 shows the p-y curve graph obtained for the sample of 9 m length and 70 cm diameter which
is produced in accordance with the Rollins’ p-y curves method [22] applied at 1 m, 3 m and 5 m of a
soil profile where liquefaction occurs at the first 5 m. Where, p is the lateral pressure along the pile
(kN/m), y= horizontal displacement of the pile (mm), A=3×10⁻⁷×(z+1)6.05, B=2.80×(z+1)0.11,
C=2.85×(z+1)−0.41, Pd= 3.81×In(d)+5.6 z= depth (Eq.1) [22].
p=Pd.A.(By)C (Dr ͌ 50%) (1)
The same analysis was also run for liquefaction at 4 m and 8 m.
20
15
p (kN/m)
10 1m
3m
5
5m
0
0 0,05 0,1 0,15 0,2
y (m)
Figure 4. p-y curve graph for the soil profile with liquefaction at the first 5 m
7WMCAUS 2018 IOP Publishing
IOP Conf. Series: Materials Science and Engineering 471 (2019) 042015 doi:10.1088/1757-899X/471/4/042015
Figures 5 and 6 show the bending moment and depth values obtained from the pile sample of 9 m
length and 70 cm diameter.
Moment (kN.m)
0 100 200 300
0 No Liquefaction
PileLength (m)
2
Liquefaction at 4
4 m
6 Liquefaction at 5
m
8 Liquefaction at 8
10 m
Figure 5. Bending moment-depth graph of the liquefying soil using LPILE software
Moment (kN.m)
0 50 100 150 200
0 No Liquefaction
2 Liquefaction at 4
Pile Length (m)
4 m
Liquefaction at 5
6 m
8 Liquefaction at 8
m
10
Figure 6. Bending moment-depth graph of the liquefying soil using SAP2000 software
Figures 7 and 8 show the displacement graphs for the pile sample of 9 m length and 70 cm diameter
as obtained from the analyses run on SAP2000 and LPILE software.
Displacement of Pile(mm)
No-Liquefaction
-10 0 10 20 30
0
Liquefaction at
2 4m
Pile Length (m)
4 Liquefaction at
5m
6
Liquefaction at
8 8m
10
Figure 7. Pile length-horizontal displacement in SAP2000 analysis
8WMCAUS 2018 IOP Publishing
IOP Conf. Series: Materials Science and Engineering 471 (2019) 042015 doi:10.1088/1757-899X/471/4/042015
Figure 8. Pile length-horizontal displacement in LPILE analysis
Figures 9 and 10 show the bending moment and depth values obtained from the pile sample of 50
cm length and 6 m diameter.
Moment (kN.m)
0 50 100 150
0
1 No Liquefaction
Pile Length (m)
2
3 Liquefaction at 4 m
4
Liquefaction at 5 m
5 (Pile failed)
6
7
Figure 9. Bending moment-depth graph of the liquefying soil using LPILE software
Moment (kN.m)
0 20 40 60 80
0 No Liquefaction
Pile Length (m)
2
Liquefaction at 4 m
4
6 Liquefaction at 5 m
8
Figure 10. Bending moment-depth graph of the liquefying soil using SAP2000 software
Figures 11 and 12 show the displacement graphs for the pile sample of 6 m length and 50 cm diameter
as obtained from the analyses run on SAP2000 and LPILE software.
9WMCAUS 2018 IOP Publishing
IOP Conf. Series: Materials Science and Engineering 471 (2019) 042015 doi:10.1088/1757-899X/471/4/042015
Figure 11. Pile length-horizontal displacement in SAP2000 analysis
Figure 12. Pile length-horizontal displacement in LPILE analysis
4. Results
This study analyses and compares the laterally loaded pile behaviour in liquefying soil using p-y curve
method (LPILE) and linear spring approach (SAP2000). Kinematic interaction was disregarded in the
calculations and only inertial interaction was considered. Differences are found in the analysis results
obtained using LPILE and SAP2000 software. Especially the pile end deformations calculated using the
reduced linear spring approach and maximum cross-section moments are significantly lower than those
found with the non-linear spring approach, i.e. reduced linear spring approach offers unreliable results.
The main reasons behind these differences are the fact that p-y curves are not linear in liquefying soil
and that it hardens with higher deformation; liquefied soil behave as a softer material especially at lower
levels. As expected, the lowest moment and the lowest pile displacement was obtained from the soil
profile with zero liquefaction. As the liquefying soil layer thickness increases, moment value was
increased up to 8 m thickness, however, it was decreased again at 8 m thickness. The reason behind this
finding is that socketing depth decreases as liquefying layer thickness increases which leads to lower
bending moment and that pile acts relatively rigid causing it to topple. As a result, pile displacement has
become more critical and an increase in the displacement was observed. In a soil profile with
liquefaction at the first 4 m and 5 m, on the other hand, the pile stands against the displacement due to
the non-liquefying soil socketing effect. Nevertheless, moment value was higher as the pile was subject
to increased bending. A closer look into the pile length-moment graphs showed that moment value
obtained from the analyses performed using LPILE software was the highest for the pile sample of 70
cm diameter in a soil profile with liquefaction at the first 5 m. The highest value from the analyses
performed using SAP2000 software, on the other hand, was found for the soil profile with liquefaction
at the first 4 m. The pile of 50 cm diameter was yielded in the soil profile with liquefaction at the first
5m in the analysis run on LPILE software. The moment levels obtained from SAP2000 analyses were
lower than those of LPILE software and it was observed that the displacement estimations were rather
smaller. In the SAP2000 model, linear spring constants were used and the spring coefficient was reduced
for the liquefied soil and it was hypothesized that soil does not yield. However, such an assumption is
not the correct approach as soil may have a non-linear behaviour under specific loads in the analyses
10WMCAUS 2018 IOP Publishing
IOP Conf. Series: Materials Science and Engineering 471 (2019) 042015 doi:10.1088/1757-899X/471/4/042015
conducted using inertial loads. In conclusion, it can be said that analyses run on LPILE software offered
a better reliability.
As modelling the soil using individual springs is not the best approach, it is necessary to use analysis
designs which take elasticity properties along with plasticity properties into account. Therefore, it can
be suggested that p-y method in which plasticity properties are considered and deformations are defined
as a function of these properties is a better method to use. In the light of other studies available in the
literature, it was found that p-y method offers more reliable analyses when compared to the modulus of
subgrade reaction method.
References
[1] Alkaya, D. ve Yeşil, B., “Kazık temellerin bilgisayar destekli analizi” Akademik Bilişim, Akdeniz
Üniversitesi, 2013 (In Turkish).
[2] Terzi, N., Kılıç, H. ve Yıldırım, S., “Yanal yüklü kazıkların tasarım yöntemlerinin birbirleri ile
karşılaştırmalı değerlendirilmesi” 1.Geoteknik Sempozyumu, pp. 279-293, 2005 (In Turkish).
[3] Uncuoğlu, E. ve Laman, M., “Yanal yüklü kısa kazıkların davranışının deneysel olarak
incelenmesi” İMO Teknik Dergi, 6257-6278, yazı 394, 2013 (In Turkish).
[4] Terzi, U., Kayış, G. ve Yıldırım, S., “Arazi ortamında yanal yüklü kazık davranışı” Zemin
Mekaniği ve Temel Mühendisliği 11. Ulusal Kongresi, Karadeniz Teknik Üniversitesi,
Trabzon, Türkiye, 2006 (In Turkish).
[5] Teymür,B. ve Yıldız, S.C.,“Sıvılaşabilen zeminlerde kazığın davranışı” Altıncı Ulusal Deprem
Mühendisliği Konferansı, 16-20 Ekim, İstanbul, (2007). (In Turkish)
[6] Bowen, H.,J. and Cubrinovski, M., “Effective stress analysis of piles in liquefiable soil;a case
study of a bridge foundation” Bulletin of The New Zealand Society For Earthquake
Engineering, Vol.41, No: 4, December, 2008.
[7] Takahashi, A. and Takemura, J. “Liqufection–induced large displacement of pile-suppored
wharf” Soil Dynamics and Earthquake Engineering, pp.811-825, 2005.
[8] Finn,W.D.L. and Fujita,N., “Piles in liquefiable soils: seismic analysis and design issues” Soil
Dyanamics and Earthquake Engineering, pp.731-742, 2002.
[9] Bhattacharya, S. and Bolton, M., “Buckling of piles during earthquake liquefaction” 13th World
Conference on Earthquake Engineering, Vancouver, B.C., Canada, August 1-6, Paper No.95,
2004.
[10] Bhattacharya, S., “Pile instability during earthquake liquefaction” PhD Thesis, University of
Cambridge, UK, 2003.
[11] Finn, W.D. L., “1st Ishihara Lecture: An over view of the behavior of pile foundations in
liquefiable and non-liquefiable soils during earthquake excitation” Soil Dynamics and
Earthquake Engineering 68, pp. 69–77, 2015.
[12] Hamada, M., “Case studies of liquefaction and lifelines performance during past earthquake”,
Technical Report NCEER-92-0001, Japanese Case Studies, National Centre for Earthquake
Engineering Research, Buffalo, NY., Volume 1, 1992.
[13] Madabhushi, G., Knappett, J. and Haigh S. '' Design of pile foundations in liquefiable soils ''
Imperial College Press, 2010.
[14] Yao, S., Kobayashi, K., Yoshida, N. and Matsuo, H., '' Interactive behavior of soil–pile-
superstructure system in transient state to liquefaction by means of large shake table tests ''
Soil Dynamics and Earthquake Engineering, 24, pp. 397–409, 2004.
[15] Fan, C.C. and Long, J.H., “Assesment of existing methods for predicting soil response of laterally
loaded piles in sand” Computers&Geotechnics. 32, pp. 274-289, 2005.
[16] Broms BB., “Lateral resistance of piles in cohesionless soils” Journal of the Soil Mechanics and
Foundations Division –ASCE 90(3), pp.123–56, 1964.
[17] Dash, S.R., Rouholamin, M., Lombardi, D. and Bhattacharya, S., “A practical method for
construction of p-y curves for liquefiable soils” Journal of Soil Dynamics and Earthquake
11WMCAUS 2018 IOP Publishing
IOP Conf. Series: Materials Science and Engineering 471 (2019) 042015 doi:10.1088/1757-899X/471/4/042015
Engineering, 97, pp. 478-481, 2017.
[18] Uzuner, B.A., “Temel Mühendisliğine Giriş ”, Derya Kitapevi, 4.basım, 2011 (In Turkish).
[19] Dash, S. R., Bhattacharya, S., Blakeborough, A. and Hyodo, M., “p-y curve to model lateral
response of pile foundatıons in liquefied soils” The 14 th World Conference on Earthquake
Engineering, October 12-17, Beijing, China, 2008.
[20] Lombardi, D., Dash, S.R., Bhattacharya, E. Ibraim,S. , Muir Wood, D. and Taylor, C.A.,
“Construction of simplified design p–y curves for liquefied soils” Géotechnique, October,
2016.
[21] Terzi, U., Kılıç, H. ve Gültekin, S. “Yanal yüklü bir model kazığın kum ortamındaki davranışının
deneysel ve nümerik yöntemlerle incelenmesi” Pamukkale Üniversitesi Mühendislik Fakültesi
Dergisi, Cilt 15, s.119-127, 2009 (In Turkish).
[22] Rollins, K.M., Gerber, T.M., Lane, J.D., Ashford, S.A., “Lateral resistance of a full-scale pile
group in liquefied sand” Journal Of Geotechnical and Geoenvironmental Engineering, ASCE
pp. 115-125, January, 2005.
[23] Çetin, Ö.K., Bilge, H.T., Yunatcı, A.A., Ünsal Oral,S. ve Siyahi,B. “Yüksek katlı yapı
sistemlerinde sismik zemin-kazık-radye-yapı etkileşimi üzerine bir değerlendirme” Prof.
İsmet Ordemir’i Anma Toplantısı ve 7. ODTÜ Geoteknik Mühendisliği Sempozyumu,
Ankara, (2013). (In Turkish)
[24] Aydınoğlu, M.N. “Zayıf zeminlerde yapılan binalarda dinamik yapı-kazık-zemin etkileşimi için
uygulamaya yönelik bir hesap yöntemi” Boğaziçi Üniversitesi Kandilli Rasathanesi ve
Deprem Araştırma Enstitüsü Deprem Mühendisliği Anadilim Dalı, Rapor No: /1, 2011. (In
Turkish)
[25] Maheshwari, B.K., Truman, K.Z., El Naggar, M.H. and Gould, P.L. “Three-dimensional
nonlinear analysis for seismic soil–pile-structure interaction” Soil Dynamics and Earthquake
Engineering 24, pp.343–356, 2004.
[26] Khodair, Y. and Abdel-Moht A., “Numerical analysis of pile–soil interaction under axial and
lateral loads” International Journal of Concrete Structures and Materials, Vol.8, No.3, p.239–
249, September, 2014.
[27] Brandenberg, S.J., Boulanger, R.W., Kutter B.L. and Chang, D. “Behavior of pile foundations in
laterally spreading ground during centrifuge tests” Journal of Geotechnical and
Geoenvironmental Engineering, 131(11), 1378-1391, 2005.
[28] Chang, D.W., Lin, B.S. and Cheng, S.H., “Dynamic pile behaviors affected by liquefaction from
eqweap analysis” 4th International Conference on Earthquake Geotechnical Engineering,
Paper No.1336, June 25-28, 2007.
12You can also read