Dynamic Backlight Gamma on High Dynamic Range
←
→
Page content transcription
If your browser does not render page correctly, please read the page content below
JOURNAL OF DISPLAY TECHNOLOGY, VOL. 4, NO. 2, JUNE 2008 139
Dynamic Backlight Gamma on High Dynamic Range
LCD TVs
Fang-Cheng Lin, Yi-Pai Huang, Lin-Yao Liao, Cheng-Yu Liao, Han-Ping D. Shieh, Fellow, IEEE,
Te-Mei Wang, and Szu-Che Yeh
Abstract—A high dynamic range liquid crystal display (HDR-
LCD) can enhance the contrast ratio of images by utilizing locally
controlled dynamic backlight. We studied the HDR-LCD as a dual-
panel display: a backlight module and a liquid crystal (LC) cell.
As the gamma of the LC signal, the backlight module was also en-
dowed with a gamma function to control the contrast ratio of HDR
images. The inverse of a mapping function (IMF) method proposed
as a dynamic gamma mapping curve for the backlight module, has
been demonstrated to further improve in HDR image quality. By
implementing the IMF method on a 37 HDR-LCD TV with 8 8
backlight zones, the image contrast ratio can reach 20 000:1
while maintaining high brightness, clear image detail, and an av-
erage power reduction of 30%.
Index Terms—Backlight determination, contrast ratio, dual-
panel, dynamic backlight, high dynamic range (HDR).
I. INTRODUCTION
L IQUID crystal displays (LCDs) have become popular
monitors/TVs because of their lightweight, high resolu-
tion, good color performance, and other features. However, a
Fig. 1. Mapping functions of two conventional backlight determination
methods, the average and square root methods [1].
drawback of conventional LCDs is poor image contrast due to
light leakage from liquid crystals and a pair of nonideal cross
drivers and for simplifying hardware computation complexity.
polarizers. After dynamic-backlight-related technologies were
However, due to the decrease of backlight resolution, many
proposed, the backlight signal could be modulated to extend
image details were lost by applying the average method because
the image dynamic range of LCDs [1]–[4]. Consequently, de-
of low backlight brightness. Using the square root method,
termining a suitable backlight signal has become an important
the image details were much clearer than that of the average
factor in high dynamic range (HDR) systems. Two methods,
method, but the contrast ratio (CR) decreased substantially
“average” and “square root,” were conventionally used for the
because of “overenhancement” on darker backlight zones. Ad-
backlight signal determination. The average method calculated
ditionally, both of these methods used fixed backlight mapping
the average gray level of all sub-pixel values in each backlight
curves (see Fig. 1) that might not be suitable for various types
region, the mapping function of original and modified backlight
of images, such as high and low CR images.
levels is an oblique line with a slope of one (Fig. 1). On the
Consequently, we propose an efficient method, the inverse of
other hand, the square root method calculated the average value
a mapping function (IMF), to control backlight signals [5]. The
in each backlight region first, and then took its square root
IMF method is decided by inverting the mapping function of
after normalizing the average value. Thus, it could enhance the
each image; that is to say, the IMF method provides the back-
backlight signal to maintain the brightness of the final image.
light signal with a dynamic gamma to optimize the backlight
For practical applications, the number of backlight blocks
signal, thus it can not only maintain a high contrast ratio but
in the HDR-LCD was reduced for lowering the usage of IC
also maintain maximum luminance and clear image detail. Ad-
ditionally, power consumption and image distortion can also be
Manuscript received November 29, 2007; revised December 27, 2007. This reduced.
work was supported in part by the National Science Council, Taiwan, R.O.C.,
for the Academic Project NSC96-2628-E-009-020-MY3.
F.-C. Lin and L.-Y. Liao are with the Department of Photonics & Institute of
Electro-Optical Engineering, National Chiao Tung University, Hsinchu, Taiwan
II. DUAL-PANEL DISPLAY FOR HDR IMAGES
30010, R.O.C. (e-mail: fclin.eo93g@nctu.edu.tw).
Y.-P. Huang, C.-Y. Liao, and H.-P. D. Shieh are with the Display Institute,
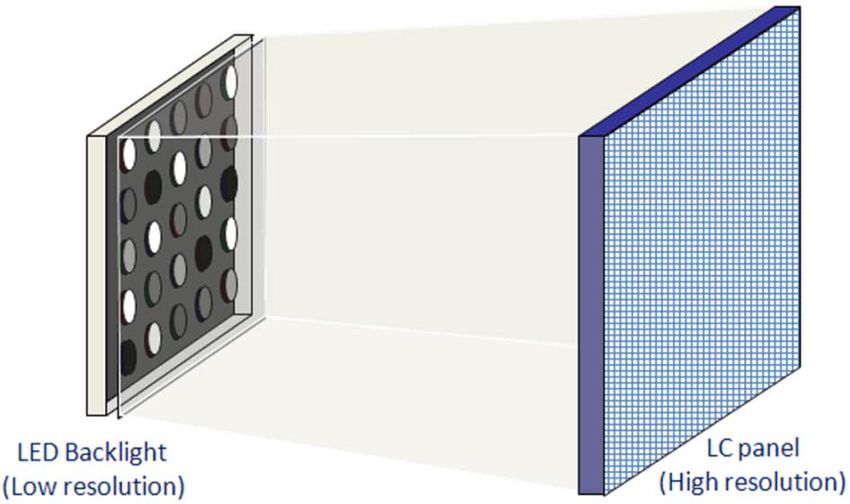
For enhancing the image quality of a HDR-LCD TV, we
National Chiao Tung University, Hsinchu, Taiwa, 30010, R.O.C. studied the HDR-LCD as a dual-panel display (see Fig. 2). One
T.-M. Wang and S.-C. Yeh are with the AU Optronics Corporation, Hsinchu panel was a low resolution backlight module for controlling
Science Park, Hsinchu, Taiwan 300, R.O.C. the contrast ratio of images. According to each input image, a
Color versions of one or more of the figures in this paper are available online
at http://ieeexplore.ieee.org. mapping curve was determined to control the output backlight
Digital Object Identifier 10.1109/JDT.2008.920175 signal. The IMF method was proposed to optimize the backlight
1551-319X/$25.00 © 2008 IEEE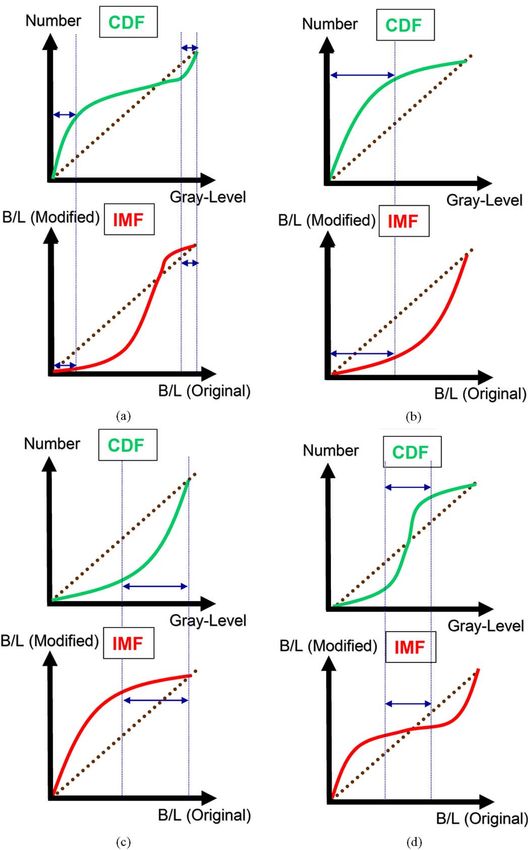
140 JOURNAL OF DISPLAY TECHNOLOGY, VOL. 4, NO. 2, JUNE 2008
Fig. 2. Schema of a dual-panel display with a low resolution backlight and a
high resolution LC panel.
“image” according to each frame, thus it could maintain not
only a high contrast ratio but also the maximum luminance of
images. The second panel, LC cell, was a high resolution panel
for maintaining the image details according to the intensity
distribution of the modified backlight panel. Therefore, a high
dynamic range/high contrast image, could be achieved by a low
resolution display (backlight panel), and the image details were
maintained by a high resolution display (LC panel).
A. Backlight Determination: IMF Method
Several mapping methods have been proposed to success-
fully enhance image performance [6]–[10]. In this paper, his-
togram equalization [6] was utilized as the mapping function.
The basic procedure of the IMF method was first to compute
the global histogram of a target image to get a probability den-
sity function (PDF). Then the PDF from the lowest gray-level
to the highest was accumulated to obtain the mapping function
(also called the cumulative distribution function, CDF) of the
traditional histogram equalization. Finally, inverting the map-
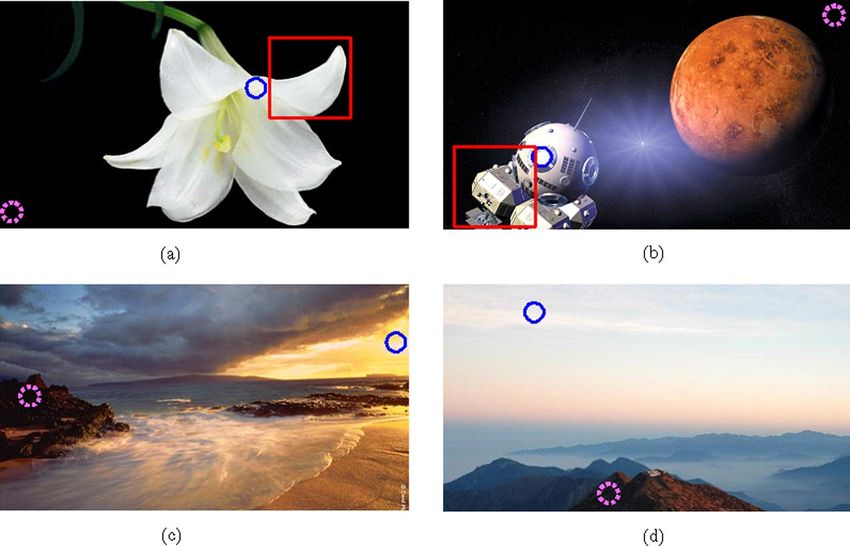
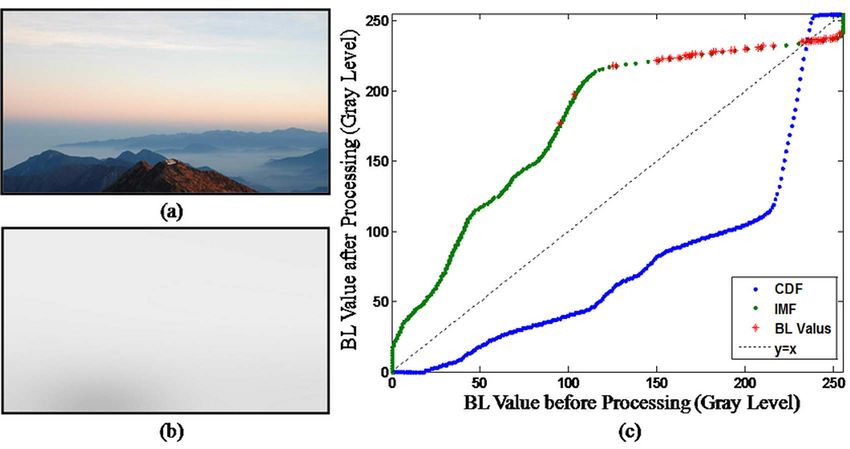
ping function (CDF) of the target image with the oblique line Fig. 3. CDF and IMF response of backlight curve for: (a) high CR; (b) dark;
(c) bright; and (d) medium gray-level images.
generated a new curve for backlight modulation named
“Inverse of a Mapping Function (IMF).”
Before using the IMF processing, the zone-weighting value of
panel could show a high CR image by the IMF method. Addi-
each backlight zone had to be decided. To optimize the image
tionally, IMF also maintained the brightness of the target image
quality and power consumption, a weighting
to show the image details with less distortion. Fig. 4 shows a
was taken for the average ( ) and maximum ( ) values
high CR target image_ Lily, and its backlight image obtained
in each backlight zone. The zone value was, therefore, given by
by the IMF method.
(1). In this work, was the optimization value for the
With the exception of high CR images, Fig. 3(b)–(d) shows
IMF method
the CDF and IMF curves of low CR images, i.e., dark, bright,
and medium gray-level images. Most backlight signals were dis-
- (1) tributed to particular area with uniform values, thus, eliminating
the visible boundaries of each LED backlight block. For ex-
A very significant feature of the IMF method was to optimize ample, most backlight signal values of the bright image, Yushan
the backlight signal according to each input image, i.e., back- (see Fig. 5) distributed to the higher IMF area (with the gray
light signals with a dynamic gamma could be controlled frame level between 220 and 250). Likewise, dark and medium gray-
by frame to produce high quality images in high and low CR im- level images could also be modulated with a uniform brightness
ages. For example, in a high CR image [see Fig. 3(a)], the CDF distribution, thus the LC signals would be able to adjust to pro-
curve has steep slopes in the high and low gray level areas; in duce a high-quality image.
contrast, the IMF curve has gentle slopes in these two areas.
Therefore, backlight signals for dark regions would distribute B. LC Compensation
to the lower IMF area, and backlight signals for bright regions With determined backlight signals, the backlight image could
would distribute to the higher IMF area. Hence, the backlight be convolved with a light spread function (LSF) which repre-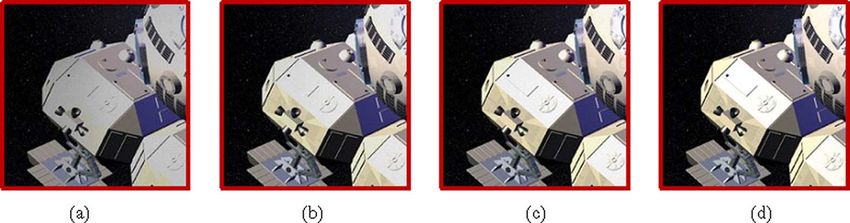
LIN et al.: DYNAMIC BACKLIGHT GAMMA ON HDR-LCD TVs                                                                                                141

Fig. 4. An example of using the IMF method. (a) High CR target image—Lily. (b) BL image of Lily. (c) Mapping curves of CDF and IMF.

Fig. 5. An example of using the IMF method. (a) Low CR target image (bright image)—Yushan. (b) BL image of Yushan. (c) Mapping curves of CDF and IMF.

Fig. 6. The processing of convolution. (a) BL signal. (b) Light spread function. (c) BL image.

sents the spatial intensity distribution of each LED zone (see                   compensation signals of liquid crystal               could be ob-
Fig. 6) [11]. The backlight images using the average, square                     tained through (2) [12]
root, and IMF methods are shown in Fig. 7(b)–(d). These convo-
lution results            were ideally simulated for distribution
of backlight illumination. Based on brightness preservation, the                                                                                 (2)
142                                                                                              JOURNAL OF DISPLAY TECHNOLOGY, VOL. 4, NO. 2, JUNE 2008

Fig. 7. (a) Target image. Convolution results of backlight signal determined by: (b) average, (c) square root, and (d) IMF methods.

Fig. 8. Target images with their CR measuring points; Lmax and Lmin are respectively marked with a solid-blue circle and a dotted-pink circle. Areas within
the red rectangles in Figs. (a) and (b) are magnified, shown in Figs. 9 and 10. (a) Lily (high CR image). (b) Robot (dark image). (c) Shore (medium GL image).
(d) Yushan (bright image).

Fig. 9. Results of the magnified section in the test image—Lily. (a), (b) and (c) are produced by using the average, square root, and IMF methods, respectively.
(d) Target image.

where         and           denote the intensity of conventional                 image), Shore (medium GL image), and Yushan (bright image)
(full-on) backlight and the intensity of HDR backlight, respec-                  shown in Fig. 8 were simulated and then implemented on a
tively;           denotes the original signals of a target image.                     1920 1080 resolution HDR-LCD TV with 8 8 backlight
Finally, an HDR image was created by combining the back-                         zones. The CR was measured by using a luminance analyzer,
light convolution result and LC compensation signals consid-                     CA-210 [14], with a measuring area of 27 mm in diameter
ering the gamma effect. However, if the gray level of LC com-                    (covering about 12 834 pixels); the positions of maximum lumi-
pensation,          , exceeded 255, the HDR system could not                     nance         and minimum luminance              are respectively
show the signal correctly, thus the “clipping effect” would be                   marked with a solid-blue circle and a dotted-pink circle in
observed [12].                                                                   Fig. 8. Areas within the red rectangle parts in Fig. 8(a) and (b)
                                                                                 are magnified for image detail comparison and shown in Figs. 9
                          III. MEASUREMENT                                       and 10.

A. Target Images and the Hardware                                                B. Target Parameters
  The main objective of the HDR system was to achieve a                            Based on the concept of a dual-panel display, the target
high contrast ratio (CR) image to match the human vision                         contrast ratio of high CR images should be enhanced more
range in the real world (high dynamic range) [13]. A high                        than 10 000:1 by controlling the backlight signal and with a
CR target image, Lily, and three low CR images, Robot (dark                      30% average power reduction. Additionally, with the LC panel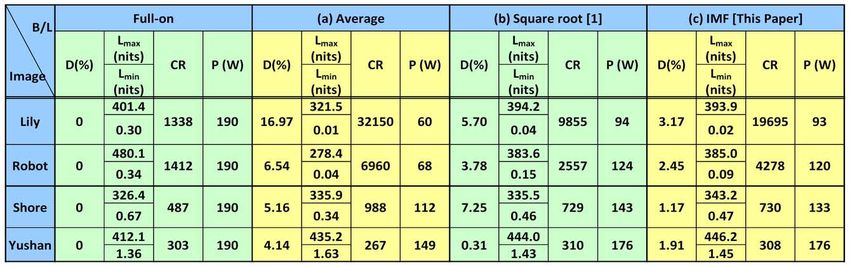
LIN et al.: DYNAMIC BACKLIGHT GAMMA ON HDR-LCD TVs                                                                                                             143

Fig. 10. Results of the magnified section in the test image—Robot. (a), (b), and (c) are produced by using the average, square root, and IMF methods, respectively.
(d) Target image.

Fig. 11. Lateral pictures of a 37-in HDR-LCD by using the: (a) the full-on backlight, (b) IMF, (c) square root, and (d) average methods.

Fig. 12. Image characteristics of different images using different methods. (a) Distortion ratio, (b) contrast ratio, (c) maximum luminance, and (d) power
consumption.
144 JOURNAL OF DISPLAY TECHNOLOGY, VOL. 4, NO. 2, JUNE 2008
TABLE I
DISTORTION RATIO (D), LUMINANCE (L AND L ), CR, AND POWER CONSUMPTION (P) OF LILY (HIGH CR IMAGE), ROBOT (DARK IMAGE), SHORE (MEDIUM
GL IMAGE), AND YUSHAN (BRIGHT IMAGE) BY USING THE CONVENTIONAL METHOD (FULL-ON) AND THREE DIFFERENT BACKLIGHT DETERMINATION METHODS
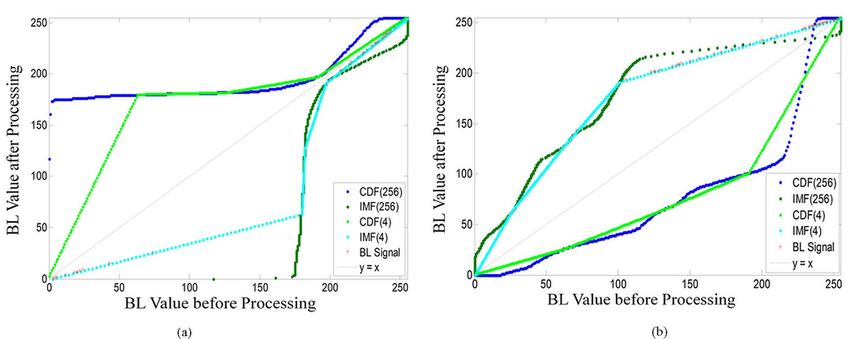
Fig. 13. Comparisons of mapping curves by using 256 and 4 registers in computing histogram. (a) Lily and (b) Yushan.
control, the maximum luminance should be maintained section in the images as shown in Fig. 9, the image details
to approach that of the target image with low distortion of less in the high brightness region were almost lost by using the
than 5%. average and square root methods. Conversely, the image details
The distortion ratio, , quantizing the distortion of the final could be preserved well in the IMF method with a distortion
HDR images is given in (3) of only 3.17% [see Fig. 9(c)]. Although the average method
had the highest CR of 32,150:1, the distortion of 16.97% was
the largest [see Fig. 9(a)] and the brightness (321.5 nits) was
(3)
much lower than that of the conventional method (401.4 nits).
Comparing and CR values of the IMF and square root
where is the total clipped sub-pixel number and is the methods, values were close to the conventional full-on
total sub-pixel number (1920 1080 3). The physical meaning backlight, and the CR of the IMF method (19 695:1) was much
of D is the distortion severity due to the limited maximum trans- higher than that of the square root method (9855:1) in this high
mittance (100%) of the LC. An HDR image with a smaller D CR image.
value implies the HDR system can produce a more detailed For the low CR image, Robot, the IMF method could also
image and get a higher quality image. Therefore, the four param- preserve most image details with 2.45% of D value (shown in
eters: contrast ratio (CR), power consumption (P), maximum Fig. 10 and Table I), and consumed less power than the square
luminance , and distortion value (D) were set for evalu- root method. The 4278:1 of CR value was also higher than that
ating and optimizing HDR-LCDs. of the square root method (2557:1). For the other two low CR
images, the IMF method also maintained good image details
with high maximum brightness.
IV. RESULTS AND DISCUSSIONS
Because the IMF method provided a suitable dynamic gamma
The experimental results of the four target images, Lily, for the backlight panel according to the display image, it not
Robot, Shore, and Yushan, are listed in Table I and Figs. 11 and only produced a high CR image, but also displayed clear de-
12. For the high CR image, Lily, the D values were 16.97%, tails and high brightness in each image frame. Therefore, the
5.70%, and 3.17% by using the average, square root, and IMF IMF method is a good option for backlight determination in op-
methods, respectively. From D values and the partly magnified timizing image quality for HDR-LCDs.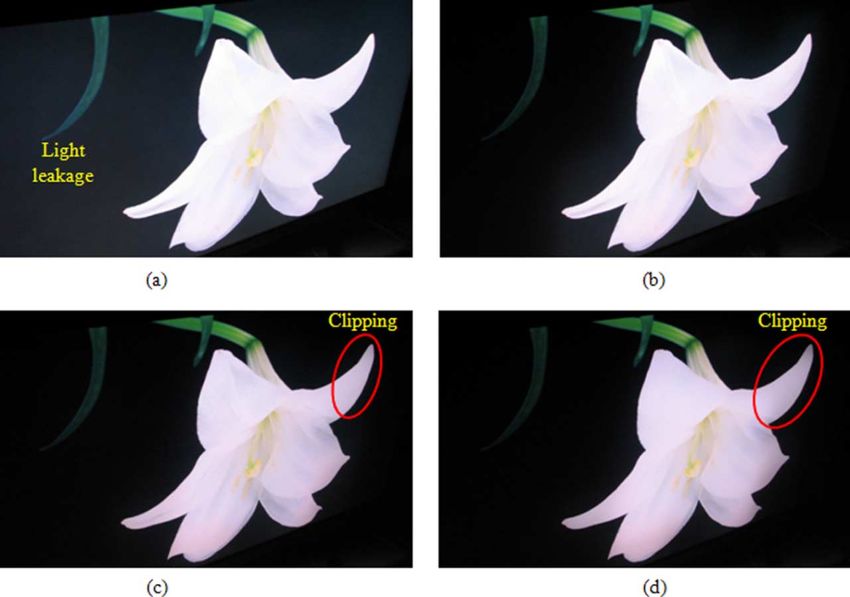
LIN et al.: DYNAMIC BACKLIGHT GAMMA ON HDR-LCD TVs                                                                                                             145

   Considering computational complexity of the IMF method,                         [6] R. C. Gonzalez and R. E. Woods, Digital Image Processing, 2nd ed.
usually, a mapping function for image enhancement in each LC                           Upper Saddle River, NJ: Prentice-Hall, 2002, pp. 75–214.
                                                                                   [7] T. C. Jen, H. Brian, and S. J. Wang, “Image contrast enhancement
panel would be provided in the conventional LCD. Therefore,                            based on intensity-pair distribution,” in Proc. IEEE’05 Int. Conf. Image
inversing this mapping function is the only step to get the IMF                        Process., Genova, Italy, 2005, vol. 1, pp. I–913.
curve. On the other hand, the histogram equalization method                        [8] I. Frosio, G. Ferrigno, and N. A. Borghese, “Enhancing digital cephalic
was chosen as our mapping function. For further reducing the                           radiography with mixture models and local gamma correction,” IEEE
                                                                                       Trans Med. Imag., vol. 25, no. 1, pp. 113–121, 2006.
computational complexity, the registers in computing histogram                     [9] T. C. Hsu, T. M. Lin, and Y. C. Chen, “Fuzzy contrast correction
were reduced from 256 to 4 units only. The simulation results                          (FCC) for image contrast enhancement,” in SID Symp. Dig. Tech. Pa-
presented that 4-register also could reach similar results as 256-                     pers, 2006, vol. 37, pp. 303–305.
                                                                                  [10] C. C. Sun, S. J. Ruan, M. C. Shie, and T. W. Pai, “Dynamic contrast
register (see Fig. 13). Therefore, the IMF method can be easily                        enhancement based on histogram specification,” IEEE Trans Consumer
implemented.                                                                           Electron., vol. 51, no. 4, pp. 1300–1305, Jul. 2005.
                                                                                  [11] L. Y. Liao, F. C. Lin, Y. P. Huang, H. P. D. Shieh, and S. C. Yeh, “A
                                                                                       real-time liquid crystal signal compensation method for high dynamic
                          V. CONCLUSION                                                range LCD,” IDW’07, vol. 14, pp. DES5–1L, 2007.
                                                                                  [12] L. Kerofsky et al., “Brightness preservation for LCD backlight dim-
   The HDR-LCD was studied as a dual-panel display: a back-                            ming,” J. Soc. Inf. Display, vol. 14, pp. 1111–1118, 2006.
light module and an LC cell. The backlight unit was a low                         [13] B. Hoefflinger, Ed., High-Dynamic-Range (HDR) Vision. New York:
                                                                                       Springer, 2007, pp. 1–4.
resolution panel to control the CR of the HDR image, and the LC                   [14] Konica Minolta Sensing, Inc., Measurement Instruments CA-210, Re-
cell was a high resolution panel to preserve the image details.                        trieved Dec. 27th, 2007 [Online]. Available: http://www.konicaminolta.
   We propose the IMF method to determine backlight signal                             com/instruments/products/display/color-analyzer/ca210/features.html
for high dynamic range (HDR) displays. IMF can provide an
optimized dynamic gamma for a backlight panel to produce
high quality images, including high/low contrast images. We
have demonstrated the IMF method on a commercial 37”                                                       Fang-Cheng Lin received the M.S. degree from
HDR-LCD TV to achieve a high contrast ratio            20 000:1                                            Department of Physics, National Cheng Kung
image, and to preserve clearer image details with low distortion                                           University, Tainan, Taiwan, R.O.C., in 2002, and is
                                                                                                           currently working toward the Ph.D. degree at the
               . Furthermore, the IMF method still maintained                                              Institute of Electro-Optical Engineering, National
high brightness to yield a more active image for human vision                                              Chiao Tung University, Hsinchu, Taiwan, R.O.C.
with an average power reduction of 30%. Therefore, the IMF                                                    His current research is to develop high image-
                                                                                                           quality with low power consumption LCDs, espe-
method can be applicable for HDR-LCD TVs for optimizing                                                    cially in high-dynamic-range and field-sequential-
image quality and lowering power consumption.                                                              color technologies.

                        ACKNOWLEDGMENT
                                                                                                           Yi-Pai Huang received the B.S. degree from Na-
   The authors would like to thank Y.-K. Cheng, C.-H. Chen,                                                tional Cheng-Kung University in 1999 and admitted
Z.-W. Chen, and S.Wallace of National Chiao Tung University,                                               to Institute of Opto-Electronic Engineering, National
                                                                                                           Chiao Tung University (NCTU) in Hsinchu, Taiwan,
Taiwan, R.O.C., for their valuable discussions. They also thank                                            R.O.C., with merit, so did in Ph. D. program.
P.-J. Tsai of AU Optronics Corporation for his hardware sup-                                                  He is currently an assistant professor in the depart-
port. Finally, they would like especially to express their appre-                                          ment of photonics & display institute, National Chiao
                                                                                                           Tung University in Hsinchu, Taiwan, R.O.C. He was
ciation to the reviewers for their suggestions resulting in this                                           a project leader in the technology center of AU Op-
complete paper.                                                                                            trinic(AUO) Corp.. He had joined the group of Pho-
                                                                                                           tonics and Communications Laboratory, the School
                                                                               of Optics/CREOL, University of Central Florida (UCF) as an internship student
                             REFERENCES                                        from 2001 to 2002. He was awarded the SID2001 Best Student Paper Award,
                                                                               SID2004 distinguished student paper award, 2005 Golden Thesis Award of Acer
   [1] H. Seetzen, W. Heidrich, W. Stuerzlinger, G. Ward, L. W. M. Trenta-     Foundation, and 2005 AUO Bravo Award. He had successfully developed “ad-
       coste, A. Ghosh, and A. Vorozcovs, “High dynamic range display sys-     vanced-MVA LCD” for the next generation products of AUO in 2005. His cur-
       tems,” SIGGRAPH 2004, ACM Trans. Graphics, vol. 23, no. 3, pp.          rent research interests are advanced display systems (High dynamic range LCD
       760–768, 2004.                                                          and Field sequential LCD), display human vision evaluation, 3-D displays, and
   [2] H. Seetzen, L. A. Whitehead, and G. Ward, “A high dynamic range         display optics. He has published 7 journal papers, 20 international conference
       display using low and high resolution modulators,” in SID Symp. Dig.    papers, and has 11 US patents (5 granted, 6 pending) to his credit.
       Tech Papers, 2003, vol. 34, pp. 1450–1453.
   [3] E. Y. Oh, S. H. Baik, M. H. Sohn, K. D. Kim, H. J. Hong, J. Y. Bang,
       K. J. Kwon, M. H. Kim, H. Jang, J. K. Yoon, and I. J. Chung, “IPS-
       mode dynamic LCD-TV realization with low black luminance and high                                   Lin-Yao Liao received the B.S. degree in electronics
       contrast by adaptive dynamic image control technology,” J. Soc. Inf.                                engineering from National Sun Yat-sen University,
       Display, vol. 13, pp. 215–219, 2005.                                                                Kaohsiung, Taiwan, R.O.C., in 2006, where his cur-
   [4] Y. W. Wang, Y. K. Cheng, H. P. D. Shieh, T. M. Wang, and H. W. R.                                   rently working toward the Ph.D. degree in photonics
       Lin, “Analyses of point spread function in high dynamic range display                               engineering.
       system,” Opt. Photon. Taiwan 2005, no. G-SA-X 4-3, 2005.                                              His research interests include high efficiency dis-
   [5] F. C. Lin, C. Y. Liao, L. Y. Liao, Y. P. Huang, and H. P. D. Shieh,                                 play system, and liquid crystal lenses design.
       “Inverse of mapping function method for image quality enhancement
       of high dynamic range LCD TVs,” in SID Symp. Dig. Tech Papers,
       2007, vol. 38, pp. 1343–1346.
146                                                                               JOURNAL OF DISPLAY TECHNOLOGY, VOL. 4, NO. 2, JUNE 2008

                          Cheng-Yu Liao received the M.S. degree from                      Te-Mei Wang is the project leader of AUO Tech-
                          National Chiao Tung University, Hsinchu, Taiwan,                 nology Center. She initiated the high dynamic
                          R.O.C., in 2007.                                                 contrast display project in AUO and worked with
                            His current interests include digital image pro-               Prof. Han-Ping Shieh and his students of NCTU
                          cessing and backlight dimming of LCD-TV.                         Display Institute to successfully demonstrate this
                                                                                           new technology in FPD International 2005 and 2006
                                                                                           in Yokohama.

                            Han-Ping D. Shieh (F’07) received the B.S. degree              Szu-Che Yeh received the M.S. degree in electronics
                            from the National Taiwan University in 1975 and the            engineering from National Chiao-Tung University,
                            Ph.D. degree in electrical and computer engineering            Hsinchu, Taiwan, R.O.C., in 1999. Since 2003, he
                            from Carnegie Mellon University, Pittsburgh, PA, in            has worked at AU Optronics Corporation, where his
                            1987.                                                          work focused on color image processing for display.
                               He joined National Chiao Tung University
                            (NCTU) in Hsinchu, Taiwan, R.O.C., as a professor
                            at the Institute of Opto-Electronic Engineering
                            and Microelectronics and Information Research
                            Center (MIRC) in 1992 after being a Research Staff
                            Member at the IBM T.J. Watson Research Center,
Yorktown Heights, NY, since 1988. He currently is an AU Optronics chair
professor and Associate Director, MIRC, NCTU. He founded and served as
the director of Display Institute at NCTU in 2003, the first graduate academic
institute in the world dedicated to display education and research. He also
holds a joint-appointment as a Research Fellow at the Center for Applied
Sciences and Engineering, Academia Sinica since 1999. His current research
interests are in display, optical MEMS, nano-optical components, and optical
data storage technologies.
   Dr. Shieh currently serves as a Director, SID (Society for Information Dis-
play) and has served as program chair and committee member and has organized
conferences on major data storage (ISOM, MORIS, Intermag, ODS, APDSC)
and displays (SID, IDRC, ASID, FPD Expo, etc.). He has published more than
100 journal papers and has more than 30 patents to his credit. He was awarded
as a Society for Information Display (SID) Fellow in 2005.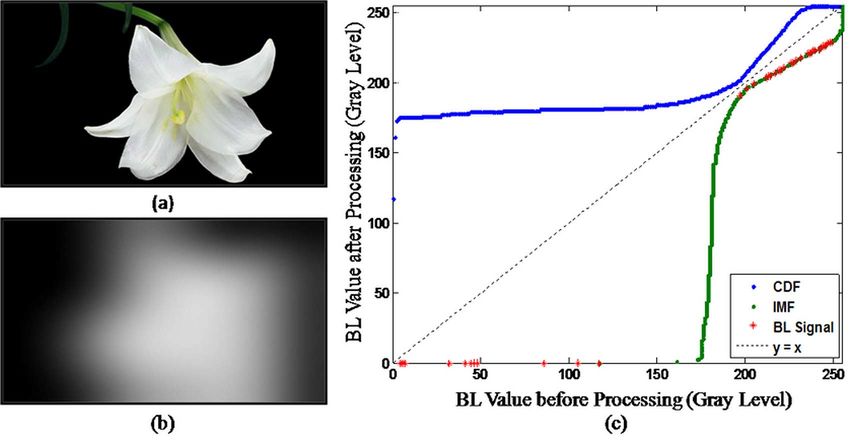
You can also read