P3.1 Extending the capabilities of the polarimetric WSR-88D: AMS ...
←
→
Page content transcription
If your browser does not render page correctly, please read the page content below
P3.1      Extending the capabilities of the polarimetric WSR-88D:
               Observations of cirrus clouds and moist layers
                  Valery Melnikov+, Phillip Chilson~, and David Mechem*
+
  Cooperative Institute for Mesoscale Meteorological Studies, University of Oklahoma,
  Norman, OK.
~
  School of Meteorology, University of Oklahoma, Norman, OK.
*
  Department of Geography, University of Kansas.

1. Introduction
          Clouds are one of the main components of          monitor possible development of precipitation. In
the water cycle and radiation balance in the               this mode, a microwave 4.5 µs pulse is transmitted
atmosphere. Large amounts of cloud data have               (750 m range resolution) to improve the detection
been obtained with mm-wavelength cloud radars.             of weak echoes. Radar measurements are
X-band weather radars (3-cm wavelength) have               performed in “precipitation” mode with 1.54 µs
been used for cloud studies and precipitation              radar pulse (250 m range resolution). To enhance
measurements in light and moderate rain. Weather           quantitative measurements of clouds, the following
radars with wavelengths longer than 5 cm are               data collection and signal processing procedures
successfully used to measure precipitation and             were used:
monitor severe weather; no such radars are used for             1) Dwell time of about 120 ms (i.e., 128
cloud sounding.                                                      samples spaced a bit less than 1 ms apart
          MM-wavelength cloud radars have                            at the pulse repetition frequency of 1013
detectability of -25-35 dBZ at 10 km to get                          Hz) to improve accuracy of measurements
information on various types of non precipitating                    and suppress noise,
clouds (Clothiaux et al. 1995, Stephens et al.                  2) Small elevation increments of 0.25o to
2002). To use weather radar for cloud sounding,                      improve accuracy and number of
such detectability should be achieved for weather                    measurements,
radars. In the next section, we describe a technique            3) Twice the range sampling rate, also to
that brings sensitivity of the networking WSR-88D                    suppress noise,
weather radar to a level of cloud radars. Enhanced              4) A noise speckle remover to reduce the
sensitivity of the WSR-88D permits detection of                      occurrence of false echoes,
many types of non-precipitating clouds (Melnikov                5) Correlation estimators for polarimetric
et al. 2007) including cirrus clouds (next section                   variables to mitigate noise effects,
herein). This information could be used in                      6) Data collection at elevations higher than
parameterization of cloud models and radiation                       20o to observe clouds at close range, and
transfer problems in the atmosphere.                            7) Ground clutter filters at all elevations to
          Enhanced radar detectability allows also                   lessen clutter influence.
observations of atmospheric layers of increased             These procedures allow clear data presentations at
humidity under “clear are” conditions (section 4),         SNR as low as -7 dB. For the KOUN, Z10,
i.e., wherein the layers are not masked by clouds          presented in the non-polarimetric mode and short
located at same height. We have conducted our              radar pulse, is -21.5 dBZ (Table 1). The enhanced
experiments on the polarimetric WSR-88D KOUN               signal processing permits measurements of -28.5
situated in central Oklahoma (Norman, OK). The             dBZ. The long radar pulse adds more 4.8 dB to
main goal of the experiments was to detect moist           sensitivity bringing it to level of -33 dBZ@10 km.
layers in the atmosphere for its possible use in           This sensitivity is on par with one of the cloud
forecasting of convection.                                 radars. Radar parameters of the operational MMCR
                                                           cloud radar operated by the Atmospheric Radiation
2. Radar observations of weakly reflecting                 Measurements program and WSR-88D are
clouds                                                     compared in Table 1. It is seen from the table that
         WSR-88Ds are operated in two                      Z10 of KOUN is close to the one of MMCR, but
surveillance modes: “clear air” and “precipitation”.       KOUN has a larger radar volume. So KOUN with
The “clear air” mode is used in fair weather to            enhanced signal processing is capable of observing
Valery.Melnikov@noaa.gov                                   light non precipitating clouds.

                                                       1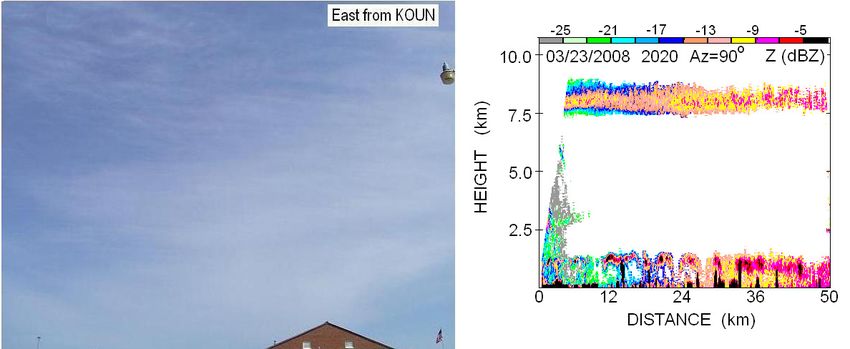
Table 1. Radar parameters                                   example of cirrus clouds above precipitation is
                                                            shown in Fig. 4.
                   MMCR            WSR-88D                             It should be noted that the short radar
Wavelength         8.7             109                      pulse is used to produce radar images in Figs. 1-3.
(mm)                                                        To detect low altitude and weakly reflecting
Antenna            0.2             0.96                     clouds, the long-pulse mode can be utilized; this
beamwidth,                                                  adds about 4.5 dB to sensitivity. Then Z10 reaches -
(deg.)                                                      30 dBZ in the dual-polarization mode. The
Radial             45 / 90         250    (short            polarimetric WSR-88D will be capable of injecting
resolution (m)                     pulse)                   its total transmitted power into a single
Two-way            17@10 km        82@10 km;                polarization; this will decrease Z10 to a level of -33
transversal                                                 dBZ. Thus the WSR-88D has a detection capability
resolution (m)                                              that exceeds some mm-wavelength cloud radars.
Z10 (dBZ)           -30 (general   -25.5                    Radar observations of clouds can significantly
                   and stratus     (enhanced                compliment satellite data by supplying a more
                   modes)          processing in            complete description of cloud structures, altitudes
                                   dual-pol, short          of the tops and bottoms, and wind velocities in
                                   pulse),                  clouds.
                                   -28.5                               To obtain the optical thickness of clouds
                                   (enhanced                in Figs. 2 and 3, we have compared measured solar
                                   processing,              radiation on the ground with model results. To
                                   single      pol.,        estimate solar flux on the ground, we have used the
                                   short pulse),            Bird model (Bird and Hustorm, 1981). The
                                   -33.3                    Oklahoma mesonet measures solar radiation every
                                   (enhanced                5 minutes. We obtained data from a mesonet site
                                   processing in            located in Norman, OK. For the time represented in
                                   single-pol,              Fig.2, the measured and modeled solar radiation
                                   long pulse)              were 751 and 797 W/m2. That is, the clouds
Scanning           No              Yes                      absorbed less than 6% of the solar radiation and
capability                                                  thus they were optically thin. For the time
Dual               Yes for the     Yes       for            represented in Fig. 3, the measured solar radiation
Polarization       SGP site        KOUN. Yes                was 427 W/m2 and the model value is 395 W/m2,
                                   for upgraded             i.e., less that measured. Such an excess is observed
                                   WSR-88Ds.                on partially cloudy days. We conclude that the
                                                            WSR-88Ds can observe radiative significant
                                                            clouds.
          Fig.1 demonstrates the capability of the
KOUN to detect optically thin clouds.
A sky picture towards the East-North-East from
KOUN is presented in Fig. 1(a). At the same time,
KOUN reflectivity from vertical cross-sections at
azimuth 180o is shown in the right panel. Cloud
radar echo is circled with red in Fig. 1(b).
Examples of observations of cirrus clouds are
presented in Figs. 2 and 3. WSR-88D KTLX
located 11 km North-East of KOUN was not
capable to detect the clouds. In visible satellite
images (not shown), the clouds are barely seen in
central Oklahoma. KOUN detects the clouds to 50
km; the heights and thickness of the clouds can be
measured. Ground clutter filter residuals
contaminate the data to 5-7 km, beyond that they
are sporadic and do not impose significant
problems to cloud mapping. Boundary layer
reflectivity is clearly observed at all distances. An

                                                        2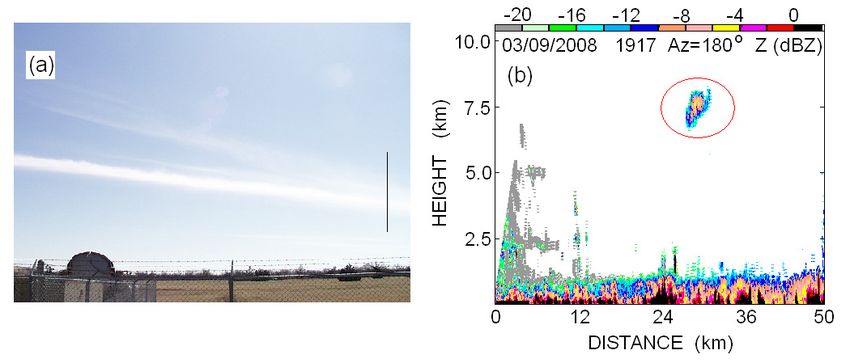
Fig. 1. 9 March 2008. (a): Sky picture from KOUN at 1918 UT. The vertical black line is the
direction of the radar reflectivity cross section shown in panel (b). Radar echo from the cloud is circled.

    Fig. 2. 23 March 2008. (Left): Sky picture from KOUN at 2021 UT looking toward the East. (Right):
    Vertical cross section of reflectivity factors observed with KOUN.

    Fig. 3. 13 November 2008. (Left): Sky picture from KOUN at 2100 UT looking toward the North and
    (right) the vertical cross section of reflectivity factors observed with KOUN at azimuth 0o.

                                                      3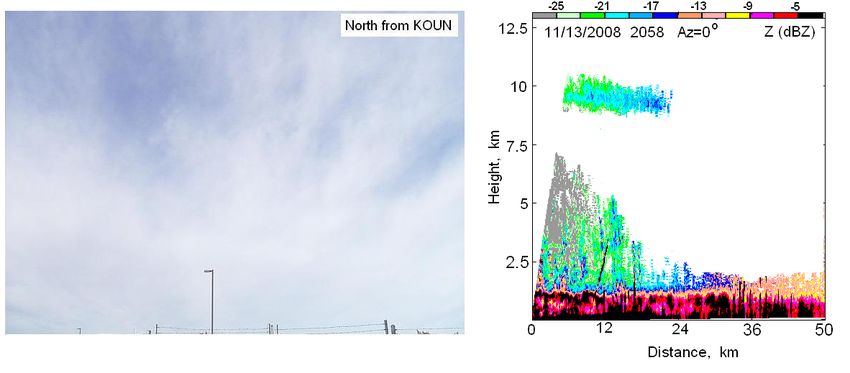
Fig. 4. Cirrus clouds above precipitation: (left) reflectivity and (right) the Doppler velocity fields.
Fig. 5. Oblate (a) and prolate (b) spheroidal scatterers and the incident waves.
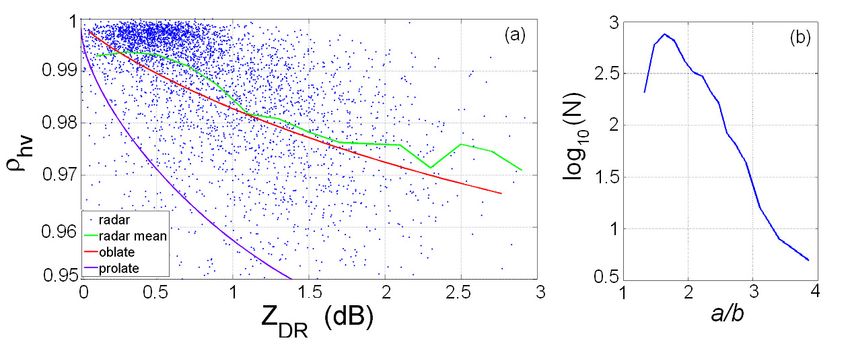
Fig.6. (a): Relations between ZDR and ρhv in clouds at height of 5 km. The dots are radar data, the
green line is the mean of the radar data, the red and blue lines are the mean dependencies for
oblate and prolate particles correspondingly obtained via (6). (b): The relative number
concentration of particles as a function of the aspect ratio a/b.
43. ZDR – ρhv relation and particles’ shapes in uniform distribution in θ from 0 to some θo, which
clouds is a model parameter. We will refer θo to as the
Radar polarimetric observations can be maximal “flutter” angle. The completely random
used to estimate the shape of cloud particles. Fields distribution in θ corresponds to θo = 90o.
of polarimetric variables in nonprecipitating clouds Formulation of the model. Geometry of
are complicated due to variety of ice crystal habits. the particles and incident waves are sketched in
Matrosov et al. 1996, 2001 and Reinking et al. Fig. 5. The propagation direction of the radio
2002 utilized depolarization measurements at X
r
k
waves is determined by vector that lies along the
band (radar wavelength is 3.2 cm) to obtain types
and shapes of ice hydrometeors. Signal in the x-axis. OO’ is the axis of rotation of the spheroids.
orthogonal radar channel is 10-20 dB weaker than For oblate plate-like scatterers, b< a and for prolate
the signal in the copolar channel. Thus such needle-like particles, b> a. We consider horizontal
measurements can be carried out in thick clouds sounding which is a good approximation for
wherein depolarized signal is strong. In this paper, elevation angles lower than 20o. Transmittion of
we consider weakly reflecting clouds in which polarized radio-waves, their scattering by particles,
depolarization cannot be measured with KOUN (S and reception of the scattered waves can be
frequency band, wavelength is 11 cm). Consider described by the following matrix equation (e.g.,
utilization of differential reflectivity, ZDR, and the Doviak and Zrnic, 2006, 8.5.2.1):
copolar correlation coefficient, ρhv, that are
measured with KOUN, to estimate shapes of ice E hr S hh S hv E h
=
S vv Ev
crystals. Parameters of backscattered radar
radiation depend on the sizes and shapes of cloud vr S hv
E
, (1)
particles, their orientation relative to incident
waves, and the particles’ dielectric permittivity. where Sij are the scattering coefficients of the
Sizes and shapes. Cloud particles are medium. In (1) range dependence and radar
much smaller than the radar wavelength, i.e., 11 constants are omitted without loss of generality
cm, so that the Raleigh approximation for because we are interested in polarimetric
backscattering cross-sections is applicable. Cloud parameters that do not depend on those. Powers Ph
particles can be of different shapes which are close and Pv in the receive channels and the correlation
to columns, plates, rosettes, dendrites, or function Rhv between received waves are:
aggregates. In high altitude clouds such as cirrus,
the main process of particles growth is vapor
deposition (Pruppacher and Klett, 1978) thus
Ph =, Pv =
,
aggregates can be excluded. The rest shapes can be Rhv =< E E vr >, *
hr (2)
approximated by two major shape types: oblate and
prolate spheroids. Columnar crystals are close to
prolate spheroids. Plates and dendrites can be where the brackets stand for ensemble averaging
considered as oblate spheroids. We consider herein and the asterisk denotes the complex conjugate.
spheroids, i.e., scatterers with rotational symmetry. From (2), the differential reflectivity ZDR, the
Such particles are characterized with two semi- differential phase shift φdp and the copolar
axes a and b as it is shown in Fig. 5. correlation coefficient ρhv are obtained
Dielectric properties of cloud particles at
centimeter wavelengths is taken as for solid ice, Ph
i.e., ε = 3.15, because the main growth process of Z DR = 10log Z dr , Z dr =
particles is deposition of water vapor. Pv , (3a)
Orientation of cloud particles is preferably | Rhv |
horizontal as it is concluded from positive ρhv = , ϕdp = arg(Rhv )
differential reflectivities. Nonuniformities of the (Ph Pv )1/ 2 (3b)
wind destroy horizontal orientation of the particles
so that they can be characterized by an angle The matrix coefficients for n-th scatterer in (1) are
distribution relative to the horizontal plane.
Orientation of a particle can be characterized with (n)
two Euler angles θ and φ which are shown in Fig. S hh = α a + ∆α sin 2 θ sin 2 ϕ
, (4a)
5. We use herein a completely random distribution (n)
in φ, i.e., the uniform distribution. To perform
S hv = ∆α sin θ cos θ sin ϕ
,
averaging in θ for oblate particles, we consider the
5S vv( n ) = α a + ∆α cos 2 θ polarizabilities for oblate scatterers (a ≥ b) are
, (e.g., Bohren and Huffman 1983, section 5.3):
∆α = α b − α a
, (4b)
4 ε −1
α a = π a 2b
where αa and αb are the polarizabilities along a and 3 1 + La (ε − 1) ,
b (e.g., Bringi and Chandrasekar, 2001, Eq. (2.53)).
To get Sij in (1), we have to sum up (4) for all 4 ε −1
α b = π a 2b
scatterers in the radar volume 3 1 + Lb (ε − 1) , (7)
The calibration procedure takes care of
difference in transmitted amplitudes Eh and Ev in g π
(1) so we can assume that they are equal and omit
La = 2 − tan −1 g ,
2e 2
them. Using (1), the received voltage from n-th
1/ 2
scatterer in the radar volume can be represented as 1 − e2
Lb = 1 − 2 La , g = 2 , .
Ehr( n ) = α a + ∆α sin 2 θ sin 2 ϕ e
, (5a) e 2 = 1 − (b / a ) 2
+ ∆α sinθ cosθ sinϕ
For prolate scatterers, (7) holds as well with b ≥ a
Evr( n ) = ∆α sin θ cos θ sinϕ and
. (5b) 1 − e2 1 1 + e
+ (α a + ∆α cos 2 θ ) Lb = ( ln − 1),
e 2 2e 1 − e .
The distribution in φ can be considered uniform La = 0.5(1 − Lb ), 2
e = 1 − ( a / b) 2
with high confidence. Assuming independence of
the φ- and θ-distributions, we obtain =1/2;
Radar quantities in (6) are the means so we use (7)
then substitution of (5) into (1) yields
for the “mean” particle.
To perform averaging in θ for oblate
Ph = + Re( < α a ∆α * >) J 1 + particles, we consider the uniform distribution in θ
, (6a) from 0 to some θo, which is a model parameter. To
1
( 4 J 1 − J 2 ) get a relation between ZDR and ρhv for oblate
8 particles, we assume that the flatter angle increases
with decreasing oblateness, so that spherical
Pv = + Re(< α a ∆α * >)(1 − J1 ) + particles rotate arbitrary in φ and θ but oblate
particles are more stable at wobbling and have their
1 (6b) own flatter angle θo that linearly depends on
(2 − 3J1 + J 2 ) oblateness parameter b/a, i.e.,
2
θo, = 70 b/a + 20 (deg). (8)
Rhv = eiψ r {[ + < αa*∆α >)(1 − J1 ) For very oblate particles, i.e., b/a J1 ]eiψ t (6c) the mean angle is 10o which is close to the flatter
2 angle for raindrops.
+ | ∆α|2 ( J1 − J 2 ) cosψ t }, Radar data. In Fig. 6(a), a ZDR - ρhv
scattergram of radar data are presented for heights
5 km (the dots) with temperatures about -17oC. The
J1 =< sin2 θ >, J 2 =< sin4 θ > , (6d) data have been collected from nonprecipitating
clouds from radar volumes with SNR >= 10dB.
The mean dependency for data is shown with the
where Re(x) stands for the real part of x, ψt is the green line. The mean ZDR - ρhv relations calculated
system differential phase on transmit, and the via (6) are shown with the red (oblate particles) and
brackets around the polarizabilities denote size blue (prolate particles) lines. It is seen that the
averaging. At S-band, cloud particles can be calculated curve for oblate particles is close to the
considered as Rayleigh scatterers and the mean radar data so we can conclude that the cloud
particles at this height have oblate shapes. The
6latter is in accord with cloud data for temperature Radar returns from moist layers are weak so
interval -15..-20 oC (Pruppacher and Klett, 1978, significant fluctuations of measured parameters
2.2). should be expected. This is seen from Fig. 9:
Radar data in Fig. 6(a) can be used also to instantaneous values of ZDR lays in interval – 1 to
estimate relative number concentration for particles 1 dB and values of ρhv are in interval 0.95 to 1.05.
having a given aspect ratio, i.e., a/b. Neither ZDR Estimates of ρhv exceeding unity are possible for
nor ρhv depend on the absolute number weak signals. Symmetry of the distributions signify
concentration but Fig. 6(a) demonstrates a their statistical nature thus their mean values can be
dependency of the number of particles having attributed to polarimetric properties of scattering
given differential reflectivity. It is seen that vast media. So we conclude from Fig. 9 that differential
majority of the measurements has ZDR near 0.5 dB. reflectivity from moist layer is close to 0 dB and
According to (6a,b), each point on the red line in the copolar correlation coefficient is unity. This
Fig. 6 corresponds to a certain aspect ratio. Using conclusion is in accord with intuitive expectations
this correspondence, the relative number on reflection of radio waves from turbulent moist
concentration can be obtained. The result is shown air.
in Fig. 6(b). One can see that vast majority of Zero ZDR in moist layers can be used to
particles has the aspect ratio near 1.6. It seen also check calibration of a polarimetric radar.
that particles with a/b > 3.5 are present in the Polarimetric schemes with simultaneous
radar volume with the relative number transmission and reception of electromagnetic
concentration 3 order of magnitude less than those waves at orthogonal polarization planes require
with a/b ≈1.6. measurements of the system differential
reflectivity. The latter is a result that a dual-
polarization radar has two physically different
4. Polarimetric radar observations of moist channels with different gains (Zrnic et al. 2006). So
layers this difference must be accounted for with the
Enhanced sensitivity of KOUN radar system differential reflectivity. Measurements of
allows detecting echoes from “clear” air, i.e., in the differential reflectivities from boundary layer, i.e.,
absence of precipitation and clouds. Observations ZDR = 0 dB, can be utilized to check the system
show that such echoes are located in the boundary differential reflectivity. This can be done in cold
layer and have shapes of layers. Radar panels in season wherein no insects are present in the
Figs. 1-3 clearly demonstrate that KOUN detects atmosphere.
reflections from the boundary layer. Such echoes In the presence of insects, moist layers are
are areas of enhanced refractivity related to observed as areas of decreased ZDR and increased
increased humidity and they are usually detected ρhv as in Fig.10. It is seen that in the reflectivity
with vertically pointed wind profilers (e.g., Doviak field, it’s hard to recognize a moist layer. Insects
and Zrnic 2006). On scanning WSR-88Ds with exhibit strong positive ZDR. A layer of decreased
enhanced signal processing, temporal-spatial ZDR in Fig. 10 manifests the presence of a moist
observations of moist layers are possible. Often, layer which shifts ZDR values from high “insect”
clear air echoes exhibit bubble structures as in Figs. ZDR down to zero ZDR pertinent to clear air. This is
2 (right) and 7 (right). Examples of elevated layers supported by shifting of ρhv up in the layer of
are shown in Figs.7, 8, and 10. decreased ZDR. Shifting of ρhv up is caused by
Rawindsonde profiles taken from KOUN reflection from moist air that has correlation
corresponding to the nearest sounding time (or coefficients close to unity. Rawindsonde profiles
times) show that cloud and moist layers detected taken from KOUN corresponding to the nearest
by radar are accompanied by increased humidity, sounding time (or times) show that cloud and moist
relative to layers above and below (Figs. 7, 8, and layers detected by radar are accompanied by
10). We note that Figs. 8 and 10 particularly increased humidity, relative to layers above and
illustrate the drawbacks of launching only two below (Figs. 7, 8, and 10). Although we have not
soundings per day in meteorological situations that formally calculated refractivity, we suspect that
are rapidly evolving. some of these "moist" radar echoes are associated
In the cold season in Oklahoma, insects with refractivity gradients captured in the
do not contaminate clear air radar returns so soundings, in addition simply to layers of
polarimetric measurements of moist layers are anomalously high humidity. We note that Figs. 8
possible. An Example of observations with KOUN and 10 particularly illustrate the drawbacks of
is shown in Fig. 8. Distributions of measured launching only two soundings per day in
polarimetric variables are presented in Fig. 9. meteorological situations that are rapidly evolving.
7Fig. 7. (a,c): Reflectivities of clouds and moist layers observed with KOUN.
(b,d): Profiles of relative humidity, RH, obtained from nearest soundings in time.
8Fig. 8. Wave-like elevated moist layer with maximal reflectivities about -3 dBZ.
Profiles of relative humidity are depicted in the right panels.
Fig. 9. Distributions of ZDR and ρhv in the moist layer shown in Fig. 8.
Fig. 10. Moist layer at the height of 1.8 km imbedded into echo from insects. The Vh - Vv panel is the
difference of radar Doppler velocities measured at horizontal and vertical polarizations. Profiles of relative
humidity are depicted in the right panels.
9horizontal surfaces. SERI reports, SERI/TR-642-
Conclusions 761, 39 pp.
- The enhancements to signal processing
allows observing of nonprecipitating Bohren, C.F., and D.R. Huffman, 1983: Absorption
clouds with reflectivities of -25.5 dB that and Scattering of Light by Small Particles , John
permits radar observations of some types Whilley and Son, San Diago, CA, 457 pp.
of cirrus. This sensitivity is for dual
polarization measurements with the short Clothiaux, E.E., M.A. Miller, B.A. Albrecht, T.P.
radar pulse. Radar observations of weakly Ackerman, J. Verlinde, D.M. Babb, R.M. Peters,
reflecting clouds can be used for and W.J. Syrett, 1995: An evaluation of a 94-GHz
climatological studies, cloud models, and radar for remote sensing of cloud properties. J.
problems of radiation in the cloudy Atmos. Oceanic Technol., 12, 201-229.
atmosphere. We demonstrated the
optically significant clouds can be Doviak, R. J. and D. S. Zrnic, 2006: Doppler radar
observed with the WSR-88D (Figs. 2,3). and weather observations, 2nd ed., Academic
Press, 562 pp.
- ZDR – ρhv relations in clouds can be used
for estimation of the mean shape of cloud Matrosov, S. Y., R.F. Reinking, R.A. Kropfli, and
scatterers. This shape is for largest B. W. Bartram, 1996: Estimation of ice
particles that make strongest contribution hydrometeor types and shapes from radar
to the backscattered radar signal. polarization measurements. J. Atmos. Oceanic
Presented radar data is in an agreement Technol., 13, 85-96.
with plate-like shapes of cloud particles at
heights of 5 km. ZDR – ρhv relation in Matrosov, S. Y., R.F. Reinking, R.A. Kropfli, B. E.
clouds allow obtaining a distribution of Martner, and B.W. Bartram, 2001: On the use of
particles in the aspect ratio, i.e., the ratio radar depolarization ratios for estimating shapes of
of major and minor axis. ice hydrometeors in winter clouds. J. Applied
Meteorol., 40, 479-490.
- Increased radar detectability allows
observations of moist layers in the Melnikov, V.M., D.S. Zrnic, R.J. Doviak, Y.L.
atmosphere. With KOUN, moist layers Kogan, P. B. Chilson, and D.B. Mechem, 2007:
with maximum equivalent reflectivities The WSR-88D observes nonprecipitating clouds.
about – 3 dBZ have been observed. 33rd Weather Radar Conf., Cairns, Australia,
Observations of moist layers with P6A.3.
scanning radars permit spatial-temporal
monitoring of the layers. Waviness and Pruppacher, H.R., and J.D. Klett, 1978:
“bubbleness” of the layer indicate that Microphysics of clouds and precipitation.
convection has a strong impact on the D.Reidel Publ. Co., Boston, 714 pp.
layers.
Reinking, R.F., S.Y. Matrosov, R.A. Kropfli, and
- Differential reflectivity and the copolar B. W. Bartram, 2002: Evaluation of a 45o slant
correlation coefficients in moist layers in quasi-Linear radar polarization state for
cold seasons (free from insects) are close distinguishing drizzle droplets, pristine ice crystals,
to zero and one correspondingly. and less regular ice particles. J. Atmos. Oceanic
Closeness of ZDR to zero in moist layers Technol., 19, 296-321.
can be used to check radar calibration of
differential reflectivity. In moist layers Stephens G. L, D.G. Vane, R.J. Boain, G.G. Mace,
imbedded in insect echoes, we observe K. Sassen, Z. Wang, A. J. Illingworth,
slightly positive differential reflectivities J. O’Connor, W. B. Rossow, S.L. Durden, S.D.
which could be due to contamination of Miller, R.T. Austin, A. Benedetti, C. Mitrescu,
clear air signal with echoes from insects. 2002: The CLOUDSAT mission and the A-train.
Bull. Amer.Meteor. Soc., Dec, 1771-1790.
References
Bird, R. E., and R.L. Hulstrom, 1981: A simplified Zrnic, D.S., V.M. Melnikov, and J.K.Carter, 2006:
clear sky model for direct and diffuse insolation on Calibrating differential reflectivity on the WSR
88D. J. Atmos. Oceanic Technol., 23, 944-951
10You can also read


