WEATHER CALIBRATION EFFORTS ON THE ADVANCED TECHNOLOGY DEMONSTRATOR
←
→
Page content transcription
If your browser does not render page correctly, please read the page content below
American Meteorological Society 100th Annual Meeting, Boston, 2020

8B.4
                               WEATHER CALIBRATION EFFORTS ON THE
                               ADVANCED TECHNOLOGY DEMONSTRATOR

                                        Igor R. Ivić* and David Schvartzman

          Cooperative Institute for Mesoscale Meteorological Studies, University of Oklahoma, and
                   NOAA/OAR/National Severe Storms Laboratory, Norman, Oklahoma

1. INTRODUCTION
     Polarimetric phased array radar (PPAR)
technology is being considered as one of the
candidate platforms for the next generation of
weather radars (Zrnić et al., 2007, Weber 2019).
The unique electronic beam steering capability,
inherent in PPAR, provides for the enhanced
weather surveillance strategies that are envisioned
to improve the weather radar products. However,                Fig. 1. ATD site and the antenna under the radome.
one of the major technical issues related to the use
                                                               sufficiently narrow antenna main beam, the
of PPAR technology for weather surveillance is the
                                                               corrections can be conducted using only the
calibration needed to produce the quality of
                                                               measurements of the copolar patterns (Ivić 2018b).
measurements comparable to the parabolic-
                                                               Furthermore, the effects of active electronic
reflector antenna systems (Zrnić et al., 2012).
                                                               components in transmit and receive paths in PAR
Unlike the latter systems, PPARs are plagued with
                                                               systems can result in significant differences
the existence of significant cross-polar antenna
                                                               between transmit and receive patterns. For these
patterns which induce cross coupling between
                                                               reasons it is important to characterize both transmit
returns from the horizontally and vertically oriented
                                                               as well as receive copolar and cross-polar antenna
fields resulting in the biases of polarimetric variable
                                                               patterns (Ivić 2019).
estimates. Furthermore, the antenna patterns
which vary as horizontal and vertical beams are                     Through a joint collaboration of the National
electronically steered in various directions, as               Oceanic and Atmospheric Administration and the
consequence produce the scan-dependent                         Federal Aviation Administration, the Advanced
measurement biases (Ivić 2018).                                Technology Demonstrator (ATD) was installed in
                                                               Norman, OK in 2018. This state-of-the-art radar
    Pulse-to-pulse phase coding in either the
                                                               system will be used to evaluate the performance of
horizontal or vertical ports of the transmission
                                                               PPAR for weather observations. It consists of an S-
elements has been proposed to mitigate the cross-
coupling effects (Zrnić et al., 2014, Ivić 2017a, Ivić         band planar PPAR that is being developed by the
2017b, Ivić 2018a). This approach, however, does               National Severe Storms Laboratory (NSSL), MIT
not address the scan-dependent system biases in                Lincoln Laboratory, and General Dynamics Mission
PPAR estimates. These are caused by the                        Systems (Stailey and Hondl 2016). The main
horizontal (H) and vertical (V) copolar antenna                purpose of this system is to serve as testbed for
patterns which vary with beamsteering direction.               evaluating the suitability of phased array radar
The effects of these variations must be addressed              (PAR) technology for weather observations (Zrnić
via corrections using appropriate values at each               et al., 2007).
boresight location (Ivić and Schvartzman 2019). If
the cross-coupling effects are sufficiently                         The ATD antenna was designed by MIT
suppressed with phase coding and given                         Lincoln Laboratory (Conway et al., 2013) and uses
                                                               differential-fed single radiating elements (Bhardwaj
  * Corresponding author address: Igor R. Ivić, 120 David L.
                                                               and Rahmat-Samii, 2014). It is composed of 76
  Boren Blvd, Room 4415, Norman, OK, 73072; e-mail:            panels arranged as shown in Fig. 1. Each panel
  igor.ivic@noaa.gov.                                          consists of an 8×8 set of radiating patch-antenna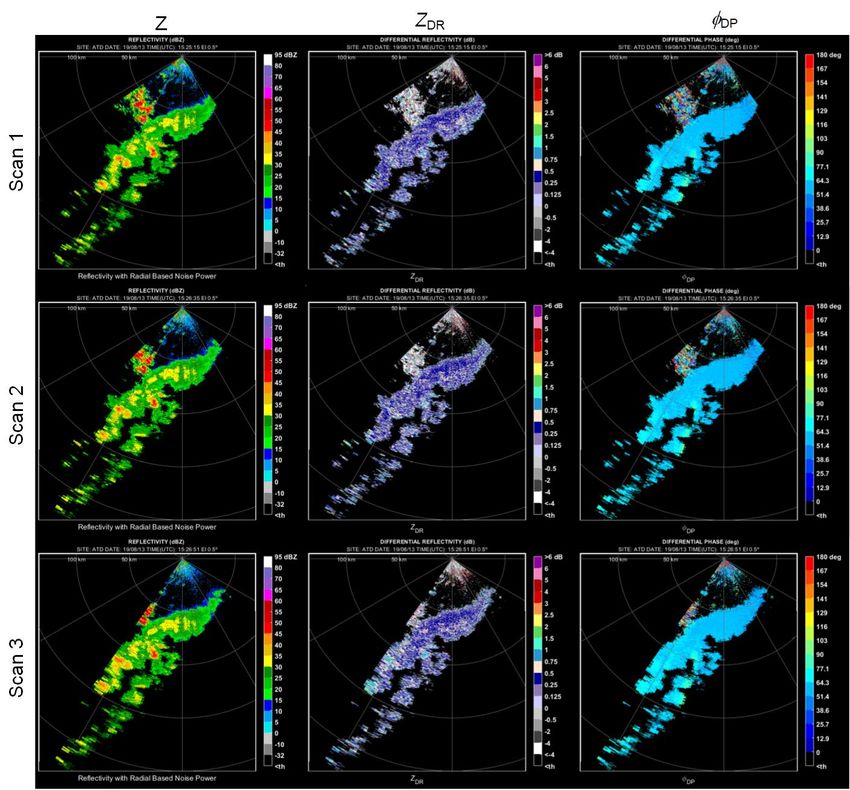
American Meteorological Society 100th Annual Meeting, Boston, 2020

elements with dual linear polarization (H and V), for     2. DATA CORRECTIONS USING NEAR-FIELD
a total of 4864 elements. This arrangement of                MEASUREMENTS
antenna elements, spaced by λ/2, results in a ~4×4
                                                               Prior to installation in Norman OK, the ATD
m aperture which produces a beam that is ~1.6°
                                                          antenna transmit and receive copolar as well as
wide at broadside. On receive, the antenna is
                                                          cross-polar patterns were measured in the near-
partitioned into overlapped subarrays (consisting of
                                                          field (NF) chamber at the MIT-Lincoln Laboratory
8 panels each) to produce lower sidelobes and
                                                          facilities during March-April 2018 (Conway et al.,
suppress grating lobes outside of the main beam of
                                                          2018). The patterns were collected for a total of
the subarray pattern (Herd et al, 2005). It makes
                                                          2859 electronic beamsteering positions. The beam
use of pulse compression waveforms to meet
                                                          peaks at all measured locations are shown in Fig.
sensitivity and range-resolution requirements
                                                          2 (left and middle panels). Further, by extracting
(Schvartzman and Torres, 2019). The operating
                                                          the copolar beam peaks along the horizontal
frequency band of the antenna is 2.7-3.1 GHz.
                                                          cardinal plane, the copolar beamsteering biases for
     The ATD calibration infrastructure includes a        Z, ZDR and φDP are computed and shown in Fig. 2
far-field calibration tower, located in the vicinity of   (right panels). Note that the biases are
the ATD site. Atop the tower is an S-band standard        scaled to produce beamsteering biases. These
gain horn attached to a motorized platform that           measurements may not represent the current state
allows it to rotate about its axis and set the horn       of the array with utmost accuracy since they were
polarization in horizontal, vertical or any other         obtained about a year prior to the collection of data
desired position. For the purpose of weather              analyzed here. Further, the ATD antenna was
calibration, this infrastructure is to be used to         disassembled and reassembled for transportation
conduct accurate antenna pattern measurements             and installation in Norman, OK.
of the fielded array. Accurate measurements of                 Comparing power outputs of each element
copolar patterns can be used to correct the scan-         during the near-field experiment (April 2018) to
dependent measurement biases.                             those with the ATD system fielded in Norman (May
                                                          2019) shows little to no increase in failed elements.
      In this paper, an overview of the latest data
                                                          Specifically, this comparison indicated 11 and 6
correction efforts on the ATD system is presented.
                                                          additional transmit elements failures on the
Note that the efforts described herein aim at
                                                          horizontal and vertical polarizations, respectively.
correcting beamsteering biases (i.e., biases
                                                          Thus, given the small change in the state of failed
relative to a reference point such as broadside) to
                                                          elements in the array, and assuming that the radar
achieve self-consistency whereby the data bias
                                                          is sufficiently stable with time and temperature, the
remains the same for all beamsteering positions
                                                          near-field measurements are used herein to correct
(i.e., beamsteering self-consistency). If this is
                                                          for the copolar biases. Note that we used the NF
achieved, the ATD calibration reduces to that of a
                                                          based corrections to mitigate to the system induced
parabolic antenna radar. The paper is structured as
                                                          biases relative to the broadside while the absolute
follows: In section 2, we present correction
                                                          calibration values were estimated via the
methods based on measurements obtained in the
                                                          comparison with the collocated NEXRAD radars.
anechoic chamber. In addition, we present a
statistical evaluation of these corrections using real         The corrections were tested on data sets
data collected with the ATD to provide a                  collected consecutively on August 13, 2019 via
quantitative comparison between non-corrected             twelve scans, which were mechanically shifted by
and corrected data. Section 3 presents corrections        10° in azimuth, and at a constant elevation of 0.5°.
obtained by measuring co-polar and cross-polar            The overlapping parts of the scans are used to
patterns using the far-field calibration tower.           assess the difference in estimated polarimetric
Section 4 presents an alternative method to derive        variables from collocated volumes illuminated
corrections using weather echoes. The summary is          using distinct electronic steering angles (herein
given in section 5.                                       referred to as self-consistency). The differences
                                                          are analyzed when no corrections are applied for
                                                          the effects of beamsteering and after applying the
                                                          copolar polarimetric corrections derived from the
                                                          near-field measurements.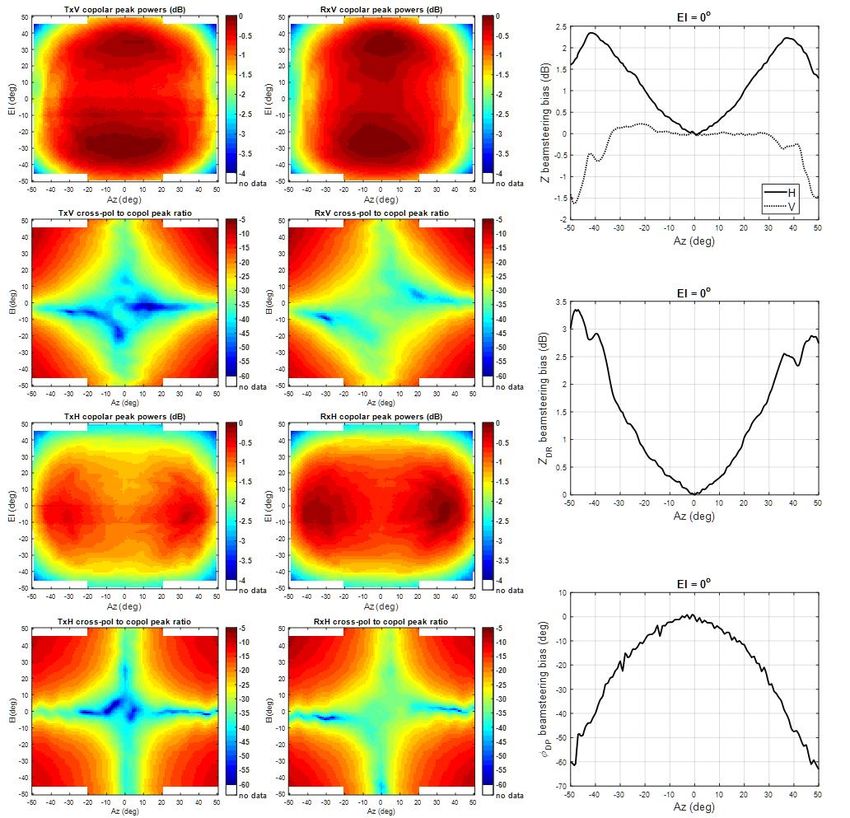
American Meteorological Society 100th Annual Meeting, Boston, 2020
Fig. 2. Transmit (left panels) and receive (middle panels) beam peak powers of the ATD antenna
measured in the near-field chamber. Near-field measured copolar beamsteering biases along
horizontal principal plane (right panels).
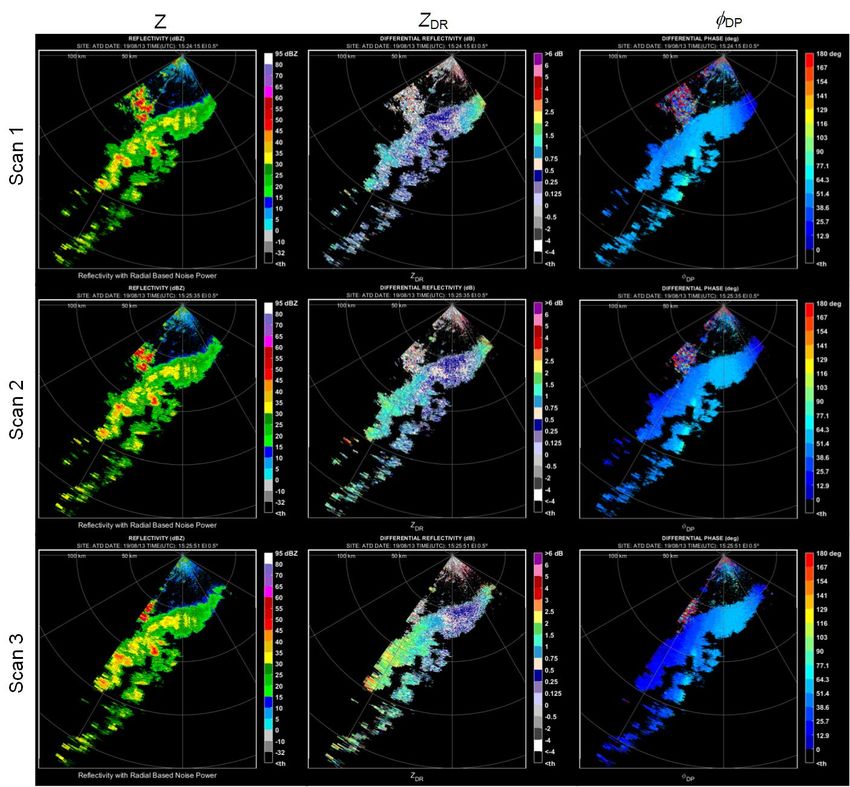
The results before and after corrections are weather obtained results for Z are rather noisy and
presented in Fig. 3 and Fig. 4. Visual comparison indicate the span of system induced biases of ~±2
of overlapping areas reveals differences in ZDR and dB (dashed line in the upper left panel) while the
φDP among estimates from different scans in Fig. 3. NF measurements (grey line in the upper left panel)
It is clear that these differences are induced by the suggest the span of ~±1 dB. Because, the Z color
system as indicated by the NF measurements (Fig. scales in Fig. 3 and Fig. 4 are in steps of 5 dB, the
2). After applying corrections, the differences are system Z biases are not noticeable in the leftmost
visibly reduced as demonstrated in Fig. 4. Further, panels of Fig. 3. In case of ZDR (upper right panel),
the differences at each beamsteering position are the overlap between the NF and weather results is
averaged in range and shown in Fig. 5 along with clearly visible for azimuths of about ±25° but
differences computed from NF measurements. The degrades outside this window. This is also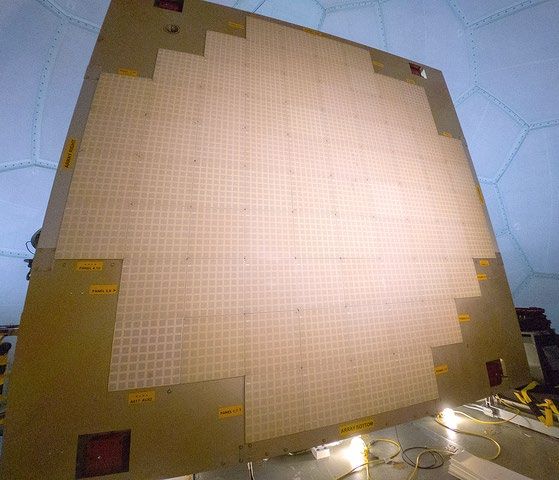
American Meteorological Society 100th Annual Meeting, Boston, 2020

  Fig. 3. Raw non-corrected estimates of reflectivity (left) differential reflectivity (center), and differential
            phase (right) for three consecutive scans shifted mechanically by 10° in azimuth.
corroborated by the weather derived results for the         asymmetric and centered off zero while the
corrected ZDR differences (solid line in the upper          histogram after corrections becomes much more
right panel) as the fluctuations around zero become         symmetric and is centered approximately at 0 dB.
larger outside the ±25° interval.                               The improvement in the broader statistical
     The results for φDP (lower left panel), exhibit the    sense is further illustrated in Fig. 6 using data that
best matching between the weather and NF                    was collected on August 22, 2019. It presents two-
results. Accordingly, the weather derived                   dimensional histograms (normalized so that the
differences after corrections exhibit relatively small      maximum value is one) of ZDR estimates, before
fluctuations around zero over the entire measured           and after corrections, for two scans that are
interval. In a broader statistical sense, the benefits      separated in azimuth by 5°, where the time
of ZDR corrections are demonstrated by the                  between scans is ~29 seconds. Notice that the
histograms of ZDR differences before and after              histogram of uncorrected ZDR estimates exhibits
corrections (the lower right panel in Fig. 5). These        significant spread (from ~1 to 5 dB) while the
show that the histogram before corrections is               histogram produced from corrected estimates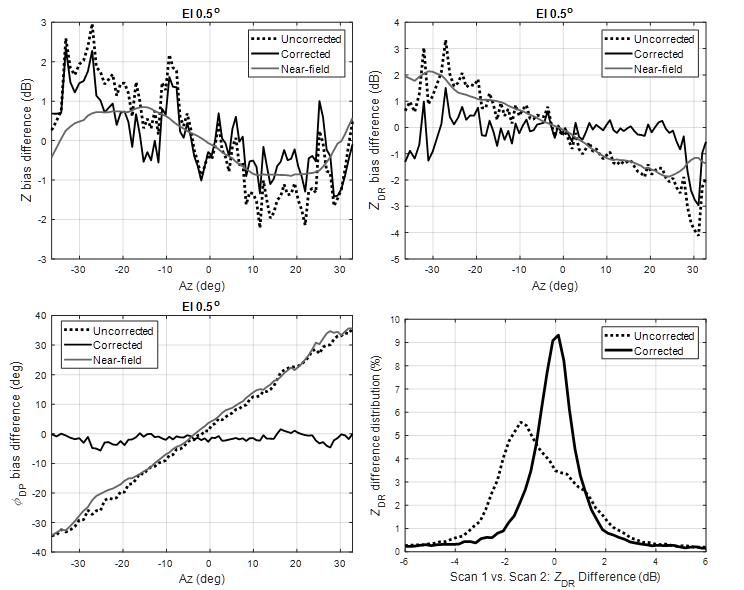
American Meteorological Society 100th Annual Meeting, Boston, 2020

                        Fig. 4. Estimates after correction using NF measurements
                                (analogous to non-corrected data in Fig. 3).

indicates that the majority of ZDR values in both     consistency of the corrections from NF
scans are concentrated at and around 0 dB. This is    measurements. That is, there are significant
a clear indication of bias reduction as a result of   differences between the 25th, 50th (median), and
beamsteering bias corrections. Using ten              75th percentile values of the uncorrected set of box
consecutive weather collections (also collected on    plots (left panel on Fig. 7) before and after the
August 22, 2019), we further demonstrate the self-    rotation. Additionally, the median ZDR estimates
consistency improvements by summarizing several       transition from ~1.8 dB to 2.7 dB in a matter of
histograms of uncorrected and corrected ZDR fields    about five minutes. In contrast, the corrected set of
into the boxplot presented in Fig. 7. The             box plots (right panel on Fig. 7) shows nearly
mechanical rotation in azimuth and the average        identical statistical properties for fields estimated
time between consecutive scans are 5°, and 28         before and after the rotation, and the median ZDR
seconds (exact time difference shown in the x-axis    estimates more reasonably transition from ~0.9 dB
labels). With over 100,000 data points used for       to 1.2 dB in about five minutes.
each box, this shows the robustness and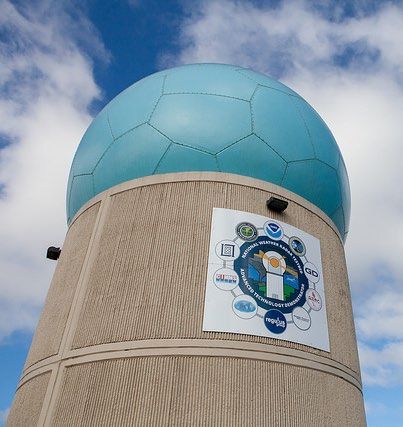
American Meteorological Society 100th Annual Meeting, Boston, 2020

     Fig. 5. Range averaged system induced differences among estimates from collocated volumes
illuminated during scans 1 and 3 (upper and lower left panels) as well as histograms of ZDR differences
                            before and after corrections (lower right panel).

 Fig. 6. Two-dimensional normalized histograms illustrate the self-consistency of ZDR estimates between
two scans (~29 seconds apart) before and after a mechanical rotation of 5° without corrections (left) and
                                        with corrections (right).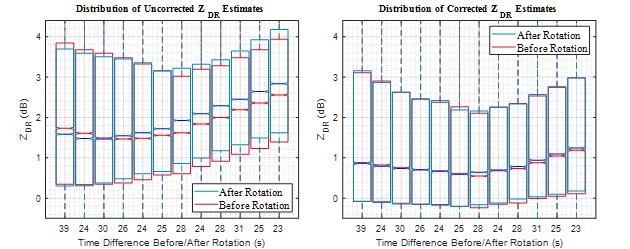
American Meteorological Society 100th Annual Meeting, Boston, 2020

    Fig. 7. Boxplots of uncorrected (left) and corrected (right) fields of ZDR from consecutive weather
  collections. The mechanical rotation in azimuth between consecutive pairs of scans is of 5°, and the
   average time between consecutive scans is 28 seconds (exact time difference shown in the x-axis
                                                  labels).

3. WEATHER CALIBRATION                USING      THE        m. It is attached to a motorized platform that allows
   CALIBRATION TOWER                                        it to rotate about its axis and set the horn
                                                            polarization in horizontal, vertical or any other
     The calibration infrastructure for the ATD             desired position (Fig. 8). This provides for
includes a 45.7 m far-field calibration tower, located      measurements described in Ivić, 2018b. RF-over-
428 m north of the ATD. Atop the tower, an S-band           fiber links connect the ATD and calibration tower,
standard gain horn is mounted at the height of ~45

                                                                Horn Height: 45 m
                                                                Height of the ATD Antenna Center: 11.6 m
                                                                Distance from ATD to Cal. Tower: 428 m

                                         Calibration Tower Equipment Racks
                                              RF Over Fiber Transceivers
           ACU

         UPS
                                                   CONDUIT                                CALIBRATION
                                                                                        TOWER EQUIPMENT
                      WATER                SINGLE MODE OPTICAL FIBER
                                                                                            SHELTER
                      CHILLER
                                                     (12)

                                     Fig. 8. ATD calibration infrastructure.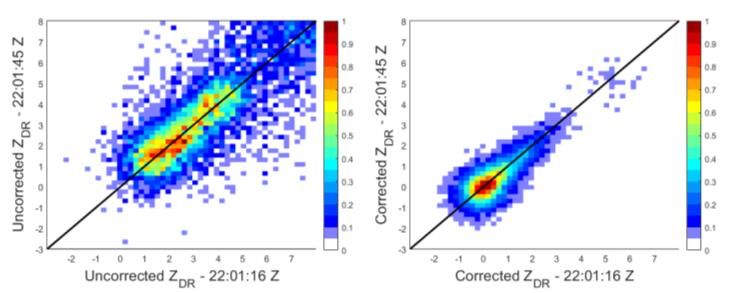
American Meteorological Society 100th Annual Meeting, Boston, 2020

allowing coherent calibration. A matrix of switches,   of the ATD antenna, (2) remote horn connected to
attenuators, and amplifiers supports the following     the    ATD      exciter    for    coherent      receive
multiple modes of measurement: (1) remote horn         measurements of the ATD antenna, (3) remote
connected to a continuous-wave source for non-         horn connected to the ATD receiver for coherent
coherent receive measurements                          transmit measurements of the ATD antenna, and
                                                       (4) remote horn connected to a delay line for two-
                                                       way measurements. Mechanical positioning of the
                                                       ATD antenna in azimuth and elevation allows
                                                       measurements at any steering angle, enabling
                                                       calibration data to be collected for all electronic
                                                       scan positions of interest. Hence, the antenna can
                                                       be mechanically placed in such elevation and
                                                       azimuth position so that when the beam is
                                                       electronically steered in the direction to be
                                                       measured, it points towards the horn location. It is
                                                       unlikely that the antenna positioning with respect to
                                                       the horn will be perfect so a box scan will be
                                                       conducted around the assumed horn location to
                                                       precisely determine the boresight location which
                                                       points towards the horn and for which the
                                                       calibration data is to be collected. This will result in
                                                       a grid of measurement points with non-uniform
                                                       spacing. Consequently, an interpolation will be
                                                       applied to produce correction factors where
                                                       needed.
                                                             This infrastructure is currently being developed
                                                       and integrated into the ATD system and it will be
                                                       used      to     obtain    accurate     far-field    (FF)
                                                       measurements of the fielded array. Accurate
                                                       measurements of copolar patterns can be used to
                                                       correct the antenna induced copolar biases in
                                                       differential reflectivity (ZDR) and phase (φDP)
                                                       estimates as well as to correct reflectivity (Z)
                                                       (Doviak and Zrnić, 1993) as the beam is steered
                                                       away from broadside (assuming the known system
                                                       calibration constant for Z at broadside). An
                                                       example of these measurements is presented in
                                                       Fig. 9. Further, the described infrastructure will be
                                                       used to characterize the cross-polar ATD antenna
                                                       patterns.       In    combination       with      copolar
                                                       measurements, these may be used to create the
                                                       full correction matrices that account for the copolar
                                                       biases and mitigate the effects of cross coupling at
                                                       the same time. These matrices may be used for
                                                       correction at beamsteering locations where the
                                                       cross-polar patterns are high and the cross
     Fig. 9. An example of Calibration tower           coupling suppression via pulse-to-pulse phase
 measurements at elevation 0°. Z beamsteering          coding is insufficient. cross-polar patterns are high
 bias (left panel). ZDR beamsteering bias (middle      and the cross coupling suppression via pulse-to-
   panel). φDP beamsteering bias (right panel).        pulse phase coding is insufficient.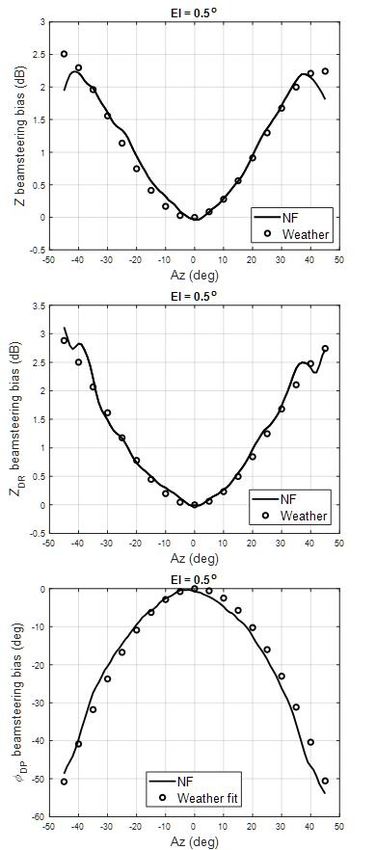
American Meteorological Society 100th Annual Meeting, Boston, 2020

4. USING WEATHER ECHOES TO ESTIMATE                      are small or can be sufficiently suppressed (e.g.,
   THE BEAMSTEERING BIASES                               using pulse-to-pulse phase coding). This method
                                                         requires further research to establish its usefulness
     In addition to the efforts described so far,
                                                         and accuracy.
recent research also explored the possibility of
using weather returns to estimate the relative self-
consistency corrections curves. To produce such
estimates, the radar must be capable to illuminate
collocated volumes using distinct electronic
steering angles. This in turn, requires the antenna
to be mounted on a pedestal as in ATD. Given that
this is the most likely operating architecture, this
approach (if feasible) may have an operational
value. It may be used to validate the existing
correction values as well as to aid in the calibration
process. An example produced from 10 pairs of
ATD scans, where the two scans in each pair are
shifted 5° in azimuth with respect to each other, is
shown in Fig. 10.

5. CONCLUSION
     The weather data correction efforts described
here are the first of a kind and have vital importance
for the development of PAR technology for weather
observations. In that regard, the results of data
correction     using      NF    measurements       are
encouraging because they demonstrate visible
improvement in the self-consistency of ZDR and φDP
fields. This conclusion is substantiated with
statistical results presented in Figs. 5.– 7. These
results undeniably demonstrate the benefits of data
corrections. This is quite remarkable since the NF
measurements were conducted more than a year
before data collections and the ATD antenna was
disassembled for transportation and reassembled
in Norman, OK. Nonetheless, while the NF based
corrections exhibit improvements it is unlikely that
the applied corrections achieve the beamsteering
self-consistency accuracies within the desired
limits (e.g., ±0.2 dB for ZDR).
     Originally, intended approach to achieve ATD
beamsteering self-consistency and calibration is
via Calibration Tower. These efforts are ongoing
and are troubled with hardware/software issues,
equipment instabilities and multipath effects. This
is somewhat expected as Calibration Tower efforts           Fig. 10. Results of using weather echoes to
are still in the beginning stage.                          estimate the relative system biases for Z (left
    The third approach is to use weather echoes to        panel), ZDR (middle panel), and φDP (right panel).
estimate the correction data that achieve                    In general, it is encouraging that the correction
beamsteering self-consistency. This method can           curves produced using the three methods are all
provide a valid correction data estimates only at        comparable. However, it is yet to be established
beam locations where the effects of cross coupling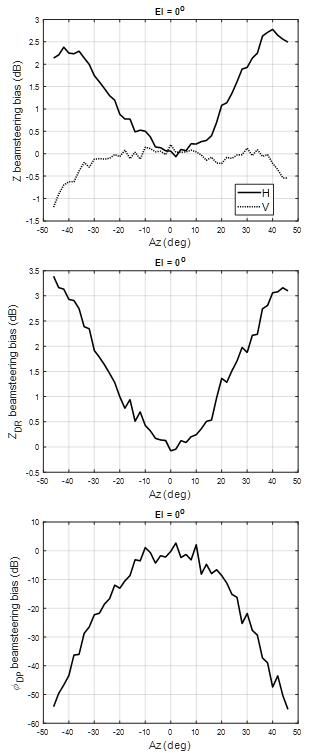
American Meteorological Society 100th Annual Meeting, Boston, 2020

whether the corrections that achieve accuracies              reflectivity bias in polarimetric PAR. IEEE
within desired limits are achievable.                        Trans. Geosci. Remote Sens., 54, 431–451,
                                                             doi:https://doi.org/10.1109/TGRS.2015.245
6. ACKNOWLEDGMENT                                            9047
The authors would like to acknowledge the              Ivić, I. R., 2017a: Phase Code to Mitigate the
contributions of numerous engineers, students,                Copolar Correlation Coefficient Bias in PPAR
scientists, and administrators who have supported             Weather Radar. IEEE Trans. Geosci.
these developments over the last decade.                      Remote Sensing, GE-55(4), 2144-2166, doi:
                                                              https://doi.org/10.1109/TGRS.2016.263772
This conference paper was prepared with funding               0
provided by NOAA/Office of Oceanic and
Atmospheric Research under NOAA-University of          Ivić, I. R., 2017b: An experimental evaluation of
                                                               phase coding to mitigate the cross-coupling
Oklahoma           Cooperative           Agreement
                                                               biases in PPAR. Preprints 38th International
#NA16OAR4320115,          U.S.     Department     of
                                                               Conference on Radar Meteorology, Chicago,
Commerce. The statements, findings, conclusions,               IL.
and recommendations are those of the authors and
do not necessarily reflect the views of NOAA or the    Ivić, I. R., 2018: Options for Polarimetric Variable
U.S. Department of Commerce.                                   Measurements on the MPAR Advanced
                                                               Technology Demonstrator, IEEE Radar
7. REFERENCES                                                  Conference          (RadarConf18),       doi:
                                                               https://doi.org/10.1109/RADAR.2018.83785
Bhardwaj, S.,         and Y. Rahmat-Samii, 2014:               44
     Revisiting the generation of cross-
     polarization in rectangular patch antennas: A     Ivić, I. R., 2018a: Effects of Phase Coding on
     near-field approach. IEEE Antennas Propag.               Doppler Spectra in PPAR Weather Radar.
     Mag., 56, 14–38, doi:https://doi.org/10.1109/            IEEE Trans. Geosci. Remote Sensing,
     MAP.2014.6821758.                                        GE-56(4), 2043 – 2065, doi: https://doi.org/
                                                              10.1109/TGRS.2017.2772962
Conway, D., J. Herd, M. Fosberry, M. Harger, C.
    Weigand, M. Yeary, and K. Hondl, 2013: On          Ivić, I.R., 2018b: On the Use of Horn Antenna to
    the development of a tileable LRU for the                  Calibrate the MPAR Advanced Technology
    nextgen surveillance and weather radar                     Demonstrator. 10th European Conference
    capability program. 2013 IEEE International                on Radar in Meteorology and Hydrology,
    Symposium on Phased Array Systems and                      Wageningen, Netherlands.
    Technology,           IEEE,        490–493,        Ivić, I. R., 2019: Facets of Planar Polarimetric
    doi:https://doi.org                                       Phased Array Radar Use for Weather
    /10.1109/ARRAY.2013.6731877.                              Observations. AMS 99th Annual Meeting,
Conway, M. D., D. Du Russel , A. Morris, and C.               Phoenix, AZ.
    Parry, 2018: Multifunction phased array            Ivić, I. R., and D. Schvartzman 2019: A first look at
    radar advanced technology demonstrator                     the ATD data corrections. Preprints, 39th
    nearfield test results. Proc. of the IEEE,                 International    Conference     on     Radar
    doi: https://doi.org/10.1109/RADAR.2018.83                 Meteorology, Nara, Japan. Amer. Meteor.
    78771                                                      Soc.,               Paper               2-06.
Doviak, R. J., and D. S. Zrnić, 1993: Doppler                  https://cscenter.co.jp/icrm2019/program/dat
     Radar and Weather Observations. Academic                  a/abstracts/Poster2-06_2.pdf
     Press, 562 pp.                                    Schvartzman, D., and S. Torres, 2019: Design of
Herd, J. S., S. M. Duffy, and H. Steyskal, 2005:            Practical Pulse Compression Waveforms for
      Design considerations and results for an              Polarimetric Phased Array Radar. Preprints,
      overlapped     subarray radar    antenna.             39th International Conference on Radar
      Preprints, IEEE Aerospace Conf., Big Sky,             Meteorology, Nara, Japan. Amer. Meteor.
      MT,                doi:              http://          Soc.,              Paper             15A-02.
      dx.doi.org/10.1109/AERO.2005.1559399                  https://cscenter.co.jp/icrm2019/program/dat
                                                            a/abstracts/Session15A-02_2.pdf
Ivić, I. R., and R. J. Doviak, 2016: Evaluation of
        phase coding to mitigate differential
American Meteorological Society 100th Annual Meeting, Boston, 2020
Stailey, J. E., and K. D. Hondl, 2016:
Multifunction phased array radar for aircraft
and weather surveillance. Proc. IEEE, 104,
649–659, doi: https://doi.org/10.1109/
JPROC.2015.2491179.
Weber, M. E., 2019: Meteorological Phased Array
Radar Research at NOAA’s National Severe
Storms Laboratory. 2019 IEEE International
Conference on Microwaves, Antennas,
Communications and Electronic systems
(COMCAS). Tel Aviv, Israel.
Zrnić, D. S., and Coauthors, 2007: Agile-beam
phased array radar for weather
observations. Bull. Amer. Meteor. Soc., 88,
1753–1766, https://doi.org/10.1175/BAMS-
88-11-1753.
Zrnić, D. S., V. M. Melnikov, and R. J. Doviak,
2012: Issues and challenges for polarimetric
measurement of weather with an agile beam
phased array radar. NOAA/NSSL Rep., 119
pp. [Available online:http://www.nssl.noaa.
gov/publications/mpar_reports/]
Zrnić, D.S., R.J. Doviak, V.M. Melnikov, and I.R.
Ivić, 2014: Signal Design to Suppress
Coupling in the Polarimetric Phased Array
Radar. J. Atmos. Oceanic Technol., 31,
1063–1077, https://doi.org/10.1175/JTECH-
D-13-00037.1.You can also read