The impact of recent climate on fire danger levels in New Zealand - NZIF

Page created by Tyrone Reeves
 
CONTINUE READING
The impact of recent climate on fire danger levels in New Zealand - NZIF
Remote sensing

The impact of recent climate on fire danger levels in
New Zealand
Murray Dudfield, H. Grant Pearce and Geoff Cameron

Mt Cook Station – January 2008 fire

Abstract                                                            Background
     Have changes in weather conditions impacted                          From a forest and rural fire standpoint, a fire danger
on the day-to-day management of fires in the New                    rating system is the cornerstone for the day-to-day
Zealand forest and rural landscape? The aim of this                 management of fire risk. These systems integrate the
paper is to look at the impacts of climate over the past            effects of weather and other fire environment factors,
four to five decades and to use an assessment of past               fuels and topography, to indicate the ease of ignition,
and present fire danger levels in New Zealand to assess             rate of fire spread, difficulty of control and potential
what changes, if any, have occurred. The objective                  fire impact (Merrill & Alexander, 1987). Such systems
is to evaluate the question as to whether a change in               provide a metric in the form of a fire danger rating
the availability of fuel for combustion has taken place             or index(es) that can be used to support many daily
between the periods pre-2000 and 2000 to 2020. This                 operational decisions (such as suppression resource
study looked to analyse three key components of the                 needs, alert levels, mobilisation and positioning),
daily outputs from the NZ Fire Danger Rating System                 and longer-term strategic planning (e.g. defining
(NZFDRS) for 15 representative fire weather stations                burn prescriptions, justifying financial requirements,
located throughout New Zealand. These historical                    assessing future fire risk, etc). Fire danger rating is
datasets range in length from 24 to 59 years. The results           a mature science with almost a century of research,
from this largely qualitative analysis show a trend that            development and applications behind it.
fuel availability for combustion prior to the year 2000
                                                                         All fire danger rating systems have the common
generally does not appear to have increased in the past
                                                                    objective of obtaining a relatively simple and comparable
20 years. A general overall decrease in regional fire
                                                                    measure of fuel flammability from day-to-day (Chandler
danger levels was seen for South Island stations, apart
                                                                    et al., 1983). In this study, the tool available to assist in
from a minimal increase for Queenstown. For the North
                                                                    providing the evidence to determine whether the levels
Island, regional fire danger levels indicated no overall
                                                                    of fuel availability for combustion in New Zealand
change, but a nominal increase for the Central North
                                                                    have changed or not over the past 60 years is the NZ
Island, Auckland, Whanganui and Northland. Despite
                                                                    Fire Danger Rating System (NZFDRS) (Anderson, 2005;
these differences between regions and islands, this
                                                                    Alexander, 2008).
study shows that outputs from the NZFDRS indicate a
marginal overall downward trend in fire danger levels                   The NZFDRS is a New Zealand branded version
across New Zealand for the past 20 years compared to                of the Canadian Forest Fire Danger Rating System
the period prior to 2000.                                           (CFFDRS) (Stocks et al., 1989). The CFFDRS, or at

12                                    NZ Journal of Forestry, February 2021, Vol. 65, No. 4
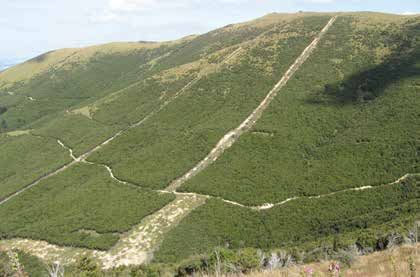
The impact of recent climate on fire danger levels in New Zealand - NZIF
Professional papers

least its major subsystem (the Fire Weather Index                      speed and 24‑hour rainfall (Van Wagner, 1987). The
(FWI) System), is extensively used both nationally                     six standard components provide numerical ratings of
and internationally to aid operational wildland fire                   relative potential for vegetation fires.
decision-making (Taylor & Alexander, 2006). The
                                                                            For the purposes of the fire climate trend analysis
CFFDRS has undergone considerable development since
                                                                       undertaken here, three components from the FWI
its introduction in Canada in 1971. Today it is one of
                                                                       System were chosen. The Build Up Index (BUI), Drought
the most comprehensive and scientifically-based rural
                                                                       Code (DC) and Initial Spread Index (ISI) referred to in
fire land management decision support systems in the
                                                                       Figure 1 are defined as:
world. The CFFDRS enables fire managers to predict fire
behaviour in most of their major fuel types and it is used             •     The BUI is a numeric rating of the total amount of
extensively for fire protection planning and operations.                     fuel available for combustion. It combines the Duff
The system is modular, computer and manually-based,                          Moisture Code (DMC) and the DC
and can be used in other countries by incorporating
                                                                       •     The DC is a numeric rating of the average moisture
additional fuel types, provided the underpinning
                                                                             content of deep, compact organic layers within the
research is done to validate or extend the relationships
                                                                             forest floor. This code is a useful indicator of seasonal
between observed fuel moisture and the fire danger
                                                                             drought effects on forest fuels and the amount of
ratings (Wagner, 1988; Fogarty, et al., 1998; Anderson &
                                                                             smouldering in deep duff layers and large logs
Anderson, 2009). The FWI System was introduced into
New Zealand in 1980 following a review of the main                     •     The ISI is a numerical rating of the expected rate of
fire danger rating systems available around the world                        fire spread. It combines the effects of wind and the
at that time (Valentine, 1978), and has undergone                            Fine Fuel Moisture Code (FFMC) on rate of spread
only minor modifications for change of latitude and                          without the influence of variable quantities of fuel.
season (Alexander, 1992; NRFA & NZFRI, 1993). This
                                                                             The ISI, BUI and FWI are each designed to represent
was followed by the adoption of the broader CFFDRS,
                                                                       some aspect of fire behaviour after ignition has taken place.
including the empirical approach to developing a Fire
                                                                       The FFMC, DMC and DC, on the other hand, represent
Behavior Prediction (FBP) System using experimental
                                                                       fuel moisture in different size classes of fuels and should
burns (Anderson, 2005, 2009; Pearce et al., 2012). In
                                                                       therefore be related to the ease of ignition and availability
the NZFDRS, this allows the fire danger indices from the
                                                                       for combustion. None of the FWI System components
FWI System (Figure 1) to be supported by fire danger
                                                                       says anything about the presence or level of activity of
classes for three fuel types, i.e. forest, grassland and
                                                                       fire-starting agents, in other words, fire ignition risk. Any
scrubland (Anderson, 2005; Alexander, 2008).
                                                                       comparison between actual fire occurrences and the FWI
    Figure 1 illustrates that the components of                        System combines both flammability (i.e. the relative ease
the FWI subsystem of the NZFDRS. Calculation                           with which a substance ignites and sustains combustion)
of the components is based on consecutive daily                        and risk of ignition. The FWI System components can
observations of temperature, relative humidity, wind                   measure flammability but cannot account for ignition risk.

Fire                           Temperature,                     Wind                   Temperature,               Temperature,
weather                      relative humidity,                                      relative humidity,              rain
observations                     wind, rain                                                  rain

Fuel                             Fine Fuel                                             Duff Moisture              Drought Code
moisture                       Moisture Code                                           Code (DMC)                     (DC)
codes                             (FFMC)

                                                            Initial Spread                          Build Up Index
                                                              Index (ISI)                                (BUI)
Fire
behaviour
indices
                                                                                 Fire Weather
                                                                                  Index (FWI)

Figure 1: Inputs and outputs of the Fire Weather Index (FWI) System

                                      NZ Journal of Forestry, February 2021, Vol. 65, No. 4                                       13
Remote sensing

Since a fire start depends most of all on the flammability
of the fine surface fuel, the FFMC is the FWI System
component most likely to compare well with vegetation
fire occurrence. In addition, this paper has not considered
whether there have been changes in fuel loadings in our
forest and rural landscape over the past five decades.
      The impacts of climate change on New Zealand
and our environment is front and foremost in most
people’s minds. From a forest and rural fire perspective,
is climate change already occurring, and has this had
an impact on increasing periods of elevated fire danger,
or is it leading to little change or even a reduction in
fire danger levels for some parts of the country?

Fire danger level regional assessment
methodology
     This study uses daily climatology records from              Mt Torlesse Station – research burn site in Canterbury 2008
15 weather stations located within different regions
throughout New Zealand. Data was obtained from the                   To aid the simple assessment of overall changes
Fire Weather System managed for Fire and Emergency               from the historical trend period to current, one of five
New Zealand by the National Institute of Water and               change categories was identified for each of the six
Atmospheric Research (NIWA), and records for discontinued        indicators of change in fire danger values for each of
Meteorological Service of NZ stations updated to June            the 15 stations:
2020 with synoptic data provided by MetService.                  •    A notable increase in fire danger values
    The study looked at two groups of fire danger                •    A nominal increase
indicators. These included:
                                                                 •    No overall change
•    The monthly maximum BUI, DC and ISI values                  •    A nominal decrease
     from historical datasets for the 15 weather stations
     ranging in length from 24 to 59 years. For stations         •    A notable decrease.
     with data available for more than 20 years prior to              No formal statistical analysis was undertaken, and
     2000, this was trended against the 20-year period           the difference between a ‘notable’ and ‘nominal’ change
     following 2000. For those stations with historical          was based on a visual assessment of graphical comparisons
     indicators covering a 24-year period only, this data        of annual or monthly values for each station (e.g. see
     was split to compare two 12-year periods                    Figure 2 – Taupo and Figure 3 – Gisborne). For frequency
•    The number of days with DC greater than 300,                of days above the identified threshold values, assessment
     BUI greater than 60 and ISI greater than 10 were            of change was based on the slope of a line for the five-year
     identified, and a five-year rolling average was then        moving average of annual frequency counts over each
     applied to each station.                                    comparison period. For maximum values, assessment of
                                                                 change was based on the difference in maximum monthly
      For the BUI and DC, most of the 15 weather                 values for each comparison period, with strength of
stations selected took into account an extended length           change being based on the number of months values were
of available daily data, with 11 of the stations having          above or below and the difference in maximum values.
daily data history ranging back more than 40 years. The
analyses for each of the 15 weather stations involved            Results
nearly one million daily data records for the BUI, DC
and ISI. The full datasets and detailed results for each              The high level-results of this assessment are outlined
station are available as supplementary data from both            in Table 1. For the 90 fire danger indicators across the 15
the NZ Institute of Forestry (www.nzif.org.nz) and Scion         weather stations, 68 (77%) of the indicators showed a no
Rural Fire Research (www.scionresearch.com/rural-fire-           change to a nominal or notable decrease, versus 22 (23%)
research) websites. However the lack of ISI data history         of the indicators showing a nominal to notable increase.
for the Napier, Masterton and Blenheim stations prior
                                                                     In fact, more stations showed decreases in fire
to 1996 meant the monthly maximum ISI data for this
                                                                 dangers for the period since 2000 compared to the
first part of the study covered only a period of 24 years.
                                                                 period prior to 2000, whether nominal or notable.
     The second part of the study took account of the            Gisborne, Nelson, Blenheim and Christchurch mainly
number of days each year with values above recognised            showed decreases, including many notable decreases,
thresholds – for DC above 300, BUI above 60, and ISI             with Invercargill and Paraparaumu also showing
above 10. For the 15 weather stations, the daily data            no change or decreases. Only two stations (Taupo,
history ranged from 24 to 59 years.                              Whanganui) showed notable increases, with significant

14                                 NZ Journal of Forestry, February 2021, Vol. 65, No. 4
Professional papers

   increases for the number of days of DC >300 and                                           forest and rural landscapes, especially in the South
   maximum monthly BUI and DC values since 2000. The                                         Island, a key component is annual rainfall trends.
   remaining stations showed more variable trends, with                                      The Meridian Energy study has suggested that climate
   a mix of increases, decreases and/or no changes in fire                                   change may result in more rainfall impacting the West
   danger indicators for the two comparison periods.                                         Coast and Southern Alps. In their May 2019 ‘Meridian
                                                                                             Climate Change Impacts on NZ Renewable Electricity
        In general, increases occurred in the north (Kaitaia,
                                                                                             Generation to 2050’ presentation to the Major
   Auckland) and central (Taupo, Whanganui) North
                                                                                             Electricity User Group, they flagged that:
   Island, and also for Queenstown in the South Island.
   Decreases occurred on the East Coast of the North                                         •     An increase in air temperature of 1°C results in an
   Island (Gisborne) and in the northern South Island                                              8% increase in the moisture carrying ability of the air
   (Nelson, Blenheim and Christchurch).                                                      •     Increasing wind speed (projected in coming
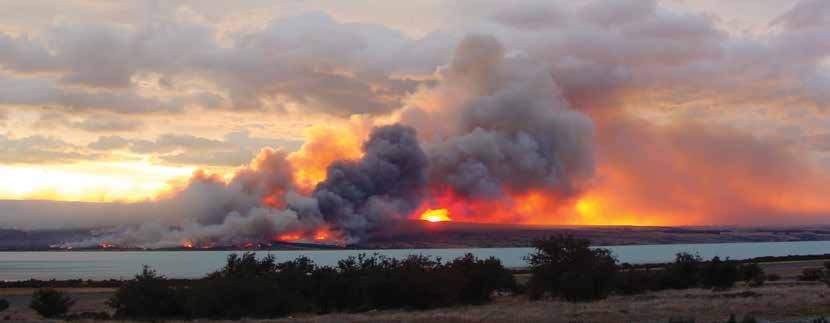
        It should be noted, however, that even though                                              decades) will enhance orographic uplift in the South
   Taupo and Whanganui showed notable increases for                                                Island in particular, enhancing both precipitation
   the number of days with BUI greater than 60 and                                                 amounts and spillover over the Southern Alps and
   DC greater than 300 during the period 1996–97 to                                                in the Waitaki, Clutha and Manapouri catchments
   2019–20. Figure 4 shows that the annual number of                                               (and likely others further north as well)
   days for Taupo and Whanganui do not regularly meet                                        •     For their modelling purposes, they estimated that
   levels experienced at the Gisborne and Napier weather                                           each rain event would be 8% wetter by 2050.
   stations over that same 24-year period.
                                                                                                  The Ministry for the Environment (MfE, 2008) also
                                                                                             previously stated that they expect annual mean rainfall
   Discussion                                                                                out to 2040 to increase in the Tasman, West Coast,
        A recent study by Meridian Energy (2019) could                                       Otago, Southland and Chatham Islands regions. These
   assist in understanding why there may have been a                                         areas are also likely to get more heavy downpours.
   decrease in fuel availability to burn in the past 20 years                                Northeastern districts – Northland, Auckland, Gisborne
   compared to the period prior to 2000. If we look at                                       and Hawke’s Bay – are predicted to get less rain. Such an
   the current and future impacts on fire weather in our                                     increase in rainfall, either as an increase in rain days or

   Taupo Weather Station BUI
 Number of days with BUI >60                                                                 Maximum monthly BUI (1973–2001, 2002–2010)
 90                                                                                         160
 80       BUI >60
                                                                                            140      1973–2000
 70       5 per. Mov. Avg. (BUI >60)
                                                                                            120      2001–2019
 60                                                                                         100
 50
                                                                                             80
 40
 30                                                                                          60
 20                                                                                          40
 10                                                                                          20
  0                                                                                           0
      7

           9

                 1

                         3

                                 5

                                        7

                                                  9

                                                         1

                                                                3

                                                                       5

                                                                              7

                                                                                      9

                                                                                                      l

                                                                                                     g

                                                                                                             p

                                                                                                                  ct

                                                                                                                          v

                                                                                                                              c

                                                                                                                                   n

                                                                                                                                        b

                                                                                                                                              ar

                                                                                                                                                      r

                                                                                                                                                     ay

                                                                                                                                                                n
                                                                                              Ju

                                                                                                                                                   Ap
  –9

         –9

                –0

                       –0

                              –0

                                      –0

                                              –0

                                                     –1

                                                             –1

                                                                    –1

                                                                           –1

                                                                                  –1

                                                                                                                       No

                                                                                                                              De

                                                                                                                                   Ja

                                                                                                                                                               Ju
                                                                                                  Au

                                                                                                          Se

                                                                                                                                        Fe
                                                                                                                 O

                                                                                                                                             M

                                                                                                                                                   M
96

       98

              00

                     02

                            04

                                    06

                                            08

                                                   10

                                                           12

                                                                  14

                                                                         16

                                                                                18

   Figure 2: Example graphs for Build Up Index (BUI) from the Taupo weather station. Above left: Annual number of days with BUI values
   >60 for the period 1996–97 to 2019–20. Above right: Monthly maximum BUI values for the period 1973–2000 compared to 2001–2020.
   (In this case, the trends identified were ‘No change’ for days with BUI >60 and ‘Notable increase’ for monthly maximum BUI over the past
   20 years when compared with the 27 years prior to 2000)

   Gisborne Weather Station BUI
 Number of days with BUI >60 by year (23 years)                                              Maximum monthly BUI (1963–2000, 2001–2019)
100                                                                                         250
                     BUI >60                                                                          1963–2000
 80                  5 per. Mov. Avg. (BUI >60)
                                                                                            200       2001–2019

 60                                                                                         150

 40                                                                                         100

 20                                                                                          50

  0                                                                                           0
   97

          99

                01

                       03

                               05

                                     07

                                             09

                                                    11

                                                           13

                                                                  15

                                                                         17

                                                                                19

                                                                                       21

                                                                                                  l

                                                                                                      g

                                                                                                           p

                                                                                                                  ct

                                                                                                                        v

                                                                                                                              c

                                                                                                                                   n

                                                                                                                                        b

                                                                                                                                             ar

                                                                                                                                                      r

                                                                                                                                                          ay

                                                                                                                                                                  n
                                                                                              Ju

                                                                                                                                                   Ap
                                                                                                                       No

                                                                                                                              De

                                                                                                                                   Ja

                                                                                                                                                               Ju
                                                                                                   Au

                                                                                                          Se

                                                                                                                                        Fe
                                                                                                                 O

                                                                                                                                             M

                                                                                                                                                          M
   –

          –

                 –

                        –

                               –

                                      –

                                             –

                                                     –

                                                            –

                                                                   –

                                                                          –

                                                                                 –

                                                                                        –
96

       98

              00

                     02

                            04

                                   06

                                          08

                                                  10

                                                         12

                                                                14

                                                                       16

                                                                              18

                                                                                     20

   Figure 3: Example graphs for Build Up Index (BUI) from the Gisborne weather station. Above left: Annual number of days with BUI values
   >60 for the period 1996–97 to 2019–20. Above right: Monthly maximum BUI values for the period 1973–2000 compared to 2001–2020.
   (In this case, the trends identified were ‘Nominal decrease’ for days with BUI >60, and ‘Notable decrease’ for monthly maximum BUI over
   the past 20 years when compared with the 27 years prior to 2000)

                                                         NZ Journal of Forestry, February 2021, Vol. 65, No. 4                                                  15
Remote sensing

      in the amount associated with each rain event, would                     element has a strong impact on the daily ISI output
      result in lower BUI and DC values in areas along and                     value from the NZFDRS. The findings from this study
      just east of the Southern Alps, such as seen here in this                are therefore supported by the NIWA predictions for
      study for Nelson and Christchurch in the South Island.                   similar or even reduced wind speeds for the first part of
      Predicted decreases in rainfall for northern areas would                 the century. This is because this study has shown that
      result in increased fire dangers, as also seen here for                  both the frequency of days with ISI above 10 and the
      Kaitaia and Auckland. However, findings for Gisborne                     maximum monthly ISI values over the past 20 years have
      are at odds, with strongly decreased fire dangers shown                  not changed, and in fact in many cases have decreased
      here, compared to the increased levels expected under                    compared with the period prior to the year 2000.
      the MfE (2008) projections of reduced rainfall.
                                                                                    Short and longer-term climate drivers, such as sea-
           Similarly, a 2011 study by NIWA on ‘Scenarios of                    surface temperature changes around New Zealand and
      Storminess and Regional Wind Extremes Under Climate                      across the Pacific and Indian Oceans (including the
      Change’ (Mullan et al., 2011) found that extreme winds                   Madden-Julian Oscillation, El Nino-Southern Oscillation
      are likely to increase over this century in almost all                   (ENSO), Indian Ocean Dipole and Interdecadal
      regions in winter, but decrease in summer, especially                    Pacific Oscillation) also have a significant effect on
      around Wellington and across the South Island.                           atmospheric pressure patterns across the country (e.g.
      However, they also stated that the projected increase in                 see NIWA, 2019), and therefore changes in weather and
      wind speeds was not expected to be large, but just a few                 fire dangers. These changes over seasonal, interannual
      percent (i.e. 60
Days of
Drought
Code >300
Days of
Initial
Spread Index
>10
No. of years/      59       54       56      28       54       46        41       56       28        56       27       58        41       55       58
period:
Maximum
BUI by
month for
period
Maximum DC
by month for
period
Highest ISI
per month
for the
period
Key                          Indicator     Each colour generally shows the movement between the cluster of years prior to 1999 compared with
                              spread       the 2000 to 2020 cluster of years.
Notable increase                     5     The BUI, DC and ISI referred to above are defined as:
Nominal increase                     17    1. The Build Up Index (BUI) is a numeric rating of the total amount of fuel available for combustion. It
                                               combines the Duff Moisture Code and the DC.
Overall no change                    34
                                           2. The Drought Code (DC) is a numeric rating of the average moisture content of deep, compact organic
Nominal decrease                     16        layers. This code is a useful indicator of seasonal drought effects on forest fuels and the amount of
                                               smouldering in deep duff layers and large logs.
Notable decrease                     18
                                           3. Initial Spread Index (ISI) is a numerical rating of the expected rate of fire spread. It combines the
                                     90        effects of wind and FFMC on rate of spread without the influence of variable quantities of fuel.

      16                                   NZ Journal of Forestry, February 2021, Vol. 65, No. 4
Professional papers

country that may be masking increases in fire dangers                                   of days with fuel available for combustion at an intense
due to the slower effects of climate change.                                            level – as indicated by elevated values of the BUI and
                                                                                        DC components of the NZFDRS – has remained the
      New Zealand’s climate is also very diverse, with
                                                                                        same or actually reduced since 2000 for almost all of the
significant differences in fire climate severity due to
microclimate effects associated with topography (Pearce                                 weather station locations analysed. Similarly, indicators
& Clifford, 2008; Scion, 2011a, 2011b). Findings from                                   of increased fire spread potential (based on the ISI
this study are based on only a small subset of stations                                 component of the NZFDRS) show even more widespread
that have the long-term records required for such                                       decreases. Along with the BUI and DC changes, this may
analyses. The analysis of trends in fire dangers is also                                be explained in part by changing wind patterns and
based on a relatively simple, principally qualitative and                               associated increases in rainfall along the Southern Alps
non-statistical assessment only, and there is a need for                                associated with natural seasonal climate variability, as
more robust analyses of whether changes are occurring.                                  well as longer-term climate change.
To this end, work is currently underway to update long-                                      Based on this study, involving up to 60 years of
term fire weather records (Pearce et al., 2003) for the                                 weather data for a range of locations across the country,
wider set of weather stations across the country. This                                  it will take a major swing in current weather patterns to
will provide a greater number of stations to undertake                                  suggest that the average annual frequency of elevated
more formal statistical analyses of changes over time                                   fire danger levels across New Zealand will increase
(e.g. Pearce & Whitmore, 2009), as well as comparisons                                  dramatically over the next 20 to 40 years.
between stations in the same regions (Pearce et al.,
2011) and links to fire climate drivers such as ENSO                                    Acknowledgements
and longer-term decadal variability (Heydenrych et
al., 2001; Pearce et al., 2007), and fire occurrence data                                    The authors would like to thank Fire and Emergency
(Anderson et al., 2008).                                                                New Zealand for the use of data contained within the Fire
                                                                                        Weather System. Provision of updated synoptic data from
Conclusions                                                                             2013 to 2020 for MetService stations by the Meteorological
                                                                                        Service of NZ is also gratefully acknowledged.
     The purpose of this study was to assess whether
values of fire danger ratings that indicate the fuel
                                                                                        References
availability to burn in forest and rural landscapes across
New Zealand have increased over the past 20 years                                       Alexander, M.E. 1992. Standard Specifications for Fire Weather
when compared with a similar period prior to 2000. The                                      Index System Computer Calculations. Paper prepared
NZFDRS provides a sound scientific basis for answering                                      for the 3rd Advisory Committee on Forest and Rural
this question, as well as supporting fire management                                        Fire Research held at the NZ Fire Service National
decision-making. What has emerged is that the number                                        Headquarters, Wellington, NZ, 21 October 1992.

 Actual number of days with BUI >60
140
120                             Taupo
                                Wanganui
100
                                Gisborne
 80                             Napier
 60
 40
 20
  0
      7

           8

                 9

                        0

                               1

                                         2

                                              3

                                                    4

                                                           5

                                                                  6

                                                                         7

                                                                                8

                                                                                       9

                                                                                              0

                                                                                                     1

                                                                                                            2

                                                                                                                   3

                                                                                                                          4

                                                                                                                                 5

                                                                                                                                        6

                                                                                                                                               7

                                                                                                                                                      8

                                                                                                                                                             9

                                                                                                                                                                    0
  –9

          –9

                 –9

                        –0

                               –0

                                      –0

                                             –0

                                                    –0

                                                           –0

                                                                  –0

                                                                         –0

                                                                                –0

                                                                                       –0

                                                                                              –1

                                                                                                     –1

                                                                                                            –1

                                                                                                                   –1

                                                                                                                          –1

                                                                                                                                 –1

                                                                                                                                        –1

                                                                                                                                               –1

                                                                                                                                                      –1

                                                                                                                                                             –1

                                                                                                                                                                    –2
96

        97

               98

                      99

                             00

                                    01

                                           02

                                                  03

                                                         04

                                                                05

                                                                       06

                                                                              07

                                                                                     08

                                                                                            09

                                                                                                   10

                                                                                                          11

                                                                                                                 12

                                                                                                                        13

                                                                                                                               14

                                                                                                                                      15

                                                                                                                                             16

                                                                                                                                                    17

                                                                                                                                                           18

                                                                                                                                                                  19

 Actual number of days with DC >300
250
                               Taupo
200                            Wanganui
                               Gisborne
150                            Napier

100

 50

  0
      97

           98

                 99

                        00

                               01

                                         02

                                              03

                                                    04

                                                           05

                                                                  06

                                                                         07

                                                                                08

                                                                                       09

                                                                                              10

                                                                                                     11

                                                                                                            12

                                                                                                                   13

                                                                                                                          14

                                                                                                                                 15

                                                                                                                                        16

                                                                                                                                               17

                                                                                                                                                      18

                                                                                                                                                             19

                                                                                                                                                                    20
    –

           –

                  –

                         –

                                –

                                       –

                                              –

                                                     –

                                                            –

                                                                   –

                                                                          –

                                                                                 –

                                                                                        –

                                                                                               –

                                                                                                      –

                                                                                                             –

                                                                                                                    –

                                                                                                                           –

                                                                                                                                  –

                                                                                                                                         –

                                                                                                                                                –

                                                                                                                                                       –

                                                                                                                                                              –

                                                                                                                                                                     –
 96

        97

               98

                      99

                             00

                                    01

                                           02

                                                  03

                                                         04

                                                                05

                                                                       06

                                                                              07

                                                                                     08

                                                                                            09

                                                                                                   10

                                                                                                          11

                                                                                                                 12

                                                                                                                        13

                                                                                                                               14

                                                                                                                                      15

                                                                                                                                             16

                                                                                                                                                    17

                                                                                                                                                           18

                                                                                                                                                                  19

Figure 4: Comparison of annual number of days with BUI greater than 60 (top) and DC greater than 300 (bottom) for the Taupo, Wanganui,
Gisborne and Napier stations

                                               NZ Journal of Forestry, February 2021, Vol. 65, No. 4                                                                    17
Remote sensing

Alexander, M.E. 2008. Proposed Revision of Fire Danger Class           Fuels (2nd Ed.). Christchurch, NZ: Scion Rural Fire
    Criteria for Forest and Rural Areas in New Zealand (2nd            Research Group.
    Ed.). National Rural Fire Authority, Wellington, NZ, in       Pearce, H.G. and Clifford, V. 2008. Fire Weather and
    association with the Scion Rural Fire Research Group,              Climate of New Zealand. New Zealand Journal of
    Christchurch, NZ.                                                  Forestry, 53(3): 13–18.
Anderson, S. 2005. Forest and Rural Fire Danger Rating in         Pearce, H.G., Douglas, K.L. and Moore, J.R. 2003. A Fire Danger
    New Zealand. In Colley, M. (Ed.), Forestry Handbook.               Climatology for New Zealand. Fire Service Commission
    Christchurch, NZ: New Zealand Institute of Forestry.               Research Report No. 39. Wellington, NZ: NZFSC.
Anderson, S.A.J. 2009. Future Options for Fire Behaviour          Pearce, H.G., Kerr, J., Clark, A., Mullan, B., Ackerley,
    Modelling and Fire Danger Rating in New Zealand.                   D., Carey-Smith, T. and Yang, E. 2011. Improved
    Proceedings of the Royal Society of Queensland, 115: 119–          Estimates of the Effect of Climate Change on NZ Fire
    127.                                                               Danger. MAF Technical Paper No. 2011/13. Wellington,
Anderson, S.A.J. and Anderson, W.R. 2009. Predicting the               NZ: Ministry of Agriculture & Forestry.
    Elevated Dead Fuel Moisture Content in Gorse (Ulex            Pearce, H.G., Mullan, A.B., Salinger, M.J., Opperman, T.W.,
    europaeus L.) Shrub Fuels. Canadian Journal of Forest              Woods, D. and Moore, J.R. 2005. Impact of Climate
    Research, 39(12): 2355–2368.                                       Change on Long-term Fire Danger. NZ Fire Service
Anderson, S.A.J., Doherty, J.J. and Pearce, H.G. 2008.                 Commission Research Report No. 50. Wellington, NZ:
    Wildfires in New Zealand from 1991 to 2007. New                    NZFSC.
    Zealand Journal of Forestry, 53(3): 19–22.                    Pearce, H.G., Salinger, J. and Renwick, J. 2007. Impact of
Chandler, C.C., Cheney, P., Thomas, P., Trabaud, L. and                Climate Variability on Fire Danger. NZ Fire Service
    Williams, P. 1983. Fire in Forestry, Volume 1: Forest Fire         Commission Research Report No. 72. Wellington, NZ:
    Behavior and Effects. New York, US: John Wiley and Sons.           NZFSC.
Fogarty, L.G., Pearce, H.G., Catchpole, W.R. and Alexander,       Pearce, H.G. and Whitmore, M.A. 2009. Analysis of
    M.E. 1998. Adoption vs. Adaptation: Lessons from                   Seasonal Trends in the Drought Code in New Zealand.
    Applying the Canadian Forest Fire Danger Rating                    Scion Client Report No. 12788. Christchurch, NZ: Scion
    System in New Zealand. In Viegas, D.X. (Ed.),                      Rural Fire Research Group.
    Proceedings, 3rd International Conference on Forest Fire      Scion. 2011a. Future Fire Danger. Rural Fire Research Update
    Research and 14th Fire and Forest Meteorology Conference.         9 (November 2011). Christchurch, NZ: Scion Rural
    Luso, Coimbra, Portugal, 16-20 November 1998.                     Fire Research Group.
Heydenrych, C., Salinger, J. and Renwick, J. 2001. Climate        Scion. 2011b. Fire Climate Severity. Rural Research Update
    and Severe Fire Seasons: A Report on Climatic Factors             8 (July 2011). Christchurch, NZ: Scion Rural Fire
    Contributing to Severe Fire Seasons in New Zealand.               Research Group.
    NZ Fire Service Commission Research Report No. 11.
                                                                  Stocks, B.J., Alexander, M.E., Van Wagner, C.E., McAlpine,
    Wellington, NZ: NZFSC.
                                                                      R.S., Lynham, T.J. and Dube, D.E. 1989. The Canadian
Meridian Energy. 2019. Meridian Climate Change Impacts                Forest Fire Danger Rating System: An Overview.
    on NZ Renewable Electricity Generation to 2050.                   Forestry Chronicle, 65: 450–457.
    Presentation to the Major Electricity User Group, May
                                                                  Taylor, S.W. and Alexander, M.E. 2006. Science, Technology
    2019. Wellington, NZ: Meridian Energy.
                                                                      and Human Factors in Fire Danger Rating: The
Merrill, D.F., Alexander and M.E. (Eds.). 1987. Glossary of           Canadian Experience. International Journal of Wildland
    Forest Fire Management Terms (4th Ed.). Publication               Fire, 15(1): 121–135.
    NRCC No. 26516. Ottawa: Ontario: National Research
                                                                  Valentine, J.M. 1978. Fire Danger Rating in New Zealand:
    Council of Canada, Canadian Committee on Forest
                                                                      Review and Evaluation. Forest Establishment Report No.
    Fire Management.
                                                                      123. Rotorua, NZ: New Zealand Forest Service, Forest
Ministry for the Environment (MfE). 2008. Climate Change              Research Institute.
    Effects and Impacts Assessment: A Guidance Manual
                                                                  Van Wagner, C.E. 1987. Development and Structure of the
    for Local Government in New Zealand (2nd Ed.).
                                                                      Canadian Forest Fire Weather Index System. Forestry
    Wellington, NZ: MfE.
                                                                      Technical Report 35. Ottawa, Ontario: Canadian
Mullan, B., Carey-Smith, T., Griffith, G., and Sood, A.               Forestry Service.
    2011. Scenarios of Storminess and Regional Wind
                                                                  Van Wagner, C.E. 1988. Note on the Use of the Canadian Forest
    Extremes Under Climate Change. NIWA Client Report
    WLG2010-31. Wellington, NZ: National Institute of                 Fire Weather Index System in Other Countries. Canadian
    Water and Atmospheric Research.                                   Forestry Service, Petawawa National Forestry Institute,
                                                                      Chalk River, Ontario. Unpublished filenote, April 1988.
National Rural Fire Authority (NRFA) and New Zealand
    Forest Research Institute (NZFRI). 1993. Fire Weather         Murray Dudfield is a Forest Fire Advisor and Chair of
    Index System Tables for New Zealand. NRFA, Wellington,        the NZIF Forest Fire Committee, H. Grant Pearce is with
    NZ, in association with NZFRI, Rotorua, NZ.                   the Scion Rural Fire Research Group, and Geoff Cameron
Pearce, H.G., Anderson, S.A.J. and Clifford, V.R. 2012. A         is a Forester and on the NZIF Forest Fire Committee.
     Manual for Predicting Fire Behaviour in New Zealand          Corresponding author: murrayd@supermail.co.nz

18                                  NZ Journal of Forestry, February 2021, Vol. 65, No. 4
You can also read