A Bit of Cohen Instead of Bitcoin - Robert Cohen Vice President & Portfolio Manager - Dynamic Funds
←
→
Page content transcription
If your browser does not render page correctly, please read the page content below
A Bit of Cohen Instead of Bitcoin
           Robert Cohen
           Vice President & Portfolio Manager

ADVISOR USE ONLY
Gold: What’s Driving the Price?

                       GOLD VS. USD       GOLD VS. 10 YR TIPS

    Source: Bloomberg, Murenbeeld & Co.
2   ADVISOR USE ONLY
Gold: Trade Balance is Dollar Negative

                             US GOODS TRADE BALANCE WITH WORLD

    Source: Bloomberg, Murenbeeld & Co.
3   ADVISOR USE ONLY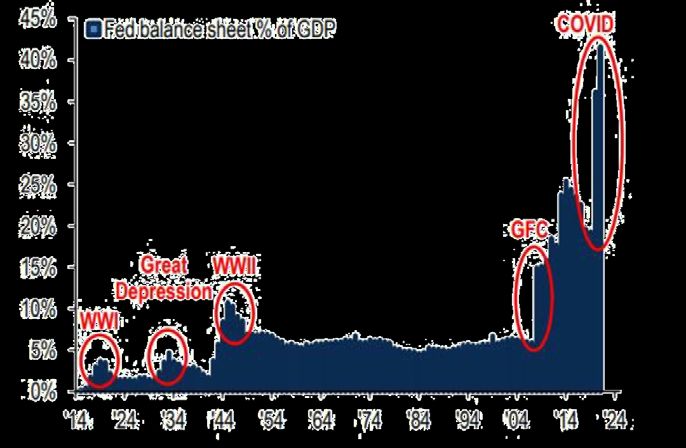
Gold: Monetary Policy at Full Torque

           M1 MONEY STOCK YOY CHANGE                                       FED BALANCE SHEET IS 42% OF GDP
    80%                                                           1
    70%                                                          70%
                                                                 0.9
    60%                                                           0.8
    50%                                                           0.7
    40%                                                           0.6
    30%                                                           0.5
    20%                                                           0.4
    10%                                                           0.3
     0%                                                           0.2
    -10%                                                          0.1
    -20%                                                          0

    Source: Federal Reserve Bank of St. Louis; BofA Global Research, GFD, Haver
4   ADVISOR USE ONLY
Gold: Debt Levels Supportive

                                           GOVERNMENT DEBT TO GDP

    Source: Murenbeeld & Co., IMF Fiscal Monitor, October 2020
5   ADVISOR USE ONLY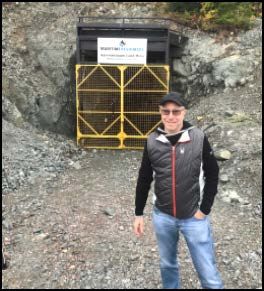
Bitcoin: No Intrinsic Value

6   ADVISOR USE ONLY
Investment Checklist
Quality of Assets
Quality of Management
QUARP®
7 ADVISOR USE ONLY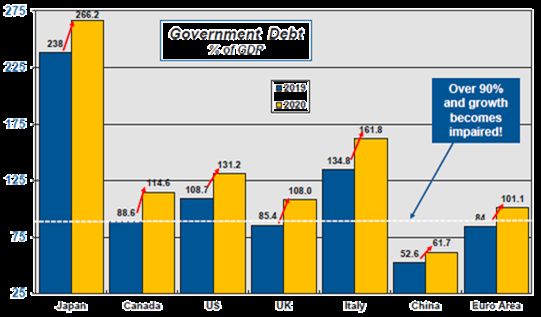
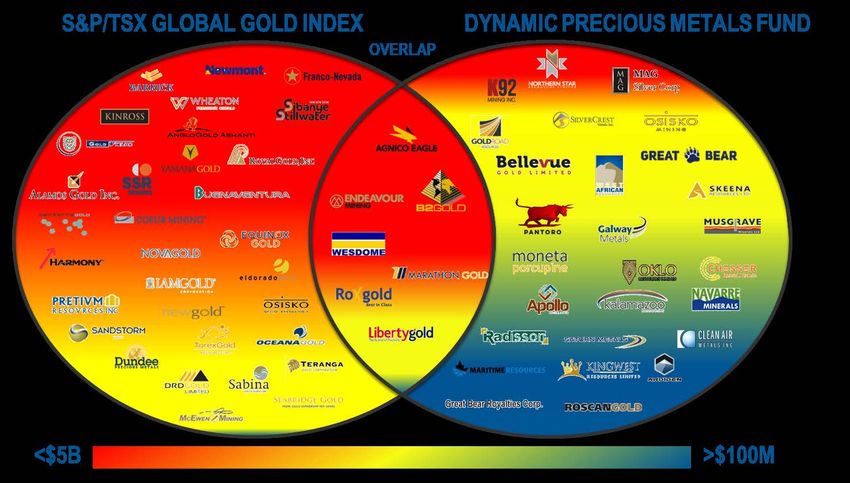
Our Process in Action:
     Core positions

                   NORTHERN STAR                                           BELLEVUE GOLD                                    GREAT BEAR RESOURCES
    $18                                                                                                          $20
                                                             $1.50
    $16                                                                                                          $18
                                                             $1.25                                               $16
    $14
                                                                                                                 $14
    $12                                                      $1.00
                                                                                                                 $12
    $10
                                                                                                                 $10
                                                             $0.75
     $8
                                                                                                                  $8
     $6                                                      $0.50                                                $6
     $4                                                                                                           $4
                                     Average Cost            $0.25
     $2                                 $1.11                                               Average Cost          $2                           Average Cost
                                                                                               $0.26                                              $3.28
     $0                                                      $0.00                                                $0
      Jan-13    Jul-14   Jan-16   Jul-17   Jan-19   Jul-20       Jan-17   Jan-18   Jan-19       Jan-20     Jan-21  Jan-18    Oct-18   Jul-19    Apr-20   Jan-21

          Source: Bloomberg

8     ADVISOR USE ONLY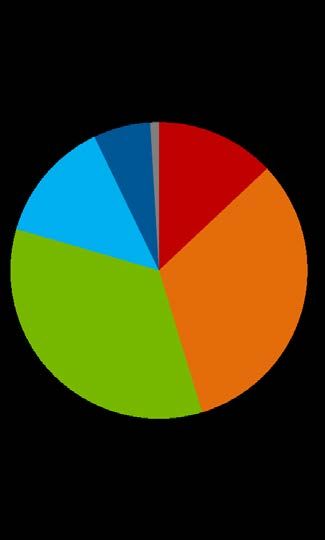
Our Process in Action:
    Exploration

                                      K92 MINING                                             SILVERCREST
                                                                         $16
                        $10

                         $9                                              $14

                         $8
                                                                         $12
                         $7
                                                                         $10
                         $6

                         $5                                               $8
                         $4
                                                                          $6        Average Cost
                         $3    Average Cost                                            $4.47
                                  $1.82                                   $4
                         $2

                         $1                                               $2
                         $0
                                                                          $0
                          Jan-17   Jan-18     Jan-19   Jan-20   Jan-21
                                                                           Oct-15   Oct-16    Oct-17   Oct-18   Oct-19   Oct-20

9   ADVISOR USE ONLY
Dynamic Precious Metals Fund
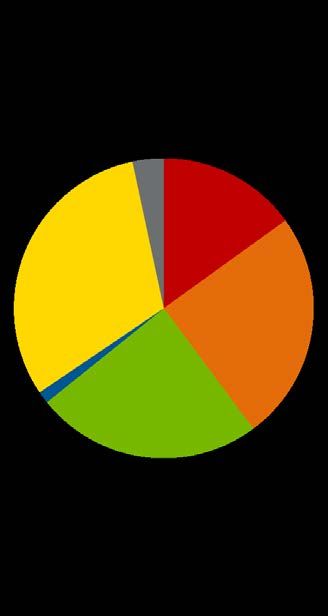
Portfolio construction
Focus of high quality production companies, advanced development companies and specific
exploration companies
High quality projects / strong management
Exposure to Australia is a key competitive advantage
COMPOSITION LISTING COUNTRY MARKET CAP
1%
Cash 7%
14%
37%
12%
43% AUD
56% Producers 63%
Exploration & CAD 34%
Development
32%
Source: Dynamic Funds, as of 1/31/2021
10 ADVISOR USE ONLYDynamic Precious Metals Fund
Active management matters
1832 Asset Management L.P., as of 06/30/20
11 ADVISOR USE ONLYDynamic Strategic Gold Class
Portfolio construction
Strategic mix of physical gold bullion and gold equities
Physical gold bullion is tactically hedged for currency
Very consolidated portfolio of production & development gold companies
Exposure to Australia is a key competitive advantage
COMPOSITION LISTING COUNTRY MARKET CAP
3% 2%
Cash 3%
Cash 15%
31% 31%
31% Gold
Gold 39% Gold 42%
Producers CAD 25%
27% 24%
Exploration & 1% 24%
AUD
Development
Source: Dynamic Funds, as of 1/31/2021
12 ADVISOR USE ONLYThe Team
Robert Cohen
BA Sc., MBA, CFA
Vice President & Portfolio Manager
• Over 28 years industry experience
• Mining & Mineral Process Engineer
• Joined Dynamic in 1998
Nawojka Wachowiak
M.Sc.
Associate Portfolio Manager
• Over 20 years of industry experience
• Geologist
• Research Analyst covering precious and
base metal companies
13 ADVISOR USE ONLYImportant information
ADVISOR USE ONLY.
This presentation has been prepared by 1832 Asset Management L.P and is provided for information purposes only.
Views expressed regarding a particular investment, economy, industry or market sector should not be considered an indication of trading intent of any of the
mutual funds managed by 1832 Asset Management LP. These views are not to be relied upon as investment advice nor should they be considered a
recommendation to buy or sell. These views are subject to change at any time based upon markets and other conditions, and we disclaim any responsibility to
update such views.
To the extent this document contains information or data obtained from third party sources, it is believed to be accurate and reliable as of the date of publication,
but 1832 Asset Management L.P. does not guarantee its accuracy or reliability. Nothing in this document is or should be relied upon as a promise or
representation as to the future.
© Copyright 2021 1832 Asset Management L.P. All rights reserved. Dynamic Funds® is a registered trademark of its owner, used under license, and a division of
1832 Asset Management L.P. ™Trademark of its owner, used under license.
Commissions, trailing commissions, management fees and expenses may be associated with mutual fund investments. Please read the prospectus before
investing. The indicated rates of return are the historical annual compounded total returns including changes in units value and reinvestment of all distributions and
do not take into account sales, redemption, distribution or optional charges or income taxes payable by any securityholder that would have reduced
returns. Mutual funds are not guaranteed, their values change frequently and past performance may not be repeated.
14 ADVISOR USE ONLYYou can also read