A Progress Paradox: If we have the safest food supply in the world
←
→
Page content transcription
If your browser does not render page correctly, please read the page content below

South Carolina Food Safety Task Force
Quarterly Meeting
10:00AM, September 07, 2021

              A Progress Paradox:
 If we have the safest food supply in the world,
          why am I working so hard??

                            Arthur P. Liang, MD, MPH
                          Senior Advisor for Food Safety
          Division of Foodborne Waterborne & Environmental Diseases
                     Centers for Disease Control & Prevention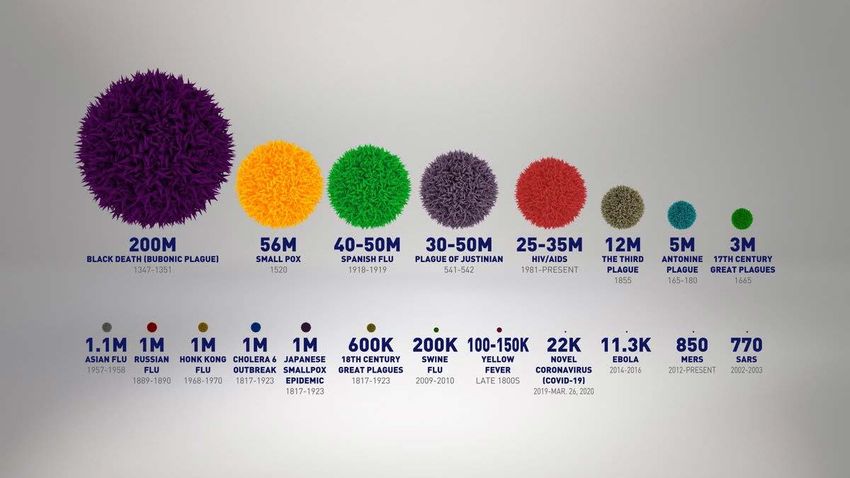
Disclosures / Disclaimers

 1.   Thank you to SCFSTF for invitation

 2.   No conflicts of interest to disclose

 3.   Findings & conclusions in this presentation are
      those of the author & do not represent the views
      of the Centers for Disease Control & Prevention

 4.   Speaker reserves the right to say something
      stupid, wrong or incredibly obvious.
Executive Summary:
          Food Safety Gets Better, Not Easier

•   ↓↓↓ Deaths since 1900

•   But foodborne illness still very common, because…

      •   Emerging Diseases (e.g., food allergy, E. coli O157:H7,
          Cyclospora)

      •   Technology: Genomics (e.g., DNA sequencing) &
          Information

      Can find a needle in a haystack
        for both public & private sectors.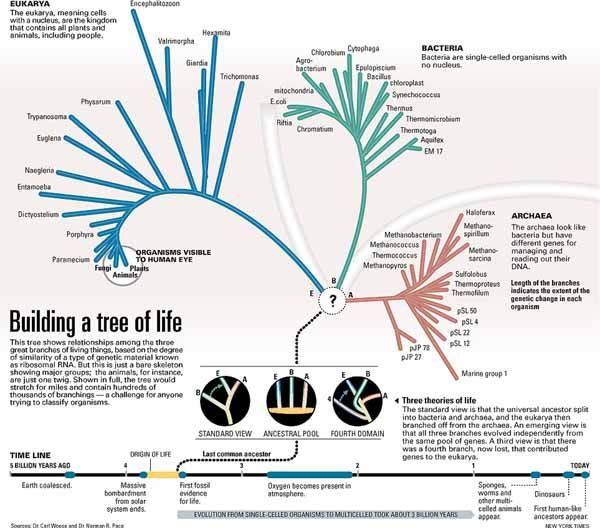
February 2016

E coli O157:H7

                      Salmonella serotype Enteritidis

                 Cyclospora
Technology: Years until used by 25% of American Population

Trends of “Fingerprinting” for Bacteria

                                                                                         WGS**
                                                                 PFGE (1984)      MLST
                                                                               MLVA
                                                                      REA
                                                                            AFLP MBMS*
                                                             MEE
                     Phage typing                        Ribotyping         RAPD
 Serotyping                                        Plasmid profiles

                                Bacteriocin typing

   1920                 1940                 1960                1980           2000
* Microarray-based multi-target sequencing
  ** Whole Genome Sequencing

                                       Source: Efrain M. Ribot, CDC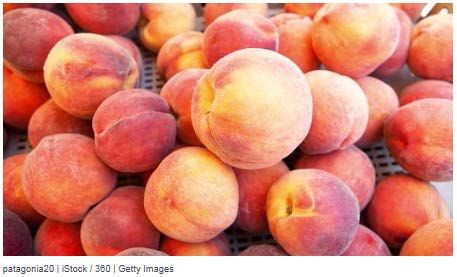
Listeria Outbreaks & Incidence, 1983-2013           Incidence
No. outbreaks                                                       (per million pop)

       Era           Pre-PulseNet   Early PulseNet   Listeria Initiative
Outbreaks per year        0.3             2.3                2.9
Median cases per          69              11                 5.5
    outbreak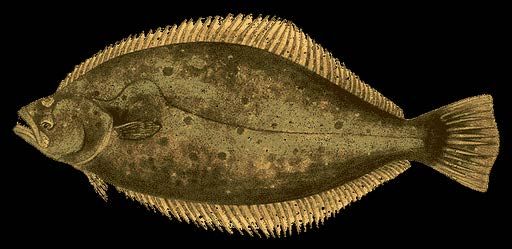
Listeria Outbreaks & Incidence, 1983-2014           Incidence
No. outbreaks                                                       (per million pop)

       Era           Pre-PulseNet   Early PulseNet   Listeria Initiative    WGS
Outbreaks per year        0.3             2.3                2.9              8
Median cases per          69              11                 5.5             4.5
    outbreak
Era of Whole Genome Sequencing:
  Listeriosis Outbreaks & Incidence*, 1983-2016
 No. outbreaks                                                                               Incidence (per million pop)
 10                                                                                                                     9
                                                                                      Outbreaks
   9                                                                                                                    8
                                                                                      Incidence
   8                                                                                                                    7
   7
                                                                                                                              6
   6
                                                                                                                              5
   5
                                                                                                                              4
   4
                                                                                                                              3
   3
   2                                                                                                                          2
   1                                                                                                                          1
   0                                                                                                                          0
       1983   1985   1987   1989   1991   1993   1995   1997   1999   2001   2003   2005   2007   2009   2011   2013   2015

Era                Pre-PulseNet                                Early PulseNet         Listeria Initiative              WGS
Outbreaks per year      0.3                                          2.3                      2.6                      6.3
Median cases per        69                                           11                       5.5                       4
outbreak

*2016 incidence rate preliminary data from FoodNet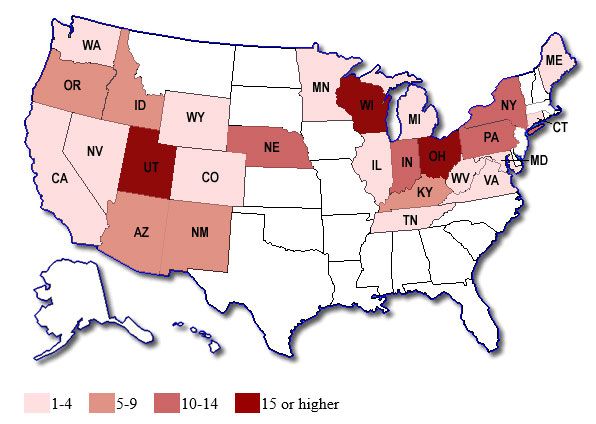
“Safest food supply in the world?”
  Leading causes of death annually from Foodborne illness &
                    unintentional injuries
        Tobacco                                                                                                     467000
         Obesity                                                     216000
         Alcohol                        64000
       Poisoning                36280
   Motor vehicle                33783
             Fall              27483
       Drowning         3556
Foodborne illness       3000
       Fire/burn        2813
  Natural diaster       2193
      Machinery         610
         Firearm        591
          Cycling       272
 Cutting/piercing       110

                    0          50000      100000   150000   200000     250000   300000   350000   400000   450000     500000
                                                               # of deaths

             Timothy Lytton’s Outbreak: Foodborne Illness & the Struggle for Food Safety (2019)
“Safest food supply in the world?”
Foodborne illness & leading causes of nonfatal injuries
Foodborne illness 48000000
Fall 11910000
Motor vehicle 2775000
Cutting/piercing 2559000
Natural diaster 1427000
Cycling 553000
Poisoning 456000
Fire/burn 442000
Machinery 364000
0 10000000 20000000 30000000 40000000 50000000 60000000
# of cases
Timothy Lytton’s Outbreak: Foodborne Illness & the Struggle for Food Safety (2019)“Safest food supply in the world?” 1. ↓↓↓ Mortality since 1900 2. Since 1990s, ↓ Campylobacter, Listeria, E coli O157 & Yersinia infections 3. Little change in Salmonella. ↓ % caused by food. 4. ↓↓ Hepatitis A since 1950. 5. Vibrio increasing, but rare. 6. ↓ Norovirus % caused by food. Can grow in tissue culture
How Food Safety Gets Better…
                                              Infectious Disease Mortality, United States, 1900-1996
                                       1000
          Mortality Rate per 100,000

                                       800

                                       600

                                       400

                                       200

                                         0
                                         1900        1920        1940         1960        1980
Armstrong et al, JAMA 1999                                            Year
HACCP Crude Pathogen rates per 100,000
Rule, 1996 FoodNet 1996-2017
25
Since 1996-1998
20 ↓E. coli O157
Campylobacter
Salmonella ↓Campylobacter
↓Listeria
15 ↓Yersinia
±Salmonella
10 ↑Vibrio
5
Cryptosporidium
E.coli
Cyclospora Vibrio
Listeria Yersinia
0
96
97
98
99
00
01
02
03
04
05
06
07
08
09
10
11
12
13
14
15
16
17
19
19
19
19
20
20
20
20
20
20
20
20
20
20
20
20
20
20
20
20
20
20
http://www.cdc.gov/foodnet/index.htmlIncidence of Hepatitis A, United States, 1952-2018
Gamma globulin
45
recommended in CCDM
40
35
Rate per 100,000
30
2016: 2,007 reported cases
25
2017: 3,366
2018: 12,474
20
15
10
5
Vaccine
Licensed
0
1952 56 60 64 68 72 76 80 84 88 92 96 2000 4 8 12 16
Year
1952 2018
Source: National Notifiable Disease Surveillance System, CDCHypotheses for why you are working so hard
1. Safe because you are working hard.
2. Emerging Diseases (e.g., food allergy, E coli O157, cyclosporiasis)
3. Genomics (e.g., DNA sequencing) & Information Technology:
Accelerating pace of changeHypothesis: “Safe because you are working hard”
“…In 2011, the FDA inspected 19,073 domestic food facilities
& 995 foreign food facilities…
“The USDA maintained inspectors in 6000 domestic food
facilities…
“…The State governments also conducted thousands
of…inspections…
“…9 leading private food safety audit firms…conducted…
> 200,000 audits & inspections in
> 100 countries each year…”
Source: Timothy Lytton’s Outbreak: Foodborne Illness & the Struggle for Food SafetyHypothesis: Emerging Infectious Diseases:
“Prediction is very difficult, esp. about the future.”
It is “time to close the book” on the problem of infectious diseases.
William H. Stewart, MD, U.S. Surgeon General, 1969-73
“The future of infectious diseases will be very dull.”(1972)
Macfarlane Burnet, 1960 Nobel Prize Winner In Physiology/Medicine
Told students that there were “no new diseases to be discovered.” (1976)
Lewis Thomas, Dean Yale Medical School
Source: JL Swerdlow & AD Johnson, “Living with Microbes,” The Wilson Quarterly, Spring 2002Ernst Haeckel (1834 – 1919) Tree of Life
Carl Woese (1928 – 2012) Tree of Life
Homo sapiens (Latin: "wise man")

  •Microbes appear 3.5 Billion years ago
  •Man appears 130,000 years ago in Africa

https://biomimicry.net/earths-calendar-year-4-5-billion-years-compressed-into-12-months/
Hypothesis: Emerging Infectious Diseases
                             Pandemics through history

                                                                                                                 Sept 2021

https://www.alaskasnewssource.com/content/news/Pandemics-through-history-What-we-can-learn-&-how-it-relates-to-COVID-19-569147331.html
Emerging Infectious Diseases:
The fall & rise of reported Salmonella infections in the
United States, 1920-2016
Typhoid Fever Non-typhoid Salmonellosis
50
Incidence per 100,000 population
45 Water & sewage Concentrated agriculture
treatment systems built
40
Globalized food supply
35 Oysterbeds regulated
30
25
20
15
10
5
0
Years
CDC, National surveillance data 2002-15: http://www.cdc.gov/mmwr/preview/mmwrhtml/mm6153a1.htm
2016: at CDC WONDEREmerging Infectious Diseases:
Foodborne Disease: 1939 vs 2011*
– Amoebiasis 1. Norovirus (1972)
– Botulism 2. Salmonella
– Brucellosis 3. Clostridium perfringens
– Cholera 4. Campylobacter (1972)
– Hepatitis 5. Staphylococcal
– Polio
6. Shigella
– Salmonellosis
7. E Coli O157 etc (1980s)
– Scarlet fever (streptococcus)
– Septic sore throat 8. Yersinia enterocolitica (1976)
(Strep zooepidemicus) 9. Toxoplasma gondii (1970)
– Staphylococcal food poisoning
10. Giardia (1981)
– Tapeworms
– Trichinosis Listeria (1982)
– Tuberculosis, bovine Cyclospora (1996)
– Typhoid fever vCJD/BSE (1996)
* Scallan et al, 2011Kudoa septempunctata,
Novel Food-Borne Outbreaks Caused by Consumption of Raw Olive Flounder
Symptoms -- vomiting & diarrhea -- typically begin 2 to 20 hours after eating
Harada T, Kawai T, Jinnai M, Ohnishi T, Sugita-Konishi Y, Kumeda Y., J Clin Microbiol. 2012 Sep;50(9):2964-8.Hypothesis: Finding a needle in a haystack Genomics & Information Technology: Epidemiology Customer complaints Laboratory-confirmed case reports
Accelerating pace of change…
1854
• Era of Classical
                                                               2014
  Epidemiology &
                                    1940’s                     • Genome
  Microbiology                      • Phage typing               Sequencing Era

                     1920’s                           1998
                     • Serotyping                     • PulseNet
                                                        (PFGE) Era

                                                     John Snow (1813 – 1858)
Crude Pathogen rates per 100,000, FoodNet 1996-2016
3 Since 1996-1998
↓E. coli O157
↓Listeria
↓Yersinia
2
↑Vibrio
E.coli
1
Yersinia
Vibrio
Listeria
Cyclospora
0
96
97
98
99
00
01
02
03
04
05
06
07
08
09
10
11
12
13
14
15
16
19
19
19
19
20
20
20
20
20
20
20
20
20
20
20
20
20
20
20
20
20
http://www.cdc.gov/foodnet/index.htmlNumber & Types of Culture-independent Diagnostic Tests
Are Increasing
Antigen-based tests
2011 (FDA approved)
•3 tests for Campylobacter
•2 tests for Shiga toxin
Antigen-based tests Laboratory-developed tests Syndrome panels
(FDA approved) (not FDA approved) (FDA approved)
2016 •3 tests for Campylobacter
•5 tests for Shiga toxin
•Molecular detection (PCR)
tests for single or multiple
• Luminex
• ProGastro SSCS
• BD Max
pathogens • BioFire
• NanosphereWGS detects more outbreaks than by PFGE
Number of Salmonella outbreaks detected with laboratory data
Public Health Agency of Canada
120
100
Enteritidis
80 Heidelberg
Typhimurium
60
40
20
0
2012 2013 2014 Year 2015 2016 2017
WGS
Courtesy C. Nadon, Public Health Agency of CanadaEra of Classical Epidemiology & Microbiology • How do we know it’s food? Outbreak investigation • “Clustering in TIME and SPACE” Large number of cases in one jurisdiction – Detected by affected group – Local investigation – Local food handling error (s) – Local solution
E. Coli O157:H7 Washington State 1993

                             January 12
           A pediatric gastroenterologist notified the
           Washington State Dept of Health of increase in
           emergency dept visits for bloody diarrhea & the
           hospitalization of 3 children with hemolytic
           uremic syndrome.
Compare exposures of ill & well persons
Case - Control Study
Calculate Relative Risk or Odds Ratio
Ate Chain A Did not eat
Total
hamburger hamburger
Sick 27 (73%) 10 37
Well 0 (0%) 16 16
matched odds ratio (mOR) = undefined; 95% confidence limit = 3.5 to ∞
Relative Risk = 1 No Association
Relative Risk < 1 Negative Association
Relative Risk > 1 Positive AssociationE. Coli 0157:H7 WA State 1993
by date of exposure*
*cases who ate a JIB
hamburger on a single day
US & primary
80
culture-confirmed
cases = 333
70
60 Improved
cooking temps
Number
50
40 first
report
30 Public
alert
T J Barrett, CDC retired
20
10
0
1 2 3 4 5 6 7 8 9 10 11 12 13 14 15 16 17 18 19 20 21 22 23 24
JanuaryPulseNet Era: circa 1996
Pulsed-field gel electrophoresis (PFGE) makes “invisible” outbreaks visible
Romesh Gautom
Paul & Luc
Vauterin
Bala Swaminathan, CDC retiredPulseNet Era: circa 1996 - 2014 • “Clustering in TIME, not SPACE” • Small numbers of cases in many jurisdictions • Detected by lab-based subtype surveillance • Multistate / Country Multi-disciplinary investigation • More challenging to investigate • Higher stakes?
Isolates of Salmonella Newport Reported to PulseNet
                      2002-2006

                     700
Number of Isolates

                     600
                     500
                     400
                     300
                     200
                     100
                      0
                       n

                                         n

                                                           n

                                                                             n

                                                                                               n
                                   p

                                                     p

                                                                       p

                                                                                         p

                                                                                                           p
                            ay

                                              ay

                                                                ay

                                                                                  ay

                                                                                                    ay
                     Ja

                                       Ja

                                                         Ja

                                                                           Ja

                                                                                             Ja
                                 Se

                                                   Se

                                                                     Se

                                                                                       Se

                                                                                                         Se
                           M

                                             M

                                                               M

                                                                                 M

                                                                                                   M
                            2002               2003              2004              2005             2006

                                                    Month reported to PulseNet
Isolates of Salmonella Newport Reported to PulseNet
2002-2006
All S. Newport
S. Newport Pattern A
700
600
Number of Isolates
500
400
300
200
100
0
n
n
n
n
n
p
p
p
p
p
ay
ay
ay
ay
ay
Ja
Ja
Ja
Ja
Ja
Se
Se
Se
Se
Se
M
M
M
M
M
2002 2003 2004 2005 2006
Month reported to PulseNetPersons infected with the outbreak strain of E. coli O157:H7,
by state of residence, as of October 6, 2006 (n=199)PulseNet increased the number of multistate
foodborne outbreaks reported to CDC: 1973-2010
2.9% of the outbreaks reported between 2010-2015 were multistate.
PulseNet beginsIdentifying New Vehicles in Multistate Outbreaks
38 new vehicles identified since 2006
1. Bagged spinach 17. Pine nuts 33. Frozen, packaged vegetables
2. Carrot juice 18. Par-cooked, broiled chicken 34. Fresh stone fruit
livers
3. Peanut butter 35. Fresh frozen & dried coconut
19. Scraped tuna
4. Broccoli powder on a snack food 36. Kratom powder
20. Cashew cheese
5. Dog food 37. Puppies (zoonotic contact)
21. Bearded dragons (zoonotic
6. Pot pies/frozen meals contact) 38. Bison
7. Canned hot dog chili sauce 22. Sugar cane juice
8. Fresh hot chili peppers 23. Sprouted chia seeds
9. Black pepper 24. Almond butter
10. Tahini sesame paste 25. Caramel apples
11. Raw cookie dough 26. Sprouted nut butters
12. Aquatic water frogs (zoonotic 27. Dried mushrooms (in truffle oil
contact) puree)
13. Fresh papaya 28. Crested geckos (zoonotic
14. Frozen mamay fruit pulp contact)
15. Bologna 29. Pistachios
16. In-shell hazelnuts 30. Wheat flour
31. Powdered meal supplements
32. Soy nut butterChange in the standard of proof:
Multi-national, multi-disciplinary, multi-agency teams
Epidemiology Supply chain
Statistics & Mapping
“Shoe leather” Traceback
Food
Clinical Environmental
investigations
Environmental
MicrobiologyGenome Sequencing Era
In 1995, the Hubble Space Telescope found distant galaxies & star clusters never
seen before.
Both TIME and SPACE
abolished!Seeing things we haven’t seen before…
o Recall trigger outbreak investigation
• Instead of vice versa
o REP strains, “never-ending” outbreak?
• “Outbreaks” are a “continuous variable”
o Outbreaks without a “pump handle”
o Definition of an outbreak?
• Future foodborne outbreaks more likely to be:
“More dispersed & smaller: ‘low & slow’…Compared to what?
Outbreak of Salmonella Serotype Agona Infections Linked to Toasted Oats Cereal --
United States, April-May, 1998
Recall
100
# of reported cases
80
60
40
20
0
35
38
41
44
47
50
10
13
16
19
22
25
28
31
34
1
4
7
Weeks in 1997 / 1998Recall triggers
Outbreak of Listeriosis Linked to Recalled Stone Fruit
• July 2014 recall receives extensive media coverage
• Many inquiries to CDC FDA & health depts from concerned clinicians & public
• Many of whom had received automated telephone calls informing them that they had
purchased recalled fruit.
• During July 19–31, the CDC Listeria website received >500,000 page views
• Stone fruit isolates obtained from company
– 4 human isolates in 2014 with PFGE match
– Patient 1 ate recalled nectarines & peaches
– Patient 2 ate peaches, possibly recalled
ones
– Patient 3 did not eat recalled fruits
– Patient 4; no exposure information available“Never ending outbreak?
Dynamic Designation of Strains:
Salmonella Reading Associated with Turkey Products
Outbreak Investigation
Persisting
Emerging?Outbreaks without a “pump handle”
Reoccurring O157 Outbreaks with the Same Strain
Linked to California-Grown Lettuce
2019 outbreak
• 167 U.S. cases
• 4 Canada cases
140 • Vehicle: romaine
2018 outbreak lettuce (Salinas,
120 • 62 U.S. cases CA)
• 29 Canada cases • Outbreak strain
• Vehicle: romaine found in unopened
Number of People
100
lettuce (Central romaine bags
80 Coast, CA)
2017 outbreak • Outbreak strain
60
• 25 U.S. cases found in ag water
2016 outbreak reservoir
• 42 Canada cases
40 • 20 U.S. cases
• Vehicle: leafy
• Vehicle: unknown
20 greens (suspected)
0
Jan Mar May Jul Sep Nov Jan Mar May Jul Sep Nov Jan Mar May Jul Sep Nov Jan Mar May Jul Sep Nov Jan Mar May Jul Sep Nov
2016 2017 2018 2019 2020
These data are preliminary and subject to changeDefinition of an outbreak?
…when TIME and SPACE have been abolished
Listeriosis linked to ice cream Listeriosis linked to soft cheeses Listeriosis linked to frozen vegetables
• 10 cases over 5 years (2015) • 30 cases over 5+ years (2015) • 9 cases over 3 years (2016)
Salmonella Reading infections linked to turkey products Salmonella Infantis infections linked to chicken products
• 358 cases over 17 months (2018) • 129 cases over 13 months (2018)Defining R. E. P. Strains (Draft)
Definitions focus on how the strain presents in humans
– Reoccurring strain: strain that periodically causes a substantial number of
illnesses, typically in outbreaks, separated by periods when it is not isolated
from people or it causes very few illnesses
– Emerging strain: strain that causes illnesses that have increased in frequency,
or have the potential to increase in frequency, over time
– Persisting strain: strain that causes illnesses consistently over time, although
the frequency of illnesses may fluctuate
Strains may also reoccur, emerge, or persist in the environment, in animals, or in
production facilities, but not cause human illness
– These also may be important to monitor as “warning signs” of potential
human health problems# of cases
19
0
20
40
60
80
100
120
140
-A
21 ug
-A
23 ug
-A
u
25 g
-A
27 ug
-A
29 ug
-A
31 ug
-A
ug
2-
Se
p
4-
Se
p
6-
Se
p
8-
Se
10 p
-S
e
12 p
-S
e
Pump
14 p
handle
-S
e
removed
16 p
-S
e
18 p
-S
e
20 p
-S
e
22 p
-S
e
24 p
-S
e
26 p
-S
e
Golden Square area, London
28 p
-S
e
30 p
-S
August 19 – September 30, 1854 (n=616)
epEpidemic Cholera Mortality, London,
1831- 1893
London Sewer London Sewer
14,137 opens 1865 complete ~1875
14,000
12,000
10,738 Sir Joseph Bazalgette
10,000
# of Deaths
8,000
6,536
6,000 5596
4,000
2,000 616 dead
Broad St
Outbreak 135
0
1831-32 1848-49 1853–4 1866 1893
YearUniverse = 95% dark matter / energy
% of illnesses due to recognized outbreaks, FoodNet, 1996-2017
• Campylobacter:Thank you
Emerging infectious Diseases:
“…in this place it takes all the running you can do, to
keep in the same place.“
- Red Queen to Alice in Through the Looking Glass
Whole Genome Sequencing:
“…Fasten your seatbelts, its going to be a bumpy night!“
- Margo Channing (Bette Davis) All About Eve, 1950You can also read