A Research Study on Logistic and E-Commerce of Amazon and Flip-kart
←
→
Page content transcription
If your browser does not render page correctly, please read the page content below
International Journal of Advanced Science and Technology
                                                                               Vol. 29, No. 06, (2020), pp. 1917-1931

      A Research Study on Logistic and E-Commerce of Amazon and Flip-kart

    Jeperson Hutahaean1, Rahul B. Chauhan2, Sameer Ahmed S. Shah3, Andino Maseleno4, Apri
                                                Wahyudi5
                                    1
                                      STMIK Royal Kisaran, Indonesia
    2
      Assistant Professor, Parul Institute of Business Administration, Parul University, Vadodara,
                                 India. Email: rj88chauhan@gmail.com
                   3
                     Research Scholar, India. Email: shahsameer00007@gmail.com
                               4
                                 STMIK Pringsewu, Lampung, Indonesia.
                                 5
                                   STIT Pringsewu, Lampung, Indonesia.

                                                   Abstract

  With the increasing globalization and shift in economic dominance towards southern hemisphere from the
  northern hemisphere in recent times, the Reverse Logistics industry has already reached at $12 billion,
  revealed a research by Reverse Logistics Company (RLC) during a discussion on the theme of ‘After
  Market Service – The New Focus of Reverse Logistics’, organized by the Confederation of Indian
  Industry Institute of Logistics. The logistics industry is poised to gain attention and importance in the
  coming days, believe the industry captains. Mr. Cyrus Guzder (Chairman, CII-IL Advisory Council &
  CMD, AFL Private Limited) said, “Keeping the supply chain efficient and affordable is a challenge. The
  logistics industry contributes about 13 per cent of GDP which is very significant but still there is a long
  way to go for the industry. The logistics industry needs to think deeply about the challenges.” The
  industry is believed yet to be at the nascent stage as only 10 per cent of sales in India take place through
  organized channel. Mr. P. Sreevathsa (Founder, The Service Solutions), about the challenges, said, “The
  industry needs to look at how a service provider can satisfy the manufacturer and in return the customer
  and end-consumer. Reverse Logistics is a big and emerging opportunity for the industry players in
  India.”

  Key Words: Logistic, Supply chain Management, E-commerce

  INTRODUCTION

  Reverse Logistics in India is a perfect platform for the entire Reverse Logistics ecosystem to come
  together to search for new partners, new ideas and learn from the market leaders about their experiences.
  Mr. Gopalkrishnan V K (Member, CII-IL Advisory Council & Vice President, Genpect) on the theme of
  the discussion said, “Service organizations are struggling to transform from cost to profit centers.

  To enhance the service profitability, the service organizations need to optimize cost to services, increase
  customer satisfaction and at the same time also drive service revenue. “

  A research paper on ‘Reverse Logistics’ was released on the occasion and among other dignitaries present
  were Mr. Sunil Kumar (Director – SCM, Oracle) and Mr. Nithin Chandra (Principal, A.T.Kearney), Mr.
  Bharat Malik (Head-Service, Micromax India and International) and Mr. Sushil Rathi (Vice President,
  Mahindra Logistics). The Service Solutions was the Knowledge Partner of the conference.

ISSN: 2005-4238 IJAST
Copyright ⓒ 2020 SERSC
                                                                                                              1917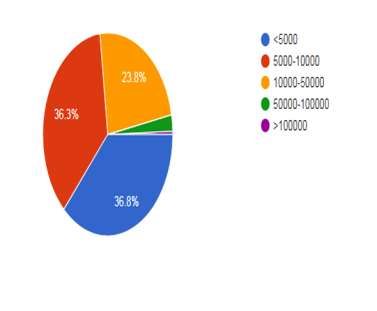
International Journal of Advanced Science and Technology
                                                                                Vol. 29, No. 06, (2020), pp. 1917-1931

  Product or Service Alliances

  Flipkart

  Flipkart has launched its own product range under the name “digiflip”, Flipkart also recently launched its
  own range of personal healthcare and home appliances under the brand “citron”. During its initial years,
  Flipkart focused only on books, and soon as it expanded, it started offering other products like electronic
  goods, air conditioners, air coolers, stationery supplies and life style products and e-books. Legally,
  Flipkart is not an Indian company since it is registered in Singapore and majority of its shareholders are
  foreigners. Because foreign companies are not allowed to do multi-brand e-retailing in India, Flipkart
  sells goods in India through a company called ws retail.

  Other third-party sellers or companies can also sell goods through the Flipkart platform. Flipkart now
  employs more than 15000 people. Flipkart allows payment methods such as cash on delivery, credit or
  debit card transactions, net banking, e-gift voucher and card swipe on delivery. Flipkart is presently one
  of the largest online retailers in India, present across more than 14 product categories & with a reach in
  around 150 cities and delivering 5 million shipments per month.

  Amazon

  Amazon is the largest internet based company in the United States. Amazon.com started as an online
  bookstore, but soon diversified, selling dvds, vhss, cds, video and mp3downloads/streaming, software,
  video games, electronics, apparel, furniture, food, toys, and jewelry. The company also produces
  consumer electronics notably, kindle, fire tablets, fire tv and phone and is a major provider of cloud
  computing services.

  Amazon has separate retail websites for united states, united kingdom & ireland, france, canada, germany,
  the netherlands, italy, spain, australia, brazil, japan, china, India and mexico, with sites for sri lanka and
  south east asian countries coming soon. Amazon also offers international shipping to certain other
  countries for some of its products.

  In the year 2011, it had professed an intention to launch its websites in poland, and sweden. In early june
  2013, Amazon.com had launched their Amazon India marketplace without any marketing campaigns. In
  july, 2013, Amazon had announced to invest $2 billion (rs 12,000 crores) in India to expand business,
  after its largest Indian rival Flipkart too had announced to invest$1 billion.

  Exclusive Products
  The Amazon kindle is a series of e-readers designed and marketed by Amazon.com. Amazon kindle
  devices enable users to browse, buy, download and read e-books, newspapers, magazines and other digital
  media via wireless networking to the kindle store. The hardware platform, developed by Amazon
  subsidiary lab126, began as a single device and now comprises a range of devices, including e-readers
  with e ink electronic paper displays, and android-based tablets with color lcd screens.

  All kindle devices integrate with the kindle store to acquire content and as of february 2016, the store has
  over 4.3 million e-books available in the us. The oneplus one launched as an Amazon exclusive in India
  last year, but now the device is available for purchase on rival e-commerce store Flipkart. Moto g (gen 4)
  and moto g plus (gen 4) will be available exclusively on Amazon.

  Logistics

  Speed of delivery is as important as the product quality for a customer. It would not be wrong to say that
  logistics could be the defining factor for success of e-commerce companies in retaining their customers.
  Indian logistics market itself is estimated to grow at a cagr of 12.17 per cent by 2020. Innovations are

ISSN: 2005-4238 IJAST
Copyright ⓒ 2020 SERSC
                                                                                                               1918
International Journal of Advanced Science and Technology
                                                                                Vol. 29, No. 06, (2020), pp. 1917-1931

  very important in this sector, as the demand is always for more reach and faster shipping at lower costs.
  Yet, the companies will need to invest in automation, while utilizing existing resources well.

  LOGISTIC PARTNER

  Cloudtail India pvt. Ltd, a joint venture between Amazon.com inc. And n.r. Narayana murthy’s catamaran
  ventures, has become the biggest seller or merchant on Amazon India’s platform, underlining how the
  world’s largest online retailer has used loopholes in the law to deploy a mix of the marketplace and the
  direct-selling business model in India. Cloudtail is now the key growth driver for Amazon India,
  generating at least 40% of the company’s sales in some months, three people familiar with the matter
  said. Cloudtail is particularly dominant in electronics and fashion sales, two of the three largest categories
  for Amazon India (promoted by Amazon seller services pvt. Ltd). Since it launched as a seller on Amazon
  in july 2014, cloudtail has expanded aggressively. Its capital was increased to rs.500 crore last month
  from just rs.500, 000 last july, according to documents available with the registrar of companies (roc).
  The equity capital has been pumped in jointly by Amazon asia and catamaran through an entity called
  prione business services pvt. Ltd. Apart from the rs.500 crore in equity capital, cloudtail has access to
  secured loans totaling rs.300 crore, roc documents show. Atsl will be one of the logistics partners for
  Amazon's Indian marketplace.

  PROCEDURE

  Amazon has set up a logistics company in India to deliver products directly to consumers, opening a new
  front in the battle for top honours in the country's fast-growing online retail industry. Amazon
  transportation services private limited, a subsidiary of us-based Amazon, will ship goods from sellers who
  transact on the company's online marketplace in India. Such a service is already on offer from Flipkart
  through logistics company ekart, and snapdeal, which bought a stake in delivery firm gojavas last week.
  The logistics arm has been set up to aid in last- mile delivery as products can be shipped faster. Amazon
  currently operates nine fulfilment centres, ecommerce jargon for warehouses, in eight Indian states. It was
  the first online marketplace to offer two-day and one-day guaranteed delivery in India, a norm in the us
  market. Amazon India also recently launched easyship, an assisted shipping platform for 12,000 out of its
  20,000 sellers, a platform which the company has now taken global. With easyship, our sellers can now
  choose their courier partners, and ship even on the same day.

  More than 60% of our customers are eligible for next-day shipping on products fulfilled by Amazon.
  Amazon has struggled with deliveries in cities where snarl-ups are frequent and road signs unreliable. In
  response, firms have set up logistics networks and use motorbikes instead of trucks. Another service
  introduced in India in may and considered for export to other markets, seller flex, allows sellers to have
  the flexibility to store goods and ship them to customers on their own, instead of routing them through
  Amazon.

  Amazon provides technology and training to ensure goods are packed, labelled and delivered as the
  company would. While Amazon in developed markets may not want to tweak its model for best selling
  goods, analysts said, it could consider the made-in- India seller solution to cut down on warehousing and
  delivery costs for thousands of “non-core” products which are offered, but infrequently bought. “Amazon
  is becoming a lot more flexible about how it services its customers.

  LITERATURE REVIEW

  Prior studies related to the distribution network for e-commerce mostly focus on the “last mile problem”,
  including optimization problems on network design, transfer processes, location-inventory, or routing
  problem (Mofidi, 2018). To be specific, the location-inventory problem is to find the best locations for

ISSN: 2005-4238 IJAST
Copyright ⓒ 2020 SERSC
                                                                                                               1919
International Journal of Advanced Science and Technology
Vol. 29, No. 06, (2020), pp. 1917-1931
setting up distribution centers (DCs) in order to deliver products to customers according to the provided
plan with the minimal transportation as well as stocking costs (Arabzad, 2015)The classic location-
inventory model explored in the literature aims to find the optimal quantity and warehouse location under
given locations of suppliers. A more detailed review can be found in (Farahani. R. Z., 2015). The problem
explored in this paper, which focuses on service capacity allocation, aims to identify the optimal
quantities of logistics resource allocation (i.e. with respect to the number of fulfillment order) in different
distribution regions with uncertain demand. That can be regarded as an inventory problem with the
considerations of logistics services.
However, there is a limited amount of studies, especially in analytical (i.e., mathematical) modeling
domain, which derives optimal decision making in service capacity allocation problems although it is
critically important for cost saving in operations management. The most similar work is by (Mofidi,
2018)who investigate an order-fulfillment resource allocation model to derive analytically the optimal
sets of SKUs of logistics resources and the respective quantities to satisfy demand. A two-stage
newsvendor framework is analytically proposed to determine which SKUs and in what quantities should
be prepared with the goal of minimizing the additional handling cost from the operations on inbound
logistics. In addition, (Crainic T. G., 2016) propose an analytical modeling framework introducing the
logistics capacity optimization problem under volatile demand.
The traditional solution schemes for inventory control models, such as the classical newsvendor or EOQ
problem (Liu. X, 2015), involve two steps: (i) demand is predicted at the first step, and (ii) the optimal
quantity is then determined in the second step. However, this may lead to a serious problem that errors in
the first step will create errors in the second step on inventory quantity optimization (Ban, 2018). In fact,
recently, (Ban, 2018) investigate a single step solution (called data-driven newsvendor model) for the
newsvendor problem.
With the use of various “machine learning algorithms”, the authors obtain the optimal solution by
considering the exogenous variables (such as seasonality weather, location and economic indicators)
when the inventory decision is made in a single step. Following this idea, in this paper, we propose a one-
step solution for the logistics service capacity allocation problem by integrating both demand uncertainty
prediction and inventory decision together. In our proposed framework, the logistics capacity in different
distributing region is modeled as a single period multi-product newsvendor problem, and demand
distribution is obtained from real observation rather than assuming demand distribution.
Benefiting from the rapid development of information technology (IT), cross-border e-commerce is
becoming more and more popular and thriving globally (Niu, 2019) With consumers' demand escalating,
competition between retailers has gradually transformed from “production related demand” to “service
related demand” (e.g., logistics) (Niu, 2019). As an important criterion to satisfy consumers, logistics
service is crucial and serves as a competitive lever for e-commerce operations (Barenji A V., 2019).
The international third-party-forwarding logistics (3PFL) services, which include various freight
forwarders, shipping forwarders and airfreight forwarders, have emerged as a major player in
international logistics in recent years. (Li L., 2015) Examine the price competition problem between
shipping FLS firms. To be specific, the authors focus on a duopoly scenario in which two competing
forwarders can purchase shipping capacity from each other. They find that this arrangement can yield a
win–win situation and show the respective market conditions. Our study also relates to this stream of
logistics research but the specific problem is different from all prior studies.
In the literature, several prior studies have reported scientific research on the “third-party warehousing
operations”. For example, (Chen, 2001)analyze the third-party warehousing contract with the
considerations of commitments and revenue sharing. The authors determine the optimal capacity
ISSN: 2005-4238 IJAST
Copyright ⓒ 2020 SERSC
1920International Journal of Advanced Science and Technology
Vol. 29, No. 06, (2020), pp. 1917-1931
allocation decision. (Gong, 2011) Conduct a sophisticated review on various stochastic analytical models
related to warehousing operations.
For capacity allocation studies, in the context of maritime logistics, (Mofidi, 2018)investigate the optimal
capacity resource allocation so as to optimize the performance of an order fulfillment system. The authors
reveal that a “proactive strategy” may not necessarily be a wise one as it may not outperform the
commonly adopted reactive strategy. Most recently, (Li, 2019) analytically explore the inventory-
fulfillment-allocation problem with the consideration of transshipment for e-tailors. The authors consider
the situation when a nearby facility may help to fulfill orders via transshipment. From the perspective of
product allocation, (Holzapfel, 2018) establish an analytical product allocation problem. The authors
develop a mixed-integer programming model to help allocate the “stock keeping units” (SKUs) to
distribution centers.
Considering fairness behaviors, (Liu, 2018a) (Liu X., 2018b)investigate the optimal “order allocation
problem” in a logistics service supply chain system. Following that, (Janjevic, 2019) propose an
integration method for establishing a “collection-and-delivery points” system in the distribution network,
by taking the changes in demand patterns into account. However, there is no doubt that the literature on
the LSC allocation is very limited even though it is a problem of very high real world relevance
(Holzapfel, 2018).
To obtain a more accurate and reliable forecasting result, there is a proposal of using the prediction
interval (PI) forecasting method in which both the upper bound and lower bound are developed. The PI
forecasting model has been applied in various industrial domains, such as traffic, medical, power system,
and so on (Liu X., 2018b) with good results.
Different from point forecasting, PI forecasting aims to capture demand uncertainty within a given
interval with a given probability. This kind of forecasting is hence very much useful in decision making.
One of the most crucial applications of demand forecasting in operations management is to assist decision
making in inventory management (Choi T. W., 2019). Following a recent influential study by (Ban,
2018), we know that there are several main approaches to help model the decision making under demand
uncertainty, such as the Bayesian approach, and the data-driven approach (Choi, 2019). This paper
belongs to the data driven approach, and the specific problem we attempt to address is new.
OBJECTIVE OF THE RESEARCH
To compare the reverse logistics of the two e-commerce platforms i.e Amazon and Flipkart.
To find apt reasons for the high return of goods from the customers’ end.
To find ways to make the reverse logistics more (cost) effective for the e-commerce platforms.
SCOPE OF THE RESEARCH
This report would help understand the entire process of reverse logistics in the e-commerce in the country
in-depth. This report helps understand the role of reverse logistics as an integral and upcoming part of the
e-commerce business. The interaction with the customers would reveal why the percentage of the
returned goods is as high as about 15% of the total placed orders on the e-commerce platforms. The report
would help clearly understand the way the e-commerce functions for the top two e-commerce platforms,
i.e Amazon and Flipkart.
ISSN: 2005-4238 IJAST
Copyright ⓒ 2020 SERSC
1921International Journal of Advanced Science and Technology
Vol. 29, No. 06, (2020), pp. 1917-1931
RESEARCH METHODOLOGY
Figure-1: India e-commerce market worth - By Value 2010-2016 (billion USD)
*2020= forecast Source: Secondary Research
For this Research Researcher used primary research as a research tools, a questionnaire has been made for
taking the responses from the people. It was circulated through the online channels as well as few
responses have been collected personally using the online questionnaire. The additional data for the
secondary analysis have been collected from the Government Sources, Annual Reports of companies and
News Articles. Research design states the methodology and strategy based on which the research will be
carried on to effectively address the problem. It guides in different stages of the research such as how the
data will be collected, what instruments will be employed and how it will be used. For this topic
researcher used Descriptive Method of the research design has been used. Descriptive research is used to
obtain information concerning the current status of the phenomena to describe "what exists" with respect
to variables or conditions in a situation. And target audience will be from Vadodara, Gujarat.
SAMPLING DESIGN
A sample is a subset of the population being studied. It represents the larger population and is used to
draw inferences about that population. Sampling design specifies for every possible sample its
probability of being drawn. It basically means the method of selecting a sample size, sampling method,
and type of sampling required. Sampling method used for this research is Non-probability Sampling.
The sampling type that has been used for this research is “Convenience Sampling” and “Snowball
Sampling”. Convenience sampling (also known as availability sampling) is a specific type of non-
probability sampling method that relies on data collection from population members who are
conveniently available to participate in study. Snowball sampling the type of non-probability sampling
method where references from the participants are taken into consideration to look for the reliable
samples. Sample Size: The Sample size that has been taken for the research is 200 samples. Sampling
Unit: Consumers lying either in the lower or upper middle class tend to make online purchase through e-
commerce platforms in India.
Indian Scenario
India had an internet user base of about 354 million as of june 2015 and was expected to cross 500
million in 2016. Despite being the second-largest userbase in world, only behind china (650 million,
48% of population), the penetration of e-commerce is low compared to markets like the united states
(266 million, 84%), or France (54 m, 81%), but is growing at an unprecedented rate, adding around 6
ISSN: 2005-4238 IJAST
Copyright ⓒ 2020 SERSC
1922International Journal of Advanced Science and Technology
Vol. 29, No. 06, (2020), pp. 1917-1931
million new entrants every month. The industry consensus is that growth is at an inflection point. In
India, cash on delivery is the most preferred payment method, accumulating 75% of the e-retail
activities. Demand for international consumer products (including long-tail items) is growing much
faster than in-country supply from authorized distributors and e-commerce offerings. Largest e-
commerce companies in India are Flipkart, Snapdeal, Amazon India, paytm.
Market Size By Value
India's e-commerce market was worth about $3.9 billion in 2009, it went up to $12.6 billion in 2013. In
2013, the e-retail segment was worth us$2.3 billion. About 70% of India’s e-commerce market is travel
related. According to google India, there were 35 million online shoppers in India in 2014 q1 and is
expected to cross 100 million mark by end of year 2016. CAGR global growth rate of 8–10%.
Electronics and apparel are the biggest categories in terms of sales. By 2020, India is expected to
generate $100 billion online retail revenue out of which $35 billion will be through fashion e-commerce.
Online apparel sales are set to grow four times in coming years. The Indian e-commerce industry has
been on an upward growth trajectory and is expected to surpass the US to become the second largest e-
commerce market in the world by 2034. India’s e-commerce industry is expected to grow from US$
38.5 billion as of 2017 to US$ 200 billion by 2026. India’s internet economy is expected to double from
US$125 billion as of April 2017 to US$ 250 billion by 2020, majorly backed by ecommerce.
Much growth of the industry has been triggered by increasing internet and smartphone penetration.
Internet penetration in India grew from just 4 per cent in 2007 to 34.08 per cent in 2016, registering a
direct increase of 89 per cent in 2016 over 2007. The number of internet users in India is expected to
increase from 429.23 million as of September 2017 to 829 million by 2021.
A young demographic profile, rising internet penetration and relative better economic performance are the
key drivers of this sector. The Government of India's policies and regulatory frameworks such as 100 per
cent foreign direct investment (FDI) in B2B e-commerce and 100 per cent FDI under automatic route
under the market place model of B2C e-commerce are expected to further propel growth in the sectors.
DATA ANALYSIS AND INTERPRETATION
According to the research, about 55.4% of the respondents use amazon or prefer to use amazon during
their e-commerce purchases.
About 25.6% of the respondents use Flipkart and the rest 19% use other sites to cater to their needs
through e-commerce. The respondents which prefer other platforms might not be loyal to any of the e-
commerce platforms and thus might be looking only for better deals on the required products.
ISSN: 2005-4238 IJAST
Copyright ⓒ 2020 SERSC
1923International Journal of Advanced Science and Technology
Vol. 29, No. 06, (2020), pp. 1917-1931
Different Categories of Products ordered till date
According to the research, 76.4% of the people shopped Fashion related products from e-commerce
websites. About 66% of them ordered electronics and accessories. 29.8% bought cosmetics. 24.1%
ordered home and décor related products. Whereas only 12% shopped for healthcare products and 8.9%
for kitchen related products.
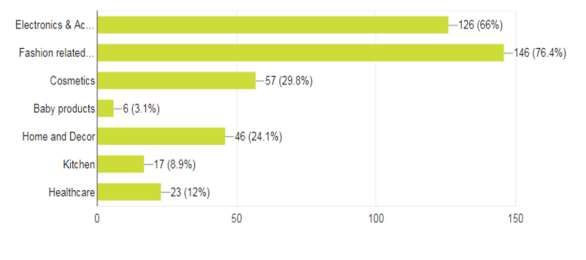
Spending on e-commerce purchases in a year
About 36.8% of people spent less than 5000 per year on their e-commerce purchases. About the same
percentage of people, i.e. 36.3% of them spent 5000-1000 rupees. Around 23.8% of the respondents spent
10,000 to 50,000 on their online shopping. Whereas only 2.6% spent 50,000 to 1,00,000 and 0.5% of
them spent above 1,00,000 on their yearly e-commerce purchases.
Categories of products sent back
According to the research, fashion related products constitute the products returned the most for 61.3% of
the respondents, followed by 44.5% of the respondents returning electronic products.
ISSN: 2005-4238 IJAST
Copyright ⓒ 2020 SERSC
1924International Journal of Advanced Science and Technology
Vol. 29, No. 06, (2020), pp. 1917-1931
11% of the respondents returned cosmetics, whereas 9% sent back home and décor items. About 4.5% of
them returned kitchen related products, 3.2% returned healthcare products and only 0.6% of the
respondents returned baby products.
Rating the return experience for different categories
It is important to understand the fact that not all the product categories have the same kind of return
policies, hence not the same return experience with the e-commerce platforms. Thus it is necessary to
classify the return experience based on the category which was obtained by the primary research as
follows.
Giving weightage to the different parameters of rating, i.e (Best, Average, Worst), according to the
feedback of the customers on various product categories, it was found that Fashion related products
topped the list with maximum score of return of the product i.e. 535. This was soon followed by
Electronics and accessories with the score of 530. The other important product categories facing high
chances of return according to the feedback are Cosmetics scoring 255 and Home & Décor products with
ISSN: 2005-4238 IJAST
Copyright ⓒ 2020 SERSC
1925International Journal of Advanced Science and Technology
Vol. 29, No. 06, (2020), pp. 1917-1931
the score 224. The rest of the product categories have their scores below 200 from the respondents.
Prime reason for returning the product
According to the research, the prime reason for returning the product turned out to be misfit, which was
the answer for 57.4% of the respondents. This matches with the fashion related products, as it was the
category of products returned the most by the customers in section 8.7.
Poor quality was voted to be the second most popular reason with 36.8% by the respondents for returning
the product. This was followed by damaged goods with 30.3%, Product availability at cheaper price
elsewhere forms 20%, Product misrepresentation at 14.8%, Company shipping the wrong product at
13.5%. The rest of the reasons for return fall below 10%.
Easier return procedure
According to the research, 62.9% of the respondents responded positively for Amazon to be having an
overall easier hassle free return procedure over its competitor flipkart. Whereas on the other hand, 37.14%
voted in favor of Flipkart to be better when it comes to returning a product.
ISSN: 2005-4238 IJAST
Copyright ⓒ 2020 SERSC
1926International Journal of Advanced Science and Technology
Vol. 29, No. 06, (2020), pp. 1917-1931
Various Return Parameters and statistical analysis
This section shows a breakdown of the various parameters that are important as a part of the return
process. Amazon scored higher in all of the parameters as compared to Flipkart.
AMAZON FLIPKART
Accepting the returned 110 45
product
Return process time 101 49
Less pick-up time 102 45
Pick-up time as per customer’s 98 48
convenience
Refund medium 96 50
Time taken to refund the 95 44
amount
Customer assistance 91 50
Tracking Refund 95 47
TOTAL 788 378
Statistical Analysis (SPSS)
Correlation Analysis (between the prime factors during return of products)
Ho: there is no significant correlation between the factors
Ha: there is significant correlation
Table 3- Correlation Analysis
Descriptive Statistics
Mean Std. Deviation N
Acceptance 1.2903 .45538 155
Return Time 1.3267 .47057 150
Less Pickup Time 1.3061 .46246 147
Convenience 1.3288 .47138 146
Refund Medium 1.3425 .47617 146
Refund Time 1.3165 .46681 139
Consumer Assistance 1.3546 .48010 141
Refund Tracking 1.3310 .47223 142
It is evident from the above findings, the various parameters important for return of a product are
mentioned in the table, and the means of the same are closer to 1=Amazon and not 2=Flipkart. This
shows that the various parameters viz. acceptance of returned product, return time, pickup time, and
convenience of pickup time, refund medium, refund time, customer assistance and refund tracking are
voted in favor of Amazon according to the customer’s responses. Hence, Amazon is performing better in
all of the above listed parameters. Also, there is a significant correlation between the factors (Ho is
rejected) i.e. acceptance and time taken during the return. Also there is no significant correlation
between the rest of the factors as shown in the table below (Ho is not rejected).
ISSN: 2005-4238 IJAST
Copyright ⓒ 2020 SERSC
1927International Journal of Advanced Science and Technology
Vol. 29, No. 06, (2020), pp. 1917-1931
Correlations
Retur Less
Accept n Pickup Conven Refund Refund Consumer Refund
ance Time Time ience Medium Time Assistance Tracking
Acceptance Pearso
n
1 .523** .016 .078 -.027 -.016 .096 .090
Correl
ation
Sig.
(2- .000 .863 .406 .770 .867 .314 .341
tailed)
N 155 147 118 117 117 111 111 113
Return Time Pearso
n
.523** 1 -.175 -.069 -.130 -.125 -.203* -.179
Correl
ation
Sig.
(2- .000 .065 .472 .173 .203 .037 .063
tailed)
N 147 150 112 111 112 105 106 108
Less Pickup Pearso
Time n
.016 -.175 1 .430** .529** .534** .496** .606**
Correl
ation
Sig.
(2- .863 .065 .000 .000 .000 .000 .000
tailed)
N 118 112 147 142 141 137 139 140
Convenience Pearso
n
.078 -.069 .430** 1 .621** .502** .502** .572**
Correl
ation
Sig.
(2- .406 .472 .000 .000 .000 .000 .000
tailed)
N 117 111 142 146 141 135 135 138
Refund Pearso
Medium n
-.027 -.130 .529** .621** 1 .498** .561** .488**
Correl
ation
Sig.
(2- .770 .173 .000 .000 .000 .000 .000
tailed)
N 117 112 141 141 146 136 137 140
ISSN: 2005-4238 IJAST
Copyright ⓒ 2020 SERSC
1928International Journal of Advanced Science and Technology
Vol. 29, No. 06, (2020), pp. 1917-1931
Refund Time Pearso
n
-.016 -.125 .534** .502** .498** 1 .418** .565**
Correl
ation
Sig.
(2- .867 .203 .000 .000 .000 .000 .000
tailed)
N 111 105 137 135 136 139 136 136
Consumer Pearso
Assistance n
.096 -.203* .496** .502** .561** .418** 1 .679**
Correl
ation
Sig.
(2- .314 .037 .000 .000 .000 .000 .000
tailed)
N 111 106 139 135 137 136 141 139
Refund Pearso
Tracking n
.090 -.179 .606** .572** .488** .565** .679** 1
Correl
ation
Sig.
(2- .341 .063 .000 .000 .000 .000 .000
tailed)
N 113 108 140 138 140 136 139 142
**. Correlation is significant
at the 0.01 level (2-tailed).
*. Correlation is significant at
the 0.05 level (2-tailed).
Paired t- test (between the groups of male and female and their return of product categories)
H0: there is no significant association
Ha: there is significant association
Table 4- Paired t-tests
Paired Samples Statistics
Std. Error
Mean N Std. Deviation Mean
Pair 1 Male 2.3824 68 .97780 .11858
Female 1.8971 68 1.17359 .14232
Paired Samples Correlations
N Correlation Sig.
ISSN: 2005-4238 IJAST
Copyright ⓒ 2020 SERSC
1929International Journal of Advanced Science and Technology
Vol. 29, No. 06, (2020), pp. 1917-1931
Paired Samples Correlations
N Correlation Sig.
Pair 1 Male & Female 68 -.277 .022
Paired Samples Test
Paired Differences
95% Confidence
Interval of the
Difference
Std. Std. Error Sig. (2-
Mean Deviation Mean Lower Upper t df tailed)
Pair 1 Male -
.48529 1.72335 .20899 .06815 .90243 2.322 67 .023
Female
The significance Value is 0.023 which is greater than 0.005, there is a significant difference in the pattern
of return of product categories of male and female groups (Ho is rejected).
FINDINGS AND CONCLUSION
Fashion related products and Electronic equipment with their accessories constitute of the most ordered
from all of the other available categories of products. Fashion related products are the most returned
products, misfit being the reason. Electronics also have considerably high chances of return. The
important reasons for return are poor quality of product, damaged goods and availability of the same
product at cheaper price on some other e-commerce website. About 70% of the people who shop from e-
commerce websites have returned their products atleast once, 80% of which qualified for free returns.
Even if Fashion related products and electronics had high returns, they scored the best on the customer’s
return experience, showing that the returned products are easily accepted by the seller. Amazon has better
overall hassle free return process rated to be better than Flipkart on all the various parameters. Only about
10% of the product returns failed for the respondents.
REFERENCE
1. Arabzad, S. G.-M. (2015). An Evolutionary algoritham for a new multi-objective location-
inventory model in a distribution network with transportation mdel and third party logistic
providers. International Journal of Production Research, 53(4), 1038-1050.
2. Ban, G. R. (2018). The big data newsvendor : Practical insights from machine learning.
Operation Research, 67(1), 90-108.
3. Barenji A V., W. W.-Z. (2019). Intelligent E-commerce Logistic Platform using hybrid agent
based approach. Transportation Research , 15-31.
4. Chen, F. Y. (2001). Analysis of Third-Party warehousing contracts with commitments. European
Journal Of Operation Research, 131(3), 603-610.
5. Choi, T. M. (2019). Data quality challenges for sustainable fashion supply chain operations in
emerging markets: Roles of blockchain, government sponsors and environment taxes.
Transportation Research , 139-152.
6. Choi, T. W. (2019). The mean-variance approach for global supply chain risk analysis with air
logistics in the blockchain technology era. Transport. Transportation Research, 178-191.
ISSN: 2005-4238 IJAST
Copyright ⓒ 2020 SERSC
1930International Journal of Advanced Science and Technology
Vol. 29, No. 06, (2020), pp. 1917-1931
7. Crainic T. G., G. L. (2016). Logistics Capacity Planning: a Stochastic bin packing formulation
and a progressive heading meta-heuristic. European Journal of Operaional Research, 253(2),
404-417.
8. Farahani. R. Z., B. H. (2015). Location-inventory problem supply chinas: a modelling review.
International Journal of Production and Research, 53(12), 3769-3788.
9. Gong, Y. D. (2011). A review on stochastic models and analysis of warehouse operations.
Logistic Research, 3(4), 191-205.
10. Holzapfel, A. K. (2018). Product allocation to different types of distribution center in retail
logistics networks. European Journal Of Operation Research, 264(3), 948-966.
11. Janjevic, M. W. (2019). Integrating collection-and-delivery points in the strategic design of urban
last-mile e-commerce distribution networks. Transportation Research, 37-67.
12. Li L., Z. R. (2015). Cooperation through capacity sharing between competing forwarders.
Transportation Research , 115-131.
13. Li, S. J. (2019). A Benders decomposition algorithm for the order fulfillment problem of an e-
tailer with a self-owned logistics system. Transportation Research, 463-480.
14. Liu X., Z. K. (2018b). Analysis of logistics service supply chain for the one belt and one road
initiative of China. Transport. Transportation Research, 23-39.
15. Liu, W. W. (2018a). The impacts of distributional and peer-induced fairness concerns on the
decision-making of order allocation in logistics service supply chain. Logistic & Transportation ,
102-122.
16. Liu. X, C. D. (2015). The Operation of the Cross-border E-commerce Logistic in Chaina.
International Journal of Intelligency & Information System, 4(2), 15-18.
17. Mofidi, S. P. (2018). Proactive Vs reactive order-fulfillment resource allocation for sea-based
logistic Transportation . Logistic Transport , 66-84.
18. Niu, B. W. (2019). Product+Logistic: Bundling Sale and Co-delivery in Cross-border e-
commerce. Electronic Commerce Research, 19(4), 915-941.
ISSN: 2005-4238 IJAST
Copyright ⓒ 2020 SERSC
1931You can also read