A Strategy for the National Coordinated Soil Moisture Monitoring Network
←
→
Page content transcription
If your browser does not render page correctly, please read the page content below
May 2021

A Strategy for the
National Coordinated
Soil Moisture
Monitoring Network
Coordinated, High-Quality,
Nationwide Soil Moisture
Information for the Public Good

           Prepared for NIDIS by the
           Executive Committee of the
           National Coordinated Soil
           Moisture Monitoring Network
On the cover: USDA soil moisture and weather
    station, Ft Cobb, Oklahoma. Credit: Mike Cosh

2
NATIONAL COORDINATED SOIL MOISTURE MONITORING NETWORK                                                                                                          MAY 2021

                          Table of Contents
                          Report Contributors . . . . . . . . . . . . . . . . . . . . . . . . . . . . . . . . . . . . . . . . . . . . . . . . . . . 5
                          Acronyms . . . . . . . . . . . . . . . . . . . . . . . . . . . . . . . . . . . . . . . . . . . . . . . . . . . . . . . . . . . . 7
                          Executive Summary . . . . . . . . . . . . . . . . . . . . . . . . . . . . . . . . . . . . . . . . . . . . . . . . . . 10

                          CHAPTER 1: INTRODUCTION .  .  .  .  .  .  .  .  .  .  .  .  .  .  .  .  .  .  .  .  .  .  .  .  .  .  .  . 12
                          1.1 Background . . . . . . . . . . . . . . . . . . . . . . . . . . . . . . . . . . . . . . . . . . . . . . . . . . . . . . 12

                          CHAPTER 2: SUMMARY OF STATEWIDE, REGIONAL,
                          AND NATIONAL SOIL MOISTURE MONITORING .  .  .  .  .  .  .  .  .  .  . 15
                          2.1 Soil Moisture Monitoring Programs  . . . . . . . . . . . . . . . . . . . . . . . . . . . . . . . . . 15
                          2.2 Sensing Frequency, Reporting Interval, and Period of Record  . . . . . . . . . . . 17
                          2.3 Sensor Type  . . . . . . . . . . . . . . . . . . . . . . . . . . . . . . . . . . . . . . . . . . . . . . . . . . . . . 18
                          2.4 Measurement Depths . . . . . . . . . . . . . . . . . . . . . . . . . . . . . . . . . . . . . . . . . . . . . 19
                          2.5 Data Quality and Completeness  . . . . . . . . . . . . . . . . . . . . . . . . . . . . . . . . . . . . 20
                          2.6 Integration and Synthesis . . . . . . . . . . . . . . . . . . . . . . . . . . . . . . . . . . . . . . . . . . 21

                          CHAPTER 3: MODELING AND REMOTE SENSING  .  .  .  .  .  .  .  .  .  .  . 23
                          3.1 Introduction  . . . . . . . . . . . . . . . . . . . . . . . . . . . . . . . . . . . . . . . . . . . . . . . . . . . . . 23
                          3.2 Land Surface Models . . . . . . . . . . . . . . . . . . . . . . . . . . . . . . . . . . . . . . . . . . . . . . 24
                          3.3 Satellite Soil Moisture  . . . . . . . . . . . . . . . . . . . . . . . . . . . . . . . . . . . . . . . . . . . . . 25
                          3.4 Calibration and Validation Methodology  . . . . . . . . . . . . . . . . . . . . . . . . . . . . . 28
                              3.4.1 Validation and Scaling . . . . . . . . . . . . . . . . . . . . . . . . . . . . . . . . . . . . . . . . 28
                              3.4.2 Data Assimilation . . . . . . . . . . . . . . . . . . . . . . . . . . . . . . . . . . . . . . . . . . . . 31
                          3.5 Applications . . . . . . . . . . . . . . . . . . . . . . . . . . . . . . . . . . . . . . . . . . . . . . . . . . . . . .32
                          3.6 Future Directions . . . . . . . . . . . . . . . . . . . . . . . . . . . . . . . . . . . . . . . . . . . . . . . . . 32

                          CHAPTER 4: CONSIDERATIONS IN SOIL MOISTURE
                          NETWORK DESIGN .  .  .  .  .  .  .  .  .  .  .  .  .  .  .  .  .  .  .  .  .  .  .  .  .  .  .  .  .  .  .  .  .  .  .  .  . 33
                          4.1 Design Goals and Assumptions . . . . . . . . . . . . . . . . . . . . . . . . . . . . . . . . . . . . . 33
                          4.2 Key Network Design Decisions . . . . . . . . . . . . . . . . . . . . . . . . . . . . . . . . . . . . . . 34
                             4.2.1 Where should new stations be added?  . . . . . . . . . . . . . . . . . . . . . . . . . . 34
                             4.2.2 What depths should be monitored? . . . . . . . . . . . . . . . . . . . . . . . . . . . . . 38
                             4.2.3 What sensors should be used?  . . . . . . . . . . . . . . . . . . . . . . . . . . . . . . . . . 40
                          4.3 Engaging Users in Network Design . . . . . . . . . . . . . . . . . . . . . . . . . . . . . . . . . . 45

                          CHAPTER 5: INSTALLATION AND MAINTENANCE
                          OF SOIL MOISTURE STATIONS .  .  .  .  .  .  .  .  .  .  .  .  .  .  .  .  .  .  .  .  .  .  .  .  .  .  . 47
                          5.1 Pre-Installation Guidance . . . . . . . . . . . . . . . . . . . . . . . . . . . . . . . . . . . . . . . . . . 47
                          5.2 Sensor Installation . . . . . . . . . . . . . . . . . . . . . . . . . . . . . . . . . . . . . . . . . . . . . . . . 48
                          5.3 After-Sensor Installation . . . . . . . . . . . . . . . . . . . . . . . . . . . . . . . . . . . . . . . . . . . 48
                          5.4 Station Data Management . . . . . . . . . . . . . . . . . . . . . . . . . . . . . . . . . . . . . . . . . 49
                             5.4.1 Station Metadata . . . . . . . . . . . . . . . . . . . . . . . . . . . . . . . . . . . . . . . . . . . . . 49
                             5.4.2 Sensor Sampling and Data Aggregation Methodology  . . . . . . . . . . . . . 49

                                                                                                                                                                     3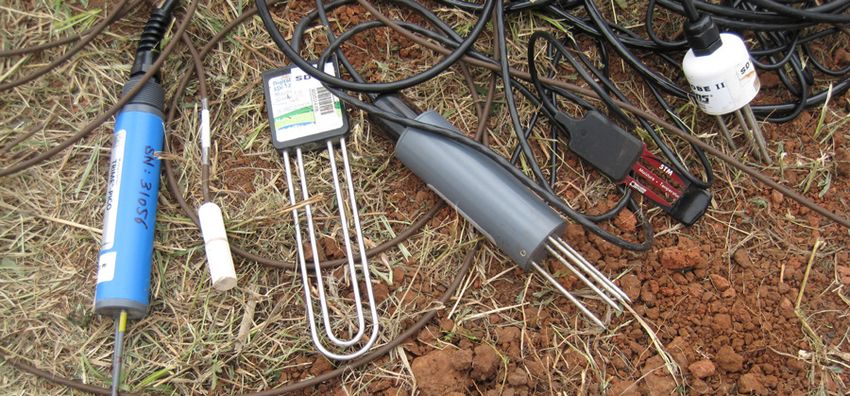
NATIONAL COORDINATED SOIL MOISTURE MONITORING NETWORK                                                                                                         MAY 2021

                          5.5 Maintenance . . . . . . . . . . . . . . . . . . . . . . . . . . . . . . . . . . . . . . . . . . . . . . . . . . . . . 49
                             5.5.1 Site Calibration . . . . . . . . . . . . . . . . . . . . . . . . . . . . . . . . . . . . . . . . . . . . . . . 49
                             5.5.2 Preventive Maintenance . . . . . . . . . . . . . . . . . . . . . . . . . . . . . . . . . . . . . . . 50
                             5.5.3 Unscheduled Maintenance . . . . . . . . . . . . . . . . . . . . . . . . . . . . . . . . . . . . . 50
                             5.5.4 Maintenance of Site Land Cover . . . . . . . . . . . . . . . . . . . . . . . . . . . . . . . . 50
                          5.6 Quality Control . . . . . . . . . . . . . . . . . . . . . . . . . . . . . . . . . . . . . . . . . . . . . . . . . . . 50
                             5.6.1 Seasonal Range Tests . . . . . . . . . . . . . . . . . . . . . . . . . . . . . . . . . . . . . . . . . 50
                             5.6.2 Sensor Intercomparisons . . . . . . . . . . . . . . . . . . . . . . . . . . . . . . . . . . . . . . 51
                             5.6.3 Temporal Consistency . . . . . . . . . . . . . . . . . . . . . . . . . . . . . . . . . . . . . . . . . 51
                             5.6.4 Spatial Coherency  . . . . . . . . . . . . . . . . . . . . . . . . . . . . . . . . . . . . . . . . . . . . 51
                          5.7 Recommendations for NCSMMN . . . . . . . . . . . . . . . . . . . . . . . . . . . . . . . . . . . . 51

                          CHAPTER 6: IMPLEMENTATION OF THE NCSMMN:
                          THE PATH FORWARD .  .  .  .  .  .  .  .  .  .  .  .  .  .  .  .  .  .  .  .  .  .  .  .  .  .  .  .  .  .  .  .  .  .  . 52
                          6.1 National Network Design  . . . . . . . . . . . . . . . . . . . . . . . . . . . . . . . . . . . . . . . . . . 52
                          6.2 Network Establishment . . . . . . . . . . . . . . . . . . . . . . . . . . . . . . . . . . . . . . . . . . . . 53
                             6.2.1 Existing Networks  . . . . . . . . . . . . . . . . . . . . . . . . . . . . . . . . . . . . . . . . . . . . 53
                             6.2.2 Data Aggregation . . . . . . . . . . . . . . . . . . . . . . . . . . . . . . . . . . . . . . . . . . . . . 54
                             6.2.3 Data Ownership . . . . . . . . . . . . . . . . . . . . . . . . . . . . . . . . . . . . . . . . . . . . . . 55
                             6.2.4 Resources and Technical Assistance Needed for
                             Monitoring Network Partnerships  . . . . . . . . . . . . . . . . . . . . . . . . . . . . . . . . . . . 55
                             6.2.5 Expanded Monitoring . . . . . . . . . . . . . . . . . . . . . . . . . . . . . . . . . . . . . . . . . 56
                          6.3 Data Quality Standards and Assessment . . . . . . . . . . . . . . . . . . . . . . . . . . . . . 57
                          6.4 National Soil Moisture Products from the NCSMMN . . . . . . . . . . . . . . . . . . . 58
                             6.4.1 The Value and Uses of NCSMMN Soil Moisture Products . . . . . . . . . . . 58
                             6.4.2 User-Specific Needs for National Soil Moisture Products . . . . . . . . . . . 60
                             6.4.3 Creating and Hosting a Suite of NCSMMN Soil
                             Moisture Products . . . . . . . . . . . . . . . . . . . . . . . . . . . . . . . . . . . . . . . . . . . . . . . . . 61
                             6.4.4 Research Needed to Enable Creation of NCSMMN Soil
                             Moisture Products . . . . . . . . . . . . . . . . . . . . . . . . . . . . . . . . . . . . . . . . . . . . . . . . . 62
                          6.5 Communication, Coordination, and Collaboration . . . . . . . . . . . . . . . . . . . . . 63
                             6.5.1 Collaboration and Coordination for NCSMMN Soil
                             Moisture Products . . . . . . . . . . . . . . . . . . . . . . . . . . . . . . . . . . . . . . . . . . . . . . . . . 63
                             6.5.2 Citizen Science Collaboration . . . . . . . . . . . . . . . . . . . . . . . . . . . . . . . . . . . 63
                             6.5.3 External Communication  . . . . . . . . . . . . . . . . . . . . . . . . . . . . . . . . . . . . . . 64
                          6.6 Network Management  . . . . . . . . . . . . . . . . . . . . . . . . . . . . . . . . . . . . . . . . . . . . 65
                          6.7 Funding for the National Coordinated Soil Moisture
                          Monitoring Network . . . . . . . . . . . . . . . . . . . . . . . . . . . . . . . . . . . . . . . . . . . . . . . . . . 66
                          6.8 Recommendations and Next Steps . . . . . . . . . . . . . . . . . . . . . . . . . . . . . . . . . . 66

                          References . . . . . . . . . . . . . . . . . . . . . . . . . . . . . . . . . . . . . . . . . . . . . . . . . . . . . . . . . . 69

                          APPENDIX A: REGIONAL CASE STUDY: THE
                          UPPER MISSOURI RIVER BASIN SOIL MOISTURE
                          AND PLAINS SNOW MONITORING NETWORK .  .  .  .  .  .  .  .  .  .  .  .  . 74
                          A.1 Background . . . . . . . . . . . . . . . . . . . . . . . . . . . . . . . . . . . . . . . . . . . . . . . . . . . . . . 74
                          A.2 Federal Support . . . . . . . . . . . . . . . . . . . . . . . . . . . . . . . . . . . . . . . . . . . . . . . . . . 74
                          A.3 Value to the USACE and the Upper Missouri River Basin . . . . . . . . . . . . . . . . 74
                          A.4 Network Goals . . . . . . . . . . . . . . . . . . . . . . . . . . . . . . . . . . . . . . . . . . . . . . . . . . . 74
                          A.5 Funding Structure  . . . . . . . . . . . . . . . . . . . . . . . . . . . . . . . . . . . . . . . . . . . . . . . . 75
                          A.6 Completed and Ongoing Work  . . . . . . . . . . . . . . . . . . . . . . . . . . . . . . . . . . . . . 75

4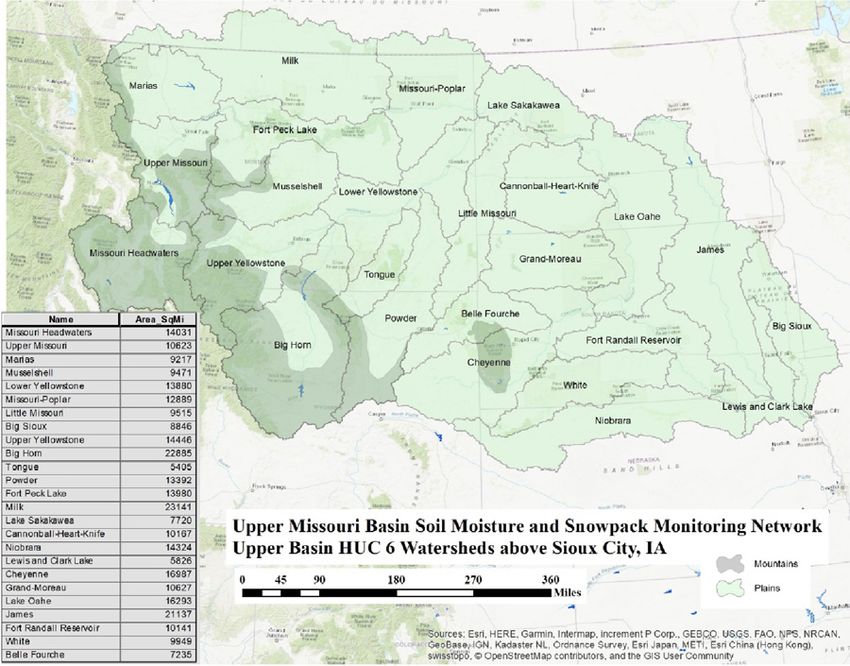
NATIONAL COORDINATED SOIL MOISTURE MONITORING NETWORK                                                                  MAY 2021

         Report Contributors
         NCSMMN EXECUTIVE COMMITTEE
         Michael Cosh, Chair           USDA-ARS
         Bruce Baker      		NOAA-ATDD
         John Bolten      		NASA-GSFC
         Mark Brusberg                 USDA-Office of the Chief Economist
         Todd Caldwell                 USGS-Nevada WSC
         Jordan Clayton 		USDA-NRCS
         Veva Deheza      		NOAA-NIDIS
         Nathan Edwards                South Dakota Mesonet, South Dakota State University
         Peter Goble                   Colorado State University
         Heather Hofman                USDA-NRCS
         Tyson Ochsner                 Oklahoma State University
         Steven Quiring                Ohio State University
         Charles Schalk                USGS-WMA
         Marina Skumanich              NOAA-NIDIS
         Mark Svoboda                  National Drought Mitigation Center/University of Nebraska, Lincoln
         Molly Woloszyn		NOAA-NIDIS

         ADDITIONAL CONTRIBUTORS
         Jennie Atkins                 Illinois Climate Network, Illinois State Water Survey, University of Illinois
         Edward Ayres                  National Ecological Observatory Network (NEON)
         Jesse Bell                    University of Nebraska Medical Center
         Rajat Bindlish 		NASA-GSFC
         Kevin Brinson                 Delaware Environmental Observing System, University of Delaware
         Jerald Brotzge                New York State Mesonet, University at Albany
         Colin Campbell                METER Group, Inc. & Washington State University
         Wade Crow        		USDA-ARS

                                                                                                                             5
NATIONAL COORDINATED SOIL MOISTURE MONITORING NETWORK                                                             MAY 2021

         Steve Evett       		USDA-ARS
         Ty Ferre                            University of Arizona
         Chris Fiebrich                      Oklahoma Mesonet, University of Oklahoma
         Trent Ford                          Southern Illinois University
         Brian Fuchs                         National Drought Mitigation Center/University of Nebraska, Lincoln
         Nandita Gaur                        University of Georgia
         Kevin Grode                         US Army Corps of Engineers
         Brian Hornbuckle                    Iowa State University
         Kevin Hyde                          Montana Mesonet, University of Montana
         Brad Illston                        Oklahoma Mesonet, University of Oklahoma
         Kelsey Jencso                       University of Montana
         Scott Jones                         Utah State University
         Venkat Lakshmi                      University of Virginia
         Rezaul Mahmood                      University of Nebraska, Lincoln
         Tilden Meyers 		NOAA ATDD
         Binayak Mohanty                     Texas Water Observatory, Texas A&M University
         Shawn Naylor                        Indiana University
         Charles O’Connell                   Kentucky Mesonet, Western Kentucky University
         Elizabeth Ossowski                  NOAA-NIDIS
         Andres Patrignani                   Kansas State University
         Tom Penning                         Irrometer Co., Inc.
         Richard Pouyat                      U.S. Forest Service, Emeritus
         Megan Schargorodski                 Kentucky Mesonet, Western Kentucky University
         Robert Schwartz                     USDA-ARS
         Kevin Stamm                         US Army Corps of Engineers
         Cindy West                          U.S. Forest Service
         Elizabeth Wilson                    Synoptic Data PBC
         Youlong Xia                         NOAA NCEP
         Chip Zimmer                         State of Kentucky

         Document drafted and prepared for NIDIS by the Executive Committee of the National
         Coordinated Soil Moisture Monitoring Network (NCSMMN). Special thanks to Adam Lang
         for editing, and Fiona Martin of Visualizing Science for layout formatting.

6
NATIONAL COORDINATED SOIL MOISTURE MONITORING NETWORK                                               MAY 2021

         Acronyms
         3D/4D          3-Dimensional / 4-Dimensional   DA         Data Assimilation
         AMSR-E         Advanced Microwave Scanning     DEOS       Delaware Environmental
                        Radiometer for the Earth                   Observing System
                        Observing System
                                                        DEWS       Drought Early Warning System
         ANN            Artificial Neural Network
                                                        DoD        U.S. Department of Defense
         API            Application Program Interface
                                                        DOE        U.S. Department of Energy
         ARM            DOE Atmospheric Radiation
                                                        EC         Executive Committee
                        Measurement Program
                                                        EM         Electromagnetic
         ARS            USDA Agricultural Research
                        Service                         EnkF       Ensemble Kalman Filter
         ASCAT          Advanced Scatterometer          EPA        U.S. Environmental Protection
                                                                   Agency
         ASM            Average Soil Moisture
                                                        ESA        European Space Agency
         ATBD           Algorithm Theoretical Basis
                        Documents                       ExpF       Exponential Filter
         CART           Cloud and Radiation Testbed     ftp/LDM    File Transfer Protocol / Local
                                                                   Data Manager
         CLM            Community Land Model
                                                        GCOM-W     Global Change Observation
         CLSM           Catchment Land Surface Model
         CMI            Crop Moisture Index                        Mission for Water
         CoCoRaHS       Community Collaborative Rain,   GeoTiff    Geo-reference Tagged Image
                        Hail, and Snow Network                     File Format
         COOP           NOAA Cooperative Observer       GHz        Gigahertz
                        Program
                                                        GNSS       Global Navigation Satellite
         CORS           Continuously Operating                     System
                        Reference Stations
                                                        GPM        Global Precipitation
         COSMOS         Cosmic-ray Soil Moisture                   Measurement
                        Observing System
                                                        GPS        Global Positioning System
         CRNP           Cosmic-Ray Neutron Probe
                                                        GPSR       GPS Reflectometry
         CSV            Comma Separated Variables
                                                        GRACE      Gravity Recovery and Climate
         CyGNSS         Cyclone Global Navigation                  Experiment
                        Satellite System
                                                        GRACE-FO   GRACE-Follow On

                                                                                                          7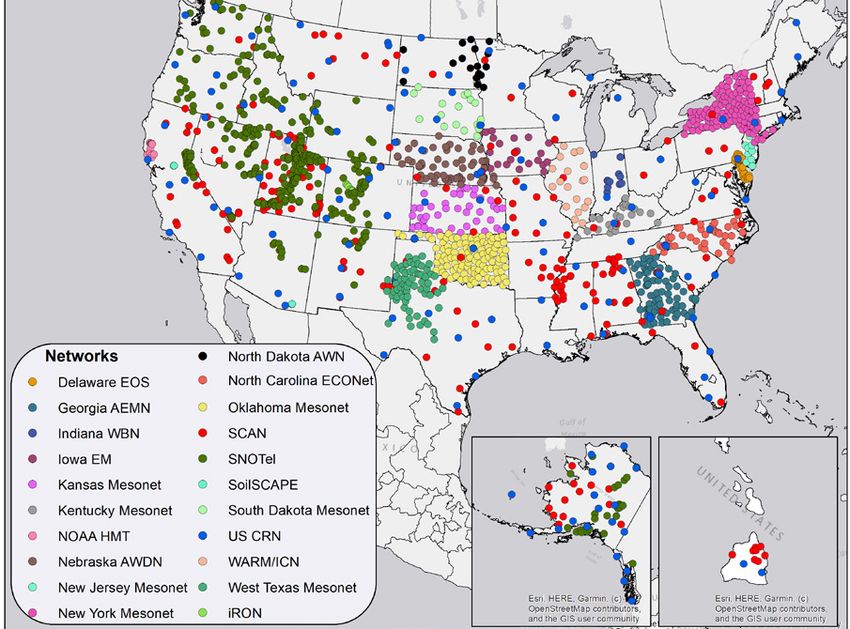
NATIONAL COORDINATED SOIL MOISTURE MONITORING NETWORK                                                MAY 2021

         HUC            Hydrologic Unit Codes            NIDIS       National Integrated Drought
                                                                     Information System
         ISMN           International Soil Moisture
                        Network                          NISAR       NASA ISRO Synthetic Aperture
                                                                     Radar
         ISRO           Indian Space Research
                        Organization                     NLCD        National Land Cover Dataset
         JPL AIRSAR     Jet Propulsion Laboratory’s      NLDAS       North American Land Data
                        Airborne Synthetic Aperture                  Assimilation System
                        Radar
                                                         NLDAS-2     North American Land Data
         LIS            Land Information System                      Assimilation System, Phase 2
         LR             Linear Regression                NMP         National Mesonet Program
         LSM            Land Surface Model               NOAA        National Oceanic and
                                                                     Atmospheric Administration
         LULC           Land Use and Land Cover
                                                         NOAA HMT    NOAA Hydrometeorology
         MAWN           Michigan Automated Weather
                                                                     Testbed Observing Network
                        Network
                                                         Noah-MP     Noah-Multi Physics Model
         MODIS          Moderate Resolution Imaging
                        Spectroradiometer                NOHRSC      NWS-National Operational
                                                                     Hydrologic Remote Sensing
         MOISST         Marena, Oklahoma In Situ
                                                                     Center
                        Sensor Testbed
                                                         NRCS        USDA Natural Resources
         MOU            Memorandum of
                                                                     Conservation Service
                        Understanding
                                                         NWS         National Weather Service
         NASA           National Aeronautics and Space
                        Administration                   PAW         Plant Available Water
         NASMD          North American Soil Moisture     PHS         Pulse Height Spectrum
                        Database
                                                         QA/QC       Quality Assurance / Quality
         NASS           USDA National Agricultural                   Control
                        Statistics Service
                                                         RDM         Robust Decision Making Under
         NCSMMN         National Coordinated Soil                    Uncertainty
                        Moisture Monitoring Network
                                                         RFC         NOAA River Forecast Center
         NDMC           National Drought Mitigation
                                                         RFI         Radio Frequency Interference
                        Center
                                                         RMA         USDA Risk Management
         NDVI           Normalized Difference
                                                                     Agency
                        Vegetation Index
                                                         RMSD        Root Mean Squared Difference
         NEON           National Ecological
                        Observatory Network              RMSE        Root Mean Squared Error
         NEPA           National Environmental Policy    SAR         Synthetic Aperture Radar
                        Act
                                                         SCAN        Soil Climate Analysis Network
         netCDF         Network Common Data Form
                                                         SFIR        South Fork Iowa River
         NGS            National Geodetic Survey
                                                         SFIR WASM   SFIR Weighted-Average Soil
         NGWMN          National Ground Water                        Moisture
                        Monitoring Network

8
NATIONAL COORDINATED SOIL MOISTURE MONITORING NETWORK    MAY 2021

         SHRU           Soil Hydrological Response
                        Unit
         SMAP           Soil Moisture Active Passive
         SMOS           Soil Moisture Ocean Salinity
         SMOS L2SM      SMOS Level 2 Soil Moisture
         SNOTEL         Snow Telemetry Network
         SOGW           Subcommittee on Ground
                        Water
         SPEI           Standardized Precipitation
                        Evapotranspiration Index
         SPI            Standardized Precipitation
                        Index
         SSURGO         Soil Survey Geographic
                        Database
         SWAT           Soil and Water Assessment
                        Tool
         TDR            Time Domain Reflectometry
         TEUI           Terrestrial Ecological Unit
                        Inventory
         Txt            Text Format
         UMB            Upper Missouri River Basin
         USACE          U.S. Army Corps of Engineers
         USBR           U.S. Bureau of Reclamation
         USCRN          U.S. Climate Reference Network
         USDA           U.S. Department of Agriculture
         USDM           U.S. Drought Monitor
         USFS           U.S. Forest Service
         USGS           U.S. Geological Survey
         VIC            Variable Infiltration Capacity
         WTM            West Texas Mesonet
         Z-index        Palmer’s Z-index

                                                               9
NATIONAL COORDINATED SOIL MOISTURE MONITORING NETWORK                                                                                        MAY 2021

                                          Executive Summary
         Soil moisture is a critical land surface variable,                   interested individuals to plan for and support
         impacting a wide variety of climatological, agri-                    nationally coordinated soil moisture monitoring and
         cultural, and hydrological processes. As a result,                   data assimilation. As a key milestone of this effort,
         soil moisture measurements are needed for appli-                     and in direct response to the NIDIS Reauthorization
         cations ranging from agricultural monitoring, to                     Act of 2018 (Public Law (P.L.) 115-423)2 call for a
         weather prediction, to drought and flood forecast-                   national soil moisture strategy, the NCSMMN com-
         ing. At the same time, the means and methods of                      munity has prepared this document,3 with the goal
         monitoring soil moisture are undergoing rapid                        of identifying a roadmap forward and the resources
         growth and innovation with the advent of new in                      needed for implementing a coordinated national
         situ and proximal sensors, new remote sensing                        network; specifically, a network that will provide
         technologies, and enhanced modeling capabilities.                    coordinated, high-quality, nationwide soil moisture
         Despite these opportunities, there is currently no                   information for the public good.
         coordinated national strategy for the deployment
         and maintenance of soil moisture networks, or for                    This strategy document includes: a summary of
         the development of nationally-integrated soil mois-                  current in situ networks as well as remote sensing
         ture data products.                                                  and model resources, a discussion of network design
                                                                              considerations, guidance for in situ network instal-
         Sponsored by the National Oceanic and Atmospheric                    lation and quality assurance/control, and the imple-
         Administration’s (NOAA) National Integrated                          mentation strategy for the proposed NCSMMN. The
         Drought Information System (NIDIS), the National                     following recommendations are detailed as a part of
         Coordinated Soil Moisture Monitoring Network                         the implementation strategy:
         (NCSMMN) is a collaborative effort among soil
         moisture scientists, mesonet1 operators, and other
         1
          A mesonet is a regional network of observing stations (usually surface stations) designed to diagnose mesoscale weather features
         and their associated processes (https://forecast.weather.gov/glossary.php?letter=m).
         2
             https://www.congress.gov/115/plaws/publ423/PLAW-115publ423.pdf
         3
             See list of Report Contributors on page 5.

10
NATIONAL COORDINATED SOIL MOISTURE MONITORING NETWORK MAY 2021
1. Determine Home Agency and long-term, high-quality, in situ soil moisture
Management Structure for the NCSMMN. monitoring stations across the United
It is recommended that NIDIS continue as States, especially for underrepresented
the near-term “home” for the NCSMMN, regions, such as in forests, grazing lands,
and that a review be undertaken of and croplands. The NCSMMN will work
models and best practices across the with partners from across the country
Federal Government to inform the choice to optimize locations of new monitoring
of a formalized management structure stations to meet Federal and state goals.
for the NCSMMN going forward. 7. Explore Increasing Partnerships with the
2. Establish a Web Presence and Formalize Private Sector. A concerted effort must be
Communication & Outreach Planning made to engage with private sector weather
for the NCSMMN. A visible, user-friendly and soil monitoring network operators not
website for the NCSMMN is important only to expand the impact of monitoring
for both communication and product efforts from all sources, but also to share
delivery. In addition, the NCSMMN will methodologies and validation protocols
need to do broader communications developed by the NCSMMN community.
and outreach planning. As a cornerstone 8. Engage with the Citizen Science
engagement activity, the NCSMMN will Community. One potential way to
continue to host an annual meeting increase in situ soil moisture monitoring
of soil moisture monitoring experts – as well as public support for such
from across the United States. monitoring – is to invite the participation
3. Formalize Partnerships with the of citizen scientists, particularly through
National Mesonet Program and collaboration with groups such as NOAA’s
Existing Monitoring Networks. To Cooperative Observer Program (COOP)
obtain in situ soil moisture data from and the Community Collaborative Rain,
existing monitoring networks across the Hail, and Snow Network (CoCoRaHS).
country, the NCSMMN should formalize 9. Develop, Release, and Promote NCSMMN
a partnership with NOAA’s National Products. The aim of the NCSMMN effort
Mesonet Program (NMP) and establish is to provide coordinated, high-quality,
Memoranda of Understanding (MOUs) with nationwide soil moisture information
networks outside of the scope of NMP. for the public good. This will require
4. Develop a Set of Criteria for High-Quality developing, releasing, and promoting new,
Data Sources. It is proposed that a set of nationwide point-based and gridded soil
criteria be established to qualify an in situ moisture data products that meet the
soil moisture network as producing high- needs of diverse end-user groups, and
quality versus moderate- or provisional- that support crucial applications such as
quality data. These criteria will be developed drought and flood monitoring, fire danger
in coordination with the research, data ratings, and streamflow forecasting.
provider, and user communities.
5. Support Research Necessary to Develop Implementing these recommendations will provide
or Improve NCSMMN Methodologies. a unifying structure for the national soil moisture
Although preliminary research and community, not only enhancing in situ monitoring
demonstration projects have shown the activities, but complementing remote sensing and
feasibility of the envisioned NCSMMN modeling activities as well. Through efforts to: 1)
products, further research is required to develop a strong organizational home; 2) engage in
enable the creation of these products at the communication and outreach; 3) establish partner-
national scale and to rigorously quantify ships and build out the network; 4) conduct needed
the uncertainty in those products. research; and 5) develop and refine data collection,
integration, and quality standards, the NCSMMN
6. Increase In Situ Soil Moisture will be positioned to deliver transformative soil
Monitoring Nationwide. There is a moisture products to the Nation.
clear need to increase the number of
11NATIONAL COORDINATED SOIL MOISTURE MONITORING NETWORK MAY 2021
Chapter 1
Introduction
1.1 BACKGROUND
Soil moisture4 is a critical land surface parameter
affecting a wide variety of economically and envi-
ronmentally important processes. From agricultural
monitoring, to weather prediction, to drought and
flood forecasting, the value of soil moisture metrics
is undeniable. At the same time, the means and
methods of monitoring soil moisture are undergo-
ing rapid growth and innovation with the advent of
new in situ and proximal sensors, new data telem-
etry methods, and new remote sensing technol-
ogies to provide broad and accurate soil moisture
estimates. Many nations have established soil mois-
ture sensing networks, including the United States,
which has a prolific but uncoordinated collection
of monitoring networks at the national, state, and
local levels. There is currently no national strategy
for the development, deployment, and maintenance
of soil moisture monitoring networks. The absence
of a coherent strategy leads to a host of problems
including many states lacking adequate monitor-
ing, multiple data sets which are not standardized
or directly comparable, and no clear plan for how
best to target investments to improve the overall
monitoring infrastructure. Because of these defi-
ciencies, the United States has not yet capitalized on
the transformative potential of nationwide, coordi-
nated in situ soil moisture observations for applica-
tions such as improved drought monitoring, water
resource management, and fire danger ratings.
In 2013, NOAA’s National Integrated Drought
Information System (NIDIS) and its partners began
an initiative to work towards a coordinated national
soil moisture network. The first meeting to discuss
this effort with a group of Federal, state, and aca-
demic experts was held in November 2013 in Kansas
4
Soil moisture is shorthand for soil water content, which has
units of m3 m–3 and is represented by the symbol θ.
12NATIONAL COORDINATED SOIL MOISTURE MONITORING NETWORK MAY 2021
City, Missouri. The key findings from that meeting5 with the Marena, OK, In Situ Sensor Testbed
included the need for improved metadata, calibra- (MOISST) workshop. Participants discussed the
tion, and validation of soil moisture data, as well as outcomes of the NIDIS data integration pilot project
the importance of data integration. The conclusion and refined the vision for the NCSMMN. Desired fea-
and recommendations from the meeting included: tures for a national gridded soil moisture product
1) convening a working group to discuss issues of were identified, including the need for both surface
scale and spatial distribution for monitoring via in and root zone soil moisture products and the need
situ networks, remote sensing platforms, and mod- for soil moisture data both as absolute values as
eling efforts; 2) developing a nationwide product well as percentiles.
from existing soil moisture data to demonstrate the
potential usefulness of a coordinated effort; and The efforts of creating and formalizing a national
3) piloting a soil moisture monitoring system for coordinated soil moisture network increased
a small number of regions that would integrate all significantly in 2018 as a result of some import-
available soil moisture data types and assess how ant efforts. Following the 4th NCSMMN meeting
the data would be used. in Lincoln, Nebraska in June 2018 (held again
in conjunction with the MOISST workshop), an
As a result of the 2013 workshop, NIDIS funded a Executive Committee was formed for the network.
series of workshops and a pilot project to advance The NCSMMN Executive Committee (EC) included
this goal. The pilot project served as the first proof leaders from Federal agencies and academic institu-
of concept for a coordinated national soil moisture tions, and was charged with clearly defining the goals
network by demonstrating that in situ soil moisture and framework to bring the NCSMMN concept to
data could be integrated in real time from a variety fruition (Clayton et al., 2019). Early efforts included
of sources and made accessible both by a web a successful project that demonstrated the feasi-
service and a webpage at a common location. This bility of merging soil moisture datasets within the
project was led by the U.S. Geological Survey (USGS) Southern Great Plains, and a NIDIS-funded project
and Texas A&M University (Quiring et al., 2016). by Dr. Trent Ford and Dr. Steven Quiring which
showed promise for the generation of a single soil
In order to continue the progress and discussion on moisture platform of widely available data, includ-
how to better coordinate soil moisture monitoring ing in situ, remotely sensed and modeled data (Zhao
and perform data assimilation and communication et al., 2020). However, there are still challenges that
across the federal landscape, and with states and need to be addressed to fully realize the value of the
other interests, a second workshop on a National diversity of soil moisture resources available in the
Coordinated Soil Moisture Monitoring Network United States.
(NCSMMN) was held in May 2016 in Boulder, CO.6
The discussion at this 2016 workshop focused on The importance of soil moisture data and a coor-
three core elements of a coordinated and integrated dinated network garnered further attention of
national soil moisture network. These included: 1) Congress in 2018, in response to the lack of early
improving collaboration through incentives and warning for the 2017 Northern Plains drought and
partnerships; 2) developing a consistent meth- the significant impact it had on the region. The
odology for data collection and installation of in NIDIS Reauthorization Act of 2018 (P.L. 115-423)7
situ sensors including metadata standards; and 3) calls for NIDIS to develop a strategy for a national
developing a national multi-platform soil moisture coordinated soil moisture monitoring network no
gridded product that could serve as a first-order later than 1 year after the date of enactment of the
data and information source as well as a platform Reauthorization Act. In addition, the Agriculture
for the development of derivative or secondary soil Improvement Act of 2018 (P.L. 115-334)8 (i.e.,
moisture products. A third NCSMMN workshop was the “Farm Bill”) calls for the U.S. Department of
held in Stillwater, OK, in May 2017 in conjunction Agriculture (USDA) and NOAA to coordinate with
5
https://www.drought.gov/documents/developing-coordinated-national-soil-moisture-network.
6
https://www.drought.gov/documents/national-soil-moisture-network-workshop-2016-progress-made-future-directions
7
https://www.congress.gov/115/plaws/publ423/PLAW-115publ423.pdf
8
https://www.congress.gov/115/plaws/publ334/PLAW-115publ334.pdf
13NATIONAL COORDINATED SOIL MOISTURE MONITORING NETWORK MAY 2021
the National Drought Mitigation Center (NDMC) to Attempting to satisfy all of these requirements can
enhance the collection of data (including soil mois- be difficult, but it is the belief of the community that
ture) to improve the accuracy of the U.S. Drought we are still capable of developing a coordinated
Monitor. soil moisture strategy to address the majority of
these considerations, offering a path forward for
Challenges are common in soil moisture monitor- improved soil moisture monitoring.
ing, and it is important to understand the goal or
purpose of a soil moisture network. Very often soil The infusion of support from Congress and rising
moisture sensors are added to existing networks to awareness of soil moisture’s critical importance in
enhance their monitoring capability. Or, in the drought prediction and other applications has led
development of a sensor network, a variety of the NCSMMN to develop the coordinated strategy
parameters are identified for observation, but siting that is laid out in this document. The goal of this
logistics require a compromise on the different cri- document is to identify a roadmap forward and the
teria necessary to accurately assess each parameter. resources needed for implementing the coordinated
A few networks have been developed to specifically network; specifically, a network that will provide
monitor soil moisture, including the USDA Soil coordinated, high-quality, nationwide soil moisture
Climate Analysis Network (SCAN) (Schaefer et al., information for the public good.
2007). However, even if the parameter of interest is
ideal, the purpose or use of the network can still This strategy document was developed as a collab-
impact its applicability for various uses. For orative effort organized by the NCSMMN EC under
instance, the need to monitor soil moisture within the sponsorship of NIDIS and with broad commu-
an agricultural domain (in-field) requires redeploy- nity engagement (see Report Contributors, page 5).
ment during planting and harvesting periods, which The document includes: a summary of current net-
results in a discontinuous data record that is not as works and remote sensing resources, a discussion
valuable for long-term research analysis. Also, a soil on network design considerations, guidance for
moisture station for irrigation scheduling is not as installation and quality assurance/control, and the
valuable for regional monitoring, due to the anthro- implementation strategy for the proposed National
pogenic influence. Remote sensing calibration and Coordinated Soil Moisture Monitoring Network.
validation studies need a different type of network
deployment at different depths. Table 1.1 (below)
lists some of the considerations for network deploy-
ment based on the network’s primary purpose.
Table 1.1: Considerations for network deployment
Purpose of Network Latency Duration Distribution Depths
Weather Monitoring X X X
Climate Monitoring X X
Agricultural Monitoring X X
Forest/Ecological Monitoring X X X X
Remote Sensing and Model Validation X X
Flood Forecasting X X X X
14NATIONAL COORDINATED SOIL MOISTURE MONITORING NETWORK MAY 2021
Figure 2.1: Locations of select in situ soil
moisture sensor networks across the
Chapter 2 United States from federal- and state-level
networks. (Source: nationalsoilmoisture.com)
Summary of Statewide, Regional, &
National Soil Moisture Monitoring
2.1 SOIL MOISTURE (above) provides the location of select Federal and
MONITORING PROGRAMS state networks that are currently in operation.
The number of networks and stations continues
The quantity and quality of in situ soil moisture to change, but as of 2019, there are approximately
monitoring stations has increased substantially in 1,900 stations that estimate soil moisture in public
recent decades. In the United States, most long-term networks in the United States.
soil moisture monitoring networks are operated by
Federal and state agencies. The number of networks Table 2.1 (next page) provides an overview of the
that measure soil moisture has continued to expand operational networks that are currently reporting
at both regional and national scales. Figure 2.1 soil moisture in the United States.9
9
There exist a number of research networks within the United States as well; these are outside the scope of the current effort.
15NATIONAL COORDINATED SOIL MOISTURE MONITORING NETWORK MAY 2021
Table 2.1: Description of selected soil moisture monitoring networks in the United States including type
of sensor, number of active (automated) stations, period of record and measurement depths.
# Active Start
Network Name Stations^ Year Sensor Type* Sensor Depth (cm)
AmeriFlux (AmeriFlux) 60 1996 Various Varies (5-200)
Atmospheric Radiation Measurement (ARM) 17 1996 CS229-L, Hydra 5, 15, 25, 35, 60, 85, 125, 175
Cosmic-ray Soil Moisture 54 2008 COSMOS Varies (10-30)
Observing System (COSMOS)
Delaware Environmental 26 2005 CS616 5
Observing System (DEOS)
Georgia Automated Environmental 87 1992 CS616 5, 10, 20
Monitoring Network (Georgia AEMN)
Illinois Climate Network (ICN) 19 2004 Hydra 5, 10, 20, 50, 100, 150
Indiana Water Balance Network 13 2011 CS655/650, Varies (10-180)
EnviroSCAN
Iowa Environmental Mesonet (IEM) 25 1986 CS655 30, 60, 125
Kansas Mesonet 41 2010 Hydra Varies (5, 10, 20, 50)
Kentucky Mesonet 32 2008 Hydra 5, 10, 20, 50, 100
Michigan Automated Weather 80 2000 CS616 5, 10
Network (MAWN)
Montana Mesonet 75 2016 GS3, Teros12 10, 21, 51, 91
National Ecological Observatory 47 2016 EnviroSCAN Varies (6-200)
Network (NEON)
Nebraska Automated Weather 51 2006 Hydra, TP 10, 25, 50, 100
Data Network (NAWDN)
New York State (NYS) Mesonet 126 2015 Hydra 5, 25, 50
NOAA Hydrometeorology Testbed 25 2004 CS616, Hydra 5, 15
Observing Network (NOAA HMT)
North Carolina Environment and Climate 36 1999 TP 20
Observing Network (NC ECONet)
North Dakota Agricultural 23 2016 CS655 10, 20, 30, 50, 75, 100
Weather Network (NDAWN)
Oklahoma Mesonet (OKM) 120 1996 CS229-L 5, 10, 25, 60
Plate Boundary Observatory to 97 2011 GPS 2.5
Study the Water Cycle (PBO H2O)
Snow Telemetry Network (SNOTEL) 352 2005 Hydra 5, 10, 20, 50, 100
Soil Climate Analysis Network (SCAN) 190 1999 Hydra 5, 10, 20, 50, 100
South Dakota Mesonet 26 2002 Hydra 5, 10, 20, 50, 100
Texas Soil Observation Network (TxSON) 56 2015 CS655 5, 10, 20, 50
Texas Water Observatory 21 2017 CS655, MPS6 5, 15, 30, 75, 100
U.S. Climate Reference Network (USCRN) 114 2009 Hydra, TDR-315 5, 10, 20, 50, 100
West Texas Mesonet (WTM) 59 2002 CS615 5, 20, 60, 75
^
This number only includes active stations with soil moisture sensors within the network; may not reflect total station count.
*
Regarding sensor type: CS229-L (Campbell scientific, US) is a heat dissipation matric potential sensor, Hydra (Hydraprobe, Stevens
Water, US) and TP (Theta Probe, Delta-T, Inc., UK) are electrical impedance sensors, CS616/655 (Campbell Scientific, US) are
transmission line oscillator sensors, EnviroSCAN (Sentek, Australia) is a borehole capacitance sensor, COSMOS is a cosmic ray-based
sensor (HydroInnova, US), TDR-315 (Acclima, US) is a time domain reflectometer, MPS6 (Water Potential Sensor, Meter Group, US)
and GPS is a generic reflectometer using L-band GPS signals for soil moisture estimation.
16NATIONAL COORDINATED SOIL MOISTURE MONITORING NETWORK MAY 2021
Table 2.1 (previous page) highlights that there are 2.2 SENSING FREQUENCY,
many existing stations reporting soil moisture and REPORTING INTERVAL, AND
some of them have a period of record >20 years.
It also shows that there is a tremendous variabil-
PERIOD OF RECORD
ity in the depths and type of sensors that are used Each network has its own sensing frequency.
to estimate soil moisture. These variations will be For example, DEOS senses soil moisture every 5
described in more detail in the following sections of minutes, OKM senses every 30 minutes, SCAN and
this chapter. SNOTEL take instantaneous samples at hourly time
step, while other networks like MAWN update their
Of these networks, the major national networks data at a daily time step. If it is desirable to stan-
are the Soil Climate Analysis Network (SCAN), the dardize the reporting interval, most stations would
Snow Telemetry (SNOTEL) network, and the U.S. be able to report soil moisture measurements every
Climate Reference Network (USCRN). The SCAN hour. Networks differ in whether reported data are
network, operated by the USDA Natural Resources the mean of several data taken at a higher sensing
Conservation Service (NRCS), consists of almost frequency or a singular datum from a sensor.
200 stations spanning all 50 states continuously
monitoring soil moisture, some for more than There is also substantial variability in the period
20 years. Soil moisture observations are taken at of record for soil moisture data. As shown in
most SCAN stations at 5-cm, 10-cm, 20-cm, 50-cm, Table 2.1 (previous page), SCAN and SNOTEL are
and 100-cm depths using the HydraProbe sensor the two federally operated networks that have been
(Stevens Water Monitoring Systems, Inc.) to esti- monitoring soil moisture for the longest period of
mate soil moisture (volumetric water content, θ in time (1995 and 2005, respectively). In addition,
m3 m–3) at hourly intervals. Soil moisture measure- some states also have a long period of record. For
ments began between 1997 and 2000 at many SCAN example, soil moisture was reported in Iowa from
sites. The maintenance cycle is usually as needed, 1954–1983 by gravimetric sampling (Khong et al.,
which is typically 2–3 years per site. 2015) and in Illinois from 1981–2008 by neutron
probe (Coopersmith et al., 2016a); however, auto-
The SNOTEL network, also operated by NRCS, mated sensors have only been used for long-term
is comprised of over 700 stations that monitor soil moisture monitoring networks since the 1990s.
meteorological and hydrological conditions across Figure 2.2 (next page) shows a selection of the sta-
the western United States (Schaefer et al., 2007). tions in the continental United States that have been
HydraProbes are used to estimate soil moisture continuously monitoring soil moisture for either
hourly at 5, 20, and 50 cm at >300 SNOTEL stations. >15 years (red) or forNATIONAL COORDINATED SOIL MOISTURE MONITORING NETWORK MAY 2021
Figure 2.2: Length of record for select stations that monitor soil moisture. Those that have a
continuous period of record >15 years are shown in red. Those with a period of recordNATIONAL COORDINATED SOIL MOISTURE MONITORING NETWORK MAY 2021
(e.g., Sentek TriSCAN sensor, EC-5), heat dissipation for each sensor and installation in a network what
(e.g., CS-229), neutron probes, GPS reflectometry, the errors are in relation to a true volumetric soil
and cosmic ray neutron sensing. Table 2.1 (page 16) moisture at the location in question. This is the
lists the sensors that have been adopted by some standard used by both the National Aeronautics and
of the networks in the United States. It should be Space Administration’s (NASA) Soil Moisture Active
noted that this strategy document is focused on soil Passive (SMAP) mission and the European Space
moisture (soil water content) as the intended vari- Agency’s (ESA) Soil Moisture Ocean Salinity (SMOS)
able to be measured. Soil matric potential sensors, mission (Entekhabi et al., 2010; Kerr et al., 2010).
which indicate the attraction of the soil matrix
to water, also offer valuable information regard-
ing drought and moisture status, particularly for 2.4 MEASUREMENT DEPTHS
impacts to plants. Although they are not the focus Existing soil moisture monitoring networks measure
of the current strategy, they should be regarded as soil moisture at different depths. Figure 2.4 (below)
providing useful ancillary data. shows the soil moisture measurement depths at
18 selected networks. Many networks, including
There is a clear need to identify best practices for the federally funded national networks like SCAN,
standardizing soil moisture data from different SNOTEL and USCRN, measure soil moisture at 5-cm,
sensors and sensor types to a common standard. 10-cm, 20-cm, 50-cm, and 100-cm depths; however,
This is particularly important for regional and others measure at site-specific depths based on the
national applications, such as drought and flood soil profile, or only at one depth. This lack of unified
monitoring, which necessitate combining soil measurement depths across different networks
moisture data from multiple networks (Krueger, impedes soil moisture applications at regional and
2019). There are initial studies being conducted national scales.
currently related to the Marena, OK, In Situ Sensor
Testbed (Cosh et al., 2016), but this work is ongoing. One approach to addressing the lack of uniform mea-
Ultimately, because new technologies are always surement depths is to employ methods for vertical
being developed, the best practice is to determine interpolation and extrapolation of soil moisture, i.e.,
Figure 2.4: Soil moisture measurement depths at 18 of the monitoring networks that are archived in the North
American Soil Moisture Database (NASMD) from Jan. 1, 2000 to Dec. 31, 2013. Depths monitored are indicated by
depths at which colors change. The greatest depth monitored is indicated by the right end of the color bar. The depths
of soil moisture monitoring in AmeriFlux vary from station to station, here we only provide the general range (0–175
cm) of the records. The number indicates the number of stations in each network. (Source: Zhang et al., 2017)
19NATIONAL COORDINATED SOIL MOISTURE MONITORING NETWORK MAY 2021
using shallow soil moisture measurements to esti- cases where stations were not installed until later in
mate deeper soil moisture. Such methods could be the period; the study objective was to examine data
used to standardize data to a set of common depths. availability more so than network performance. The
Zhang et al. (2017) compared three methods, artifi- missing ratio tends to range from 10% to 30% for
cial neural network (ANN), linear regression (LR), most of the networks that are included in this anal-
and exponential filter (ExpF), for vertical extrapola- ysis. There are very few networks that have 25 Previous studies have examined the quality of soil
cm), but the ExpF outperformed the other methods moisture measurements at existing networks in
at deeper depths. the United States using relative error variance and
random anomaly error (Ford and Quiring, 2019).
Relative error variance indicates the relative pro-
2.5 DATA QUALITY AND portion of variability from sensing error to real soil
COMPLETENESS moisture variability. Ford and Quiring (2019) cal-
Missing data are a common issue for in situ soil culated relative error variance at eight networks.
moisture measurements. It is difficult to repair It was calculated for each station and then aver-
and replace soil moisture sensors because they aged by network and depth (Figure 2.6, next page).
are often buried in trenches or pits that should The error bars in Figure 2.6 represent the range of
not be disturbed after installation. A few sensors individual station relative error variance values for
do accommodate easier replacement, such as the each network. The results showed that SNOTEL,
Sentek EnviroSCAN or the COSMOS systems, but OKM, and WTM had the lowest relative error vari-
there are other tradeoffs to these technologies. ance, with network‐averaged values ≤10%, which
Figure 2.5 (below) shows the missing data ratio at is a good indicator of network quality. This means
each measurement depth (in order) for 18 networks that 10% or less of the overall variability in daily
that monitored soil moisture between Jan. 1, 2000 soil moisture was attributed to sensing error. The
and Dec. 31, 2013 (Zhang et al., 2017). The ratio is results also indicated that there were statistically
defined as the total number of missing observations significant differences, based on a one‐way analysis
for that network and depth divided by the total of variance, in data quality that vary as a function of
number of observations that would have been col- sensing depth and network. Data from deeper in the
lected if every station in the network had no missing soil had smaller random errors.
data for that depth over the specified time period. It
should be noted that “missing” in this study includes Ford and Quiring (2019) suggested that the relative
error variance and random anomaly error provided
Figure 2.5: Missing data ratio for 18 networks archived in the North American Soil Moisture Database
(NASMD) from Jan. 1, 2000 to Dec. 31, 2013. The missing data ratio is defined as the amount of missing
data for each network and depth divided by the total number of data that would have been collected
if every station in that network had no missing data over the period of record. “Missing” includes
cases where stations were not installed until later in the period. (Source: Zhang et al., 2017)
20NATIONAL COORDINATED SOIL MOISTURE MONITORING NETWORK MAY 2021
Figure 2.6: Relative error variance (left) and random anomaly error (right) for soil moisture
data from the following networks: West Texas Mesonet, SoilScape, SNOTEL, SCAN, OKM,
NOAA HMT, EnviroWeather and DEOS. (Source: Ford and Quiring 2019)
a comprehensive framework for evaluating both the quality control, and standardization/homogeniza-
overall quality and spatial representativeness of soil tion of data, and on developing a consistent set of
moisture data. These approaches can be used to flag metadata from all networks. Here we focus on sum-
stations and sensors where there are potentially marizing metadata standards for soil moisture since
issues with data quality. Overall, Ford and Quiring quality control is covered in Chapter 5 of this report.
(2019) found that the majority of in situ stations
have high fidelity and they provide high-quality Quiring et al. (2016) developed a standard set of
information that is spatially representative. metadata that was collected for all stations that
were included in the North American Soil Moisture
Database (Table 2.3, next page). The metadata col-
2.6 INTEGRATION AND SYNTHESIS lected for each station include the: location, county,
Efforts to assemble and homogenize soil moisture state, parent observation network, depths at which
data are important for making these data more soil moisture is observed, type of soil moisture
useful for the scientific community. Robock et al. sensor, and the sampling frequency. In addition,
(2000) developed the Global Soil Moisture Data soil characteristics such as bulk density, texture,
Bank, which included soil moisture observations percent sand/silt/clay, and hydraulic conductiv-
from 25 stations in the United States. The Global ity are reported at each depth that soil moisture is
Soil Moisture Data Bank has been incorporated into monitored. Soil texture information from site-spe-
the International Soil Moisture Network (ISMN, cific soil surveys were available for just over 1,000
www.ipf.tuwien.ac.at/insitu). ISMN is a global data- of the stations included in the NASMD (~69% of
base of in situ soil moisture observations, contain- the stations). Soil characteristics for the remain-
ing data from 47 networks and more than 1,900 ing sites were obtained from the NRCS Soil Survey
stations located in North America, Europe, Asia, Geographic Database (SSURGO; Reybold and TeSelle
and Australia (Dorigo et al., 2011). Quiring et al. 1989). SSURGO provides soil texture and hydraulic
(2016) developed the North America Soil Moisture parameter information at multiple column depths
Database (NASMD), which integrated and quali- for the entire contiguous United States. The NASMD
ty-controlled in situ measurements from more than also identified land use and land cover (LULC) at
1,600 stations from 33 networks in North America. each site, based on the land cover classification
These past efforts have focused on the collection, scheme provided by the Environmental Protection
Agency’s National Land Cover Dataset (NLCD)
21NATIONAL COORDINATED SOIL MOISTURE MONITORING NETWORK MAY 2021
Table 2.3: Description of metadata that was included in the North American Soil
Moisture Database for each station. Source: Quiring et al., 2016
Parameter Unit Source(s)
Network name Observation network
Station name Observation network
City Observation network
County Observation network
State Observation network
Latitude Decimal degrees Observation network
Longitude Decimal degrees Observation network
First observation year Observation network
Last observation year Observation network
Temporal sampling frequency Observation network
Land use/land cover Observation network
Number of sampling depths Observation network
Depth of each sample cm Observation network
Percent sand/silt/clay* % Observation network/SSURGO
Soil texture class* Observation network/SSURGO
Saturated hydraulic conductivity* µm s–1 Observation network/SSURGO
Bult density* g cm –3
Observation network/SSURGO
Sampling probe type* Observation network
Elevation ft Observation network
Representative SSURGO polygon SSURGO
*
These parameters are available for all depths at which soil moisture is measured.
2001.10 Approximately 500 sites (approximately
36% of NASMD sites) provided LULC information.
For the remaining sites, LULC was determined
by NASDM staff using either site photos or using
high-resolution satellite imagery such as Google
Earth. Finally, because several authors have con-
cluded that sensor-soil–specific calibration is nec-
essary to obtain a high degree of soil moisture
estimation accuracy (e.g., Evett and Parkin, 2005;
Leib et al., 2003), sensor calibration functions are
sometimes changed in a network. Thus, sensor
change or recalibration dates were included in the
NASMD metadata if these were available from the
observation network.
10
www.epa.gov/mrlc/classification.html
22NATIONAL COORDINATED SOIL MOISTURE MONITORING NETWORK MAY 2021
An artist’s rendering of the Aqua satellite
Chapter 3 containing AMSR-E. Credit: NASA
Modeling & Remote Sensing
3.1 INTRODUCTION are two methods by which spatially continuous
Soil moisture is fundamental to land surface hydrol- soil moisture estimates have been more commonly
ogy in many ways. Importantly, it strongly influ- produced.
ences the partitioning of precipitation into either
runoff or infiltration. Both of these hydrological In this chapter, we review the various methods
variables are very important and play critical roles associated with modeling and satellite remote
in the transport of water at the land/atmosphere sensing. In the area of modeling, most hydrologi-
boundary, including providing water for vegetation, cal models are intrinsically linked to atmospheric
and recharge to the ground water table. The surface circulation models. Precipitation is input to these
runoff constitutes the water in the streams, rivers, models using various sources of observations – rain
and other surface water bodies. Infiltrated water gages, ground-based radars or satellite sensors.
is the source for evapotranspiration, which in turn Models estimate various quantities, for example
reduces soil moisture and allows more soil water to – soil moisture, latent heat flux and streamflow.
infiltrate. These variables are also observed using in situ or
satellite sensors. Data assimilation is the technique
In situ soil moisture monitoring networks are that uses these observations and reconciles their
important in establishing a baseline for observa- differences with the model simulations and then
tions. However, for some applications in hydrology, updates the model states. In this way the model
ecology, weather, agriculture and climate, spatially has been “course-corrected” after the assimilation.
continuous observations are needed. Recent work A model that uses data assimilation typically pro-
has demonstrated that spatially continuous soil duces a better estimate of the land surface states
moisture maps can be produced using data from in compared to a model that does not use data assim-
situ networks combined with digital soil maps and ilation. There are numerous well-calibrated hydro-
radar precipitation estimates (Ochsner et al., 2019). logical models with data assimilation modules that
However, satellite remote sensing and modeling estimate the water and energy balance of the land
23NATIONAL COORDINATED SOIL MOISTURE MONITORING NETWORK MAY 2021
surface at various temporal and spatial scales (Han in two broad categories: physical and abstract. The
et al., 2012; Houser et al., 1998). physical models represent the system on a reduced
scale, while the abstract models represent the link
Since the 1970s, scientists have leveraged the water between the system variables using mathemati-
sensitivity of microwave frequencies to sense soil cal equations, where the variables may be prob-
moisture. The evolution of microwave sensors has abilistic or random depending on the spatial and
come a long way from tower- and truck-mounted temporal behavior of the specific variables. Singh
sensors of the 1970s and 1980s, to aircraft sensors (2017) offers a comprehensive description of some
and finally satellite sensors. Lower microwave fre- of the available water balance models. Depending
quencies such as the L band (1 to 2 GHz) are optimal on physical complexity, assumptions, number of
for monitoring of soil moisture as they are less hydrologic processes captured by the model, and
impacted by the water contained in the vegetation model response or grid unit, the available models
canopy. Both passive (radiometer) and active (radar) can be categorized as a: 1) a simple bucket model, or
sensors have been used. Today, there are numerous bucket with a bottom hole model; 2) a simple water
satellite sensors that offer global soil moisture esti- balance model; 3) the Soil and Water Assessment
mates at different times of the day from space, but Tool (SWAT); and 4) more complex grid-based
the sensing depth is in the near surface, approxi- hydrologic models, (i.e., the Variable Infiltration
mately 5 cm. The assimilation of microwave-based Capacity model (VIC), the Noah model, the Noah-
soil moisture data with hydrologic models is the key Multi Physics (Noah-MP) model, the Community
to offering the most accurate representation of the Land Model (CLM), and the Catchment Land
soil moisture across space and time to date. Both Surface Model (CLSM)). See Table 3.1 (next page)
models and satellite estimates are calibrated and for a general overview of the most commonly used
validated using in situ networks and field experi- models.
ment observations of soil moisture. Together, these
diverse data inputs help us integrate point obser- The bucket hydrologic model represents the sim-
vations with spatial representation of soil moisture plest viable soil water balance model. It typically
for more reliable applications in hydrology, ecology, assumes a single soil layer configuration and
weather, agriculture, and climate. one-dimensional water flow, while ignoring the
impact of vegetation and energy fluxes. Once the
maximum water holding capacity of the soil layer
3.2 LAND SURFACE MODELS is reached, the extra water added to the system
Interest in regional and global soil moisture data- through precipitation is discarded as runoff. The
sets has increased rapidly over the past several bucket with a bottom-hole model adds upward and
decades. One well-established method that permits downward movement of water through the bottom
routine monitoring of soil moisture is applying a of the surface layer. The simple water balance model
land surface water, or water and energy balance, improves the representation of runoff and incor-
approach. Land Surface Models (LSM) represent a porates additional capabilities that simulate snow
compilation of physically- and statistically-based accumulation and snow melt. SWAT, VIC, Noah, CLM,
empirical equations that simulate the flow of water and CLSM are examples of more complex models.
and energy within the soil–vegetation–atmosphere SWAT was developed as an agricultural water man-
transfer continuum and model water and energy agement tool that incorporates numerous models
exchange at the land surface–atmosphere interface. that simulate the complex soil–water–vegetation
The water balance approach applied by LSMs calcu- interactions and processes as well as crop yield and
lates a change in soil water storage (∆S) as the dif- biomass accumulation (Arnold et al., 2012). SWAT
ference between incoming (i.e., precipitation) and is run at a watershed/sub-watershed scale, where
outgoing (i.e., evaporation, runoff and deep ground each basin can be further subdivided to hydrologic
water storage) fluxes of water (Maidment 1992; response units based on dominant land, soil type and
Pitman 2003; Singh 2017). management practice. VIC, Noah, CLM, and CLSM
are multilayer models run at a grid/sub-grid scale
LSMs differ widely with regards to their physical that solve for both the water and energy balance
complexity, assumptions and forcing requirements. and simulate sub-grid heterogeneity in detail. Most
Chow et al. (1988) subdivides hydrologic models models in this tier offer multiple options to simulate
24NATIONAL COORDINATED SOIL MOISTURE MONITORING NETWORK MAY 2021
Table 3.1: Overview of Hydrologic Land Surface Models
LSM Model Basic Characteristics
Bucket with a bottom-hole model • One layer
Two-layer Palmer model • One-way movement of water
• Excess water from precipitation is modelled as runoff
Bucket with a bottom-hole model • Multiple layers
• Two-layer Palmer model • Upward and downward movement of water
Simple water balance model • Improved runoff representation
• Snow-related components
Soil and Water Assessment Tool (SWAT) • Water management tool
• Tools that model numerous hydrologic processes
and account for various hydrologic components (i.e.,
irrigation, snowmelt, evapotranspiration, etc.)
• Allows the simulation of agricultural yield and biomass
Complex Hydrologic models • All hydrologic processes are modelled separately
• Variable Infiltration Capacity Model (VIC) within the soil and snow layers
• Community Land Model (CLM) • Solves for both the water and energy balance
• Catchment Land Surface Model (CLSM) • Multiple soil, canopy and snow layers
• Noah model (Noah) • Multiple options to model the various hydrologic components
• Noah-Multi Physics Model (Noah-MP)
the land, canopy, and snow layers separately (Liang NLDAS-2 soil moisture data have been widely used
et al., 1996; Lohmann et al. 1998a, 1998b; Koster et to support drought monitoring by, for example, the
al. 2000; Liang, Xie, and Huang 2003; Ek et al. 2003; U.S. Drought Monitor (Xia et al., 2014). Such models
Mitchell 2005; Niu et al. 2011). can be additionally constrained by assimilation of
surface soil moisture data available from satellites
Model-based soil moisture datasets are easily as noted previously. For a review of regional and
accessible, and provide temporal continuity (e.g., global land data assimilation systems, see Xia et al.
no missing data compared with in situ observa- (2019).
tions) and continuous spatial distribution. However,
models still have several key limitations including
limited spatial resolution, which is typically defined 3.3 SATELLITE SOIL MOISTURE
by the (often coarse) resolution of the meteoro- Remote sensors are designed to operate at specific
logical forcing parameters used to run the models. regions of the electromagnetic spectrum accord-
In addition, LSM performance and accuracy are ing to their intended application. Sensors intended
highly susceptible to the quality of the forcing data, for surface observations operate at frequencies
where some of the key forcing datasets necessary where attenuation and emission by atmospheric
to run an LSM include precipitation, temperature, gases is low. Sensors intended for global soil mois-
net radiation, humidity, and wind. However, all of ture sensing must also operate where attenuation
these meteorological inputs can now be acquired by vegetation is low, which implies sensing at low
at a global scale using satellite-based technologies. microwave frequencies since vegetation attenua-
The large availability of routinely delivered forcing tion decreases as frequency decreases. Attenuation
data, along with the long-term trend in computa- by clouds and rain is also lower at lower frequen-
tional power, has substantially reduced obstacles cies. The sensitivity of microwave radiation to soil
for operational, large-scale monitoring of soil mois- moisture is governed by the dielectric constant of
ture using LSMs. For example, Phase-2 of the North water, which is greatest at frequencies less than
American Land Data Assimilation System (NLDAS- about 5–7 GHz. For the above reasons, satellite soil
2) routinely produces and distributes 0.125-degree moisture sensors are designed to operate at micro-
resolution North American soil moisture maps11 wave frequencies below ~10 GHz (X-band), and
with a data latency of approximately 3–4 days. preferably close to ~1 GHz (L-band) for highest
11
https://www.emc.ncep.noaa.gov/mmb/nldas/drought/
25You can also read