A study on microstructure and erosion-corrosion performance of Fe-Cr-Ni-B alloy - IOPscience
←
→
Page content transcription
If your browser does not render page correctly, please read the page content below
Materials Research Express

PAPER • OPEN ACCESS

A study on microstructure and erosion-corrosion performance of
Fe–Cr–Ni–B alloy
To cite this article: Da-Wei Yi et al 2020 Mater. Res. Express 7 056520

View the article online for updates and enhancements.

                                This content was downloaded from IP address 176.9.8.24 on 27/05/2020 at 21:58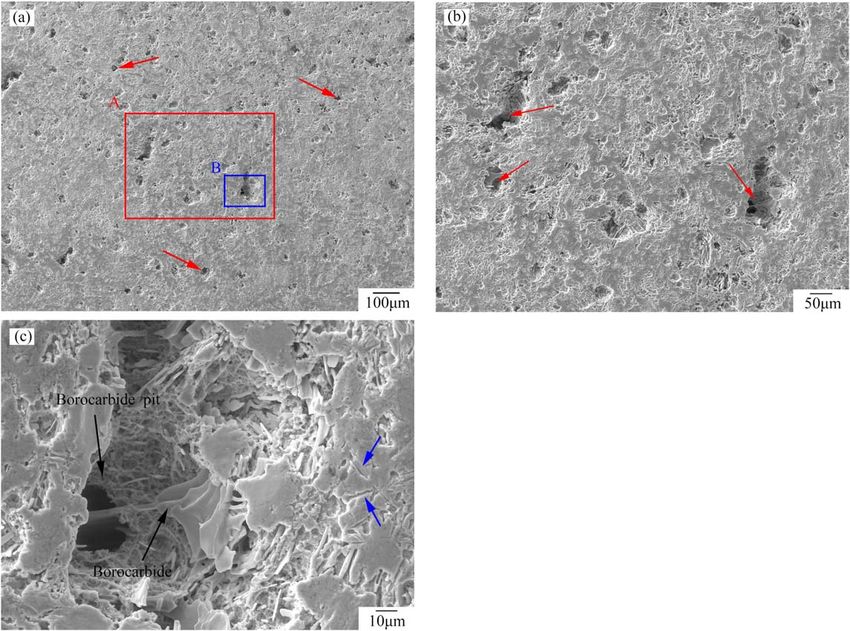
Mater. Res. Express 7 (2020) 056520                                                          https://doi.org/10.1088/2053-1591/ab8feb

                              PAPER

                              A study on microstructure and erosion-corrosion performance of Fe–
OPEN ACCESS
                              Cr–Ni–B alloy
RECEIVED
18 February 2020
                              Da-Wei Yi1, Chong Li1 , Yu-Pu Shi and Jin Chen
REVISED
28 April 2020
                              School of Materials Science and Engineering, Xi’an University of Science and Technology, Xi’an, Shaanxi Province 710054, People’s
                              Republic of China
ACCEPTED FOR PUBLICATION      1
                                Authors to whom any correspondence should be addressed.
4 May 2020
PUBLISHED
                              E-mail: yidawei19820608@163.com and lichong18211028012@163.com
15 May 2020
                              Keywords: Fe–Cr–Ni–B alloy, borocarbides, microstructure, erosion-corrosion

Original content from this
work may be used under
the terms of the Creative     Abstract
Commons Attribution 4.0
licence.                      The microstructure and erosion-corrosion performance of Fe–Cr–Ni–B alloy were studied. The
Any further distribution of   experimental results were analyzed by hardness tester, energy spectrum analyzer, scanning electron
this work must maintain
attribution to the            microscope, X-ray diffraction analyzer. The results show that the Fe–Cr–Ni–B alloy consists of
author(s) and the title of
the work, journal citation
                              martensite and borocarbides [M2(B, C) and M7(B, C)3], and M2(B,C) and M7(B,C)3 borocarbides both
and DOI.                      have more chromium and less nickel than the matrix. After heat treatment, the hardness of the alloy
                              reaches 52.3HRC. For the test alloys, the higher rotating speed test condition results in higher erosion-
                              corrosion weight loss, and the erosion-corrosion weight loss increases first and then decreases with the
                              increase of the impingement angle. Compared with Cr28 high chromium cast iron, in the erosion-
                              corrosion surface of Fe–Cr–Ni–B alloy, the borocarbides are slightly broken, so, the Fe–Cr–Ni–B alloy
                              exhibits excellent erosion-corrosion resistance under the borocarbide protection.

                              1. Introduction

                              High chromium cast iron is widely used in machinery, mining and metallurgy as a wear performance material
                              due to its high hardness, better corrosion performance and excellent oxidation resistance [1–3]. Some scholars
                              have studied the microstructure of high chromium cast iron and its wear performance, getting conclusion that
                              the structure after air-cooled quenching was martensite and M7C3 carbide, and its hardness and wear
                              performance were higher than that of as-cast structure [4]. Simultaneously, Pokusova et al [5] studied the wear
                              behavior of high chromium cast iron, which turned out to be that as-cast high chromium cast iron with austenite
                              as the main matrix (about 40HRC) would work hardening in the wear strain zone, and its wear resistance was
                              better than that of X210Cr12 steel (about 61 HRC). However, Ozdemir et al [6] studied boronizing on pure iron
                              matrix, and found two hard phases of Fe2B and FeB in the boride layer with higher hardness than carbide. Thus,
                              it can be used as a breakthrough in the research of new wear-resistant materials. Besides, Durmuş et al [7] studied
                              the wear resistance of Fe–Cr–B–C coatings. It was revealed that the wear performance was increased due to the
                              formation of massive carbide/boride phases and a tough matrix protected by the high amount of secondary
                              carbides. Wang et al [8] studied the wear resistance of Fe–Cr–B–C hardfacing alloy, and found that its wear
                              resistance increased first and then decreased with the increase of boron content. When B content was 4 wt%, the
                              wear resistance of Fe–Cr–B–C hardfacing alloy increased five times. The wear resistance of the alloy depends not
                              only on the alloy elements, but also on the cooling conditions. Meanwhile, Hornung et al [9] studied the wear
                              resistance of hypereutectic Fe–Cr–C coatings by cooling rate, and found that rapid cooling under impact and
                              wear conditions could improve the wear resistance of the coatings, but the wear resistance of the coatings under
                              erosion-corrosion conditions could not be improved by changing the cooling rate. Recent research results show
                              that the Fe-B alloys have good toughness and excellent wear resistance [10], the service life of Fe-B alloy roll is 8
                              times that of nodular cast iron roll [11], and the service life of Fe-B alloy slurry pump impeller is 1.5 times that of
                              Cr27Mo2Cu impeller [12].

                              © 2020 The Author(s). Published by IOP Publishing Ltd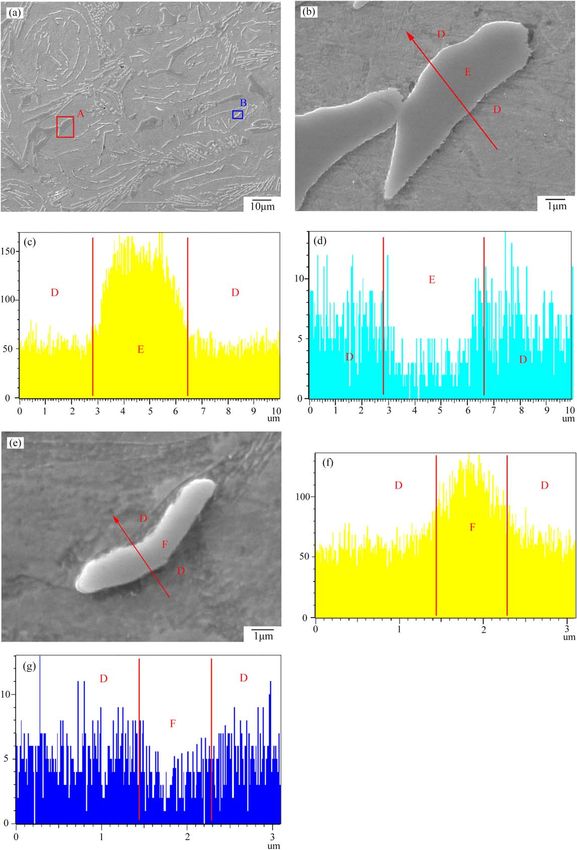
Mater. Res. Express 7 (2020) 056520 D-W Yi et al
Figure 1. Schematics of casting Y test block (a) and erosion-corrosion sample B (b) (unit: mm).
Table 1. Chemical compositions of Fe–Cr–Ni–B alloy (wt%).
Elements C B Cr Ni Si Mn S P Fe
Contents 0.14 1.58 17.12 2.23 0.64 0.61 0.03 0.02 Bal.
Based on the excellent wear resistance of Fe-B alloy, a new erosion-corrosion resistant material Fe–Cr–Ni–B
alloy was developed by adding nickel and chromium elements. The microstructure and erosion-corrosion
resistance of Fe–Cr–Ni–B alloy were studied.
2. Experimental steps
2.1. Casting and heat treatment of samples
The alloy was melted in a 10 kg medium frequency induction furnace in air atmosphere. Pure iron and scrap
steel were added to the furnace. After melting, ferrochrome, ferrosilicon, ferromanganese and pure nickel were
added in turn. Then, the half of the molten alloy was poured into the ladle, the ferroboron was added to the
furnace, and the molten alloy in the ladle was poured into the furnace. When the temperature reached 1630 °C,
the pure aluminum was inserted into the ladle for deoxidation. Finally, the molten alloy was poured into the
sand box to solidify and form the Y test block (figure 1(a)) when the molten alloy temperature dropped to
1490 °C. The test samples were austenized at 1050 °C for 2 h, followed by quenching in Oil. Subsequently, the
test samples were tempered at 280 °C for 4 h. The chemical compositions of the Fe–Cr–Ni–B alloy determined
by optical emission spectroscopy are shown in table 1.
2.2. Microstructure examination
The metallographic sample (sample A in figure 1(a)) whose size was 20×20×10 mm was cut form the Y test
block. The etching solution consisting of 45 ml 4% picral, 5 ml hydrochloric acid and 50 ml 5% nital was used to
corrode the metallographic samples. The x-ray diffraction (XRD), scanning electron microscopy (SEM) and
energy dispersive x-ray spectrometry (EDS) were used to analyze the microstructure and erosion-corrosion
morphology. The XRD analysis was carried on a D/MAX-2400 diffractometer with copper Kα radiation at
40 kV and 30 mA as an x-ray source. The test samples were scanned in a 2θ range from 10 to 90° with an
increment of 0.02° per step. The scanning electron microscopy was a TESCAN VEGAIIXMU model equipped
with an energy dispersive x-ray spectrometry (OXFORD 7718).
2.3. Hardness tests
The hardness of the sample A in figure 1(a) was measured by HRS-150 Rockwell hardness tester at room
temperature. The applied load was 1470 N and the continued time was 10 s. The average value of ten hardness
tests was the measurement result. According to ASTM standard E384-08 [13], the microhardnesses of the matrix
and borocarbide in sample A (figure 1(a)) were measured by microhardness tester (HXD-1000TMC). The
applied loads were 0.49 N (the load for matrix) and 0.98 N (the load for borocarbide), and the continued time
was 10 s. The average of twelve microhardness values was the test result.
2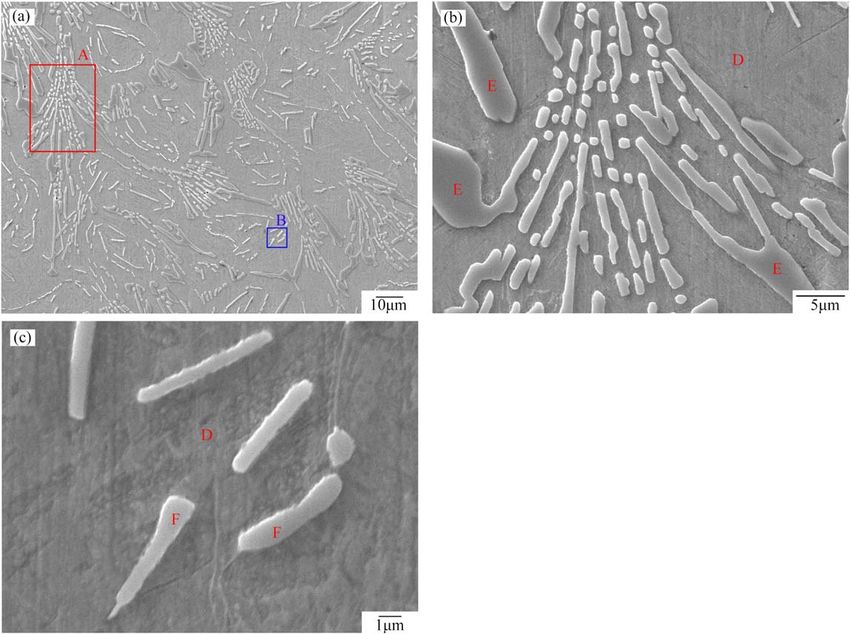
Mater. Res. Express 7 (2020) 056520 D-W Yi et al
Figure 2. Schematic diagram of the erosion-corrosion testing machine.
2.4. Erosion-corrosion tests
The erosion-corrosion performance of Fe–Cr–Ni–B alloy was studied by using erosion-corrosion tester (the
structure was shown in figure 2). Cr28 white cast iron (2.51C-28.13Cr-2.21Mo, wt%, the hardness is 62±0.8
HRC) was used as a comparison material. The geometric size of the erosion-corrosion sample B (figure 1(a)) was
shown in figure 1(b). The erosion-corrosion face (figure 1(b)) of the sample B was polished before the test. The
erosion-corrosion slurry was composed of 8000 ml 2.4% sulfuric acid solution and 3 kg quartz sand (900–1100
HV [14]), and the size of the quartz sand was 0.63±0.11 mm. The distance between the erosion-corrosion
sample B and the mixing wheel center (‘L’ in figure 2) was 80 mm. The rotating speed of the mixing wheel was
1200 rev min−1 and 1700 rev min−1, respectively. The impingement angles were set to 0°, 30°, 45°and 60°
(figure 2), respectively. Each erosion-corrosion test time was 3 h. During the test, the slurry temperature was
kept at 20±1 °C by cooling water. The weight loss of the sample B was measured by an electronic balance, and
the accuracy was 0.1 mg. The average value of three weight losses from three samples was regarded as the test
result.
3. Results and discussion
3.1. As-cast microstructure and hardness
The as-cast microstructures of Fe–Cr–Ni–B alloy are shown in figure 3. The x-ray diffraction spectrum of as-cast
Fe–Cr–Ni–B alloy is shown in figure 4. It can be seen from figures 3(a) and 4 that the as-cast microstructures of
Fe–Cr–Ni–B alloy are composed of matrix and borocarbides [15].
According to the microhardness test values in table 2, it is determined that the matrix of Fe–Cr–Ni–B alloy is
martensite. The borocarbides are distributed in the grain boundary and intragranular. The borocarbide at the
grain boundary is M2(B, C) [16, 17] [as show in figure 3(b), table 2 shows the microhardness of M2(B, C)], which
is in the form of the network. The morphology (figure 3(e)) of M7(B, C)3 borocarbide (the microhardness is
between 1300 HV and 1800 HV [18]) inside the grain is tiny rod-shaped and granular, and this morphology is
different to that of M2(B, C) borocarbide. (For all the borocarbides, M stands for Fe and Cr).
The distributions of the Cr and Ni elements in M2(B, C) (figures 3(b)–(d)), M7(B, C)3 (figures 3(e)–(g)) and
matrix are shown in figure 3. According to figures 3(b)–(g), for M2(B, C) and M7(B, C)3 borocarbides, the
content of chromium in the two types borocarbides is higher than that in the matrix, and the content of nickel in
the two types borocarbides is lower than that in the matrix.
3.2. Heat treatment microstructure and hardness
The heat-treated microstructures of Fe–Cr–Ni–B alloy are shown in figure 5. The microhardness and Rockwell
hardness of Fe–Cr–Ni–B alloy are shown in table 2. According to figure 5 and table 2, the microstructures of
heat-treated Fe–Cr–Ni–B alloy are composed of the martensite matrix and two types borocarbides [M2(B,C) and
3
Mater. Res. Express 7 (2020) 056520                                                                                         D-W Yi et al

   Figure 3. The as-cast microstructures and EDS analyses of Fe–Cr–Ni–B alloy: (a) microstructures of as-cast Fe–Cr–Ni–B alloy; (b)
   showing the morphology of A area: D-matrix, E-borocarbide [M2(B,C)]; (c) and (d) showing the distributions of chromium and nickel
   elements along red arrow in figure (b), respectively; (e) showing the morphology of B area: D-matrix, F-borocarbide [M7(B,C)3]; (f)
   and (g) showing the distributions of chromium and nickel elements along red arrow in figure (e), respectively.

                                                       4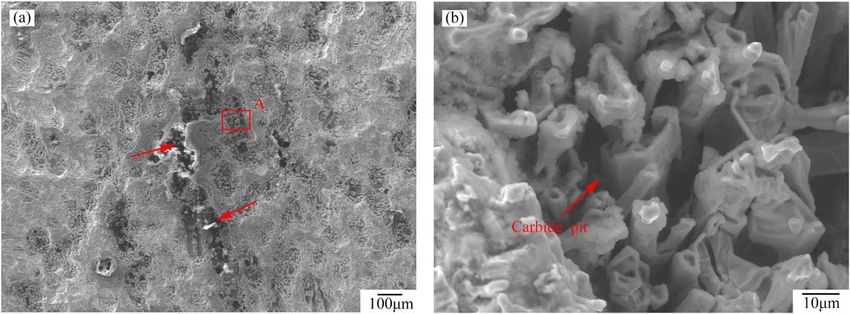
Mater. Res. Express 7 (2020) 056520 D-W Yi et al
Figure 4. X-ray diffraction spectrum of as-cast Fe–Cr–Ni–B alloy.
Table 2. Parameters of the microstructures and properties for as-cast
and heat-treated Fe–Cr–Ni–B alloys: R is corresponding to the
Rockwell hardness (HRC).
Samples Parameters Average Deviation
As-cast Martensite (HV) 523 8
Borocarbide (HV) 1553 17
R 51.4 0.6
Heat-treated Martensite (HV) 536 7
Borocarbide (HV) 1561 15
R 52.3 0.5
M7(B,C)3] (figures 5(b) and (c)). After heat treatment, the morphologies of M2(B,C) and M7(B,C)3 borocarbides
do not change significantly, which indicates that two types borocarbides have strong thermostability.
3.3. Erosion-corrosion performance of Fe–Cr–Ni–B alloy
The erosion-corrosion weight loss data of the Fe–Cr–Ni–B alloy and Cr28 white cast iron (Cr28) at different test
conditions are shown in figure 6. The erosion-corrosion mechanism diagram is shown in figure 7. The
morphologies of the erosion-corrosion surfaces of Fe–Cr–Ni–B alloy and Cr28 samples are shown in figures 8–
10. According to figure 6, the erosion-corrosion weight loss of Fe–Cr–Ni–B alloy is lower than that of Cr28 at the
same erosion-corrosion test conditions.
The hardness of the quartz sand abrasive is regarded as the Ha (Ha=900–1100 HV [14]). In the initial stage of
erosion-corrosion test (figure 7(a)), for the matrix of the Fe–Cr–Ni–B alloy (Hu1=536±7 HV), the ratio of
Hu1/Ha is under 0.8, and the quartz sand is hard abrasive compared to the matrix. So, the abrasive grain can
scratch the matrix (figure 7(a)). However, for the M2(B, C) and M7(B, C)3 borocarbides in Fe–Cr–Ni–B alloy
(Hu2=1561±15 HV and Hu2* = 1300–1800 HV [18] ), the ratios of Hu2/Ha and Hu2*/Ha are above 1.2,
the quartz sand is soft abrasive compared to the two types borocarbides [19]. When the matrix is scratched and
eroded (figure 7(b)), the abrasive grains with high speed can impact exposed borocarbides and break the
borocarbides (figure 7(c)). Corresponding to the above, the hardnesses of the matrix and carbide in Cr28 are
692±11 HV and 1505±15 HV, respectively. So, the abrasive grain can scratch the matrix, and it can make
carbide broken by impact.
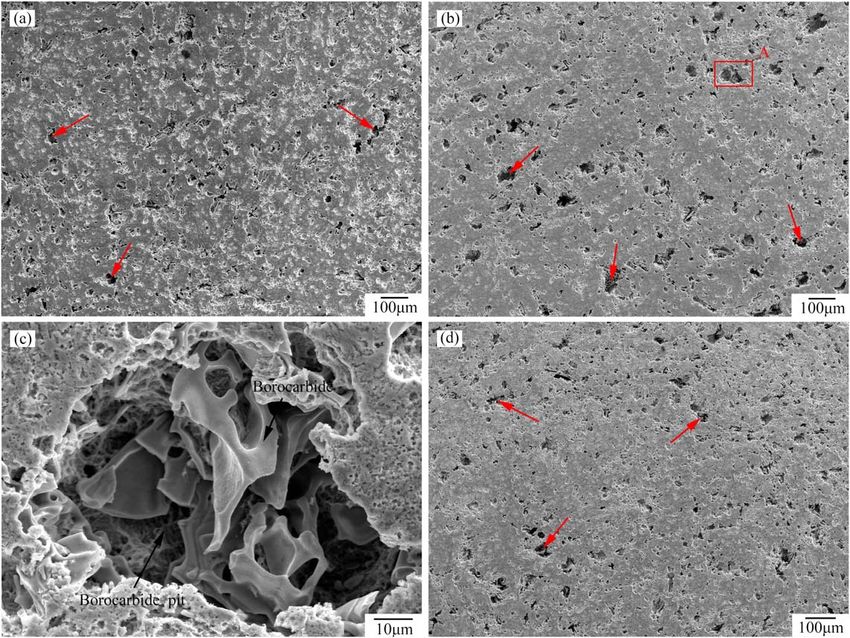
It can be evidenced from figure 8 that the borocarbide pits (red arrows in figure 8(b) and black arrows in
figure 8(c)) and scratch marks (blue arrows in figure 8(c)) are left on the erosion-corrosion surface of Fe–Cr–Ni–
B alloy. Corresponding to the analysis in figure 7 above, the matrix of Fe–Cr–Ni–B alloy is scratched and
corroded by the slurry, which results in the expose of borocarbides. The exposed borocarbides are broken by the
impact of abrasive grains, so the borocarbide pits appear on the erosion-corrosion surface.
The erosion-corrosion weight losses of the Fe–Cr–Ni–B alloy and Cr28 in the high rotating speed (the
rotating speed of the mixing wheel is 1700 rev min−1) test condition are higher than in the low rotating speed
5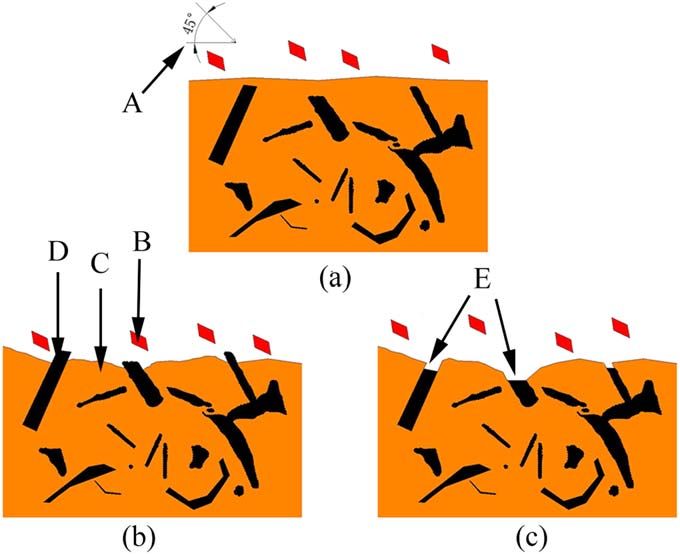
Mater. Res. Express 7 (2020) 056520                                                                                            D-W Yi et al

   Figure 5. The SEM graphs of microstructures in heat-treated Fe–Cr–Ni–B alloy: (a) microstructures; (b) showing the morphology of
   A area in figure (a) : D-matrix, E-borocarbide [M2(B,C)]; (c) showing the morphology of B area in figure (a) : D- matrix, F- borocarbide
   [M7(B,C)3].

   Figure 6. The erosion-corrosion weight loss graph of the Cr28 white cast iron and Fe–Cr–Ni–B alloy.

(1200 rev min−1) test condition (figure 6). For Fe–Cr–Ni–B alloy, compared to the low rotating speed test
condition (red arrows in figure 8(a)), it can be evidenced that the deeper and bigger borocarbide pits (red arrows
in figure 9(b)) are left on the erosion-corrosion surface under the high rotating speed test condition. The mixing
wheel with high rotating speed can raise the slurry flow speed, which can aggravate the matrix damage and the
borocarbides breakage. Thereby, the higher erosion-corrosion weight loss of Fe–Cr–Ni–B alloy appears.

                                                        6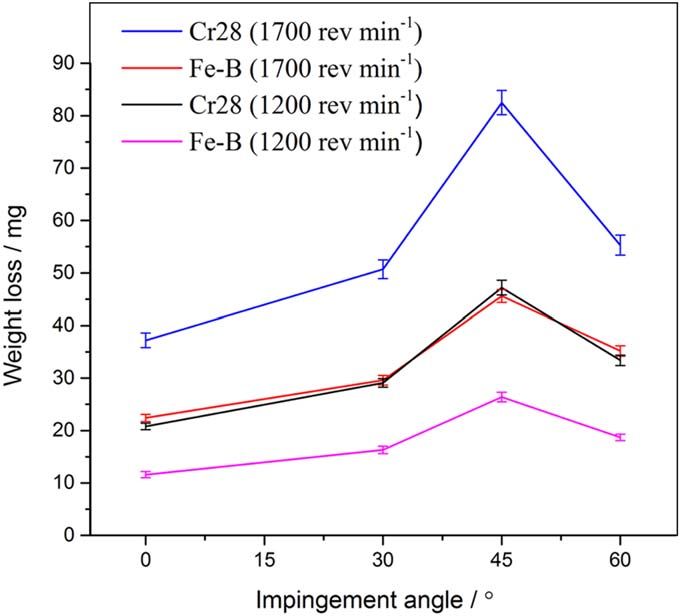
Mater. Res. Express 7 (2020) 056520                                                                                         D-W Yi et al

   Figure 7. The erosion-corrosion mechanism diagram: A-impingement angle, B-abrasive grains, C-matrix, D-borocarbides,
   E-borocar- bide pits.

   Figure 8. The SEM graphs of erosion-corros-ion surface of Fe–Cr–Ni–B alloy: (a) The morphology of erosion-corrosion surface; (b)
   showing the morphology of area A in figure (a); (c) showing the morphology of area B in figure (a); for erosion-corrosion test
   conditions, the impingement angle is 45°, and the rotating speed of the mixing wheel is 1200 rev min−1.

    The erosion-corrosion weight losses of the Fe–Cr–Ni–B alloy and Cr28 first increase and then decrease with
the increasing of the impingement angle (0°, 30°, 45°and 60°), and they reach maximum at impingement angle
of 45°. For Fe–Cr–Ni–B alloy, compared with impingement angle of 0° and 60° (red arrows in figures 9(a) and
(d)), It is evident that a larger amount of borocarbides are broken, and more pits are left on the erosion-
corrosion surface (red arrows in figure 9(b) and black arrows in figure 9(c)) under impingement angle of 45°. It

                                                       7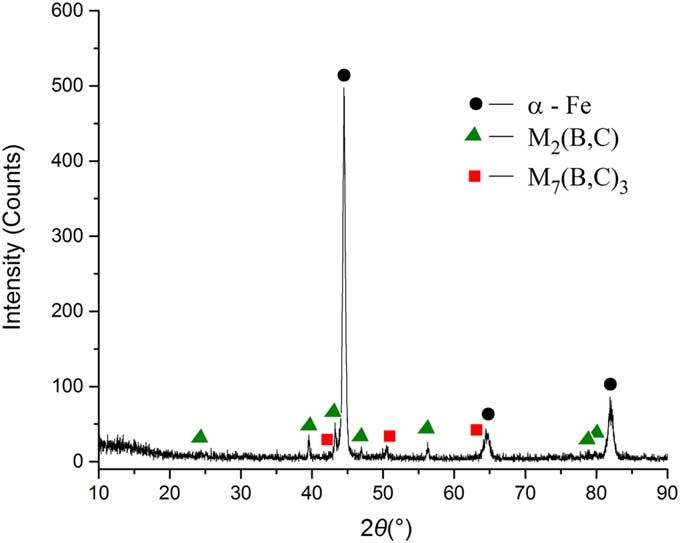
Mater. Res. Express 7 (2020) 056520                                                                                                D-W Yi et al

   Figure 9. The SEM graphs of erosion-corrosion surfaces of Fe–Cr–Ni–B alloy samples. (a, b, d): the impingement angles are 0°, 45°
   and 60°, respectively; (c): the morphology of area A in figure (b); for erosion-corrosion test condition, the rotating speed of the mixing
   wheel is 1700 rev min−1.

   Figure 10. The SEM graphs of Cr28 sample: (a) showing the morphology of erosion-corrosion surface; (b) showing the morphology of
   area A; for erosion-corrosion test condition, the impingement angle is 45°, and the rotating speed of the mixing wheel is 1700 rev
   min−1.

can be concluded that the solid particles have the most serious damage ability to the erosion-corrosion surface
under the impingement angle of 45°.
    It can be seen from figure 6 that the erosion-corrosion weight losses of Cr28 are higher than these of Fe–Cr–
Ni–B alloy in the same erosion-corrosion test conditions. Corresponding to the above results, compared with
the Fe–Cr–Ni–B alloy (figure 9(b)), the deeper and bigger carbide pits (red arrows in figures 10(a) and (b))
appear on the erosion-corrosion surface of the Cr28 sample. Compared with the Fe–Cr–Ni–B alloy, the matrix
of Cr28 is corroded more seriously by slurry, and a large number of the carbides are broken. To sum up, the Fe–
Cr–Ni–B alloy exhibits better erosion-corrosion resistance than Cr28.

                                                          8
Mater. Res. Express 7 (2020) 056520 D-W Yi et al
4. Conclusions
(1) The Fe–Cr–Ni–B alloy is composed of martensite and borocarbides. The borocarbides are distributed in the
grain boundary [network M2(B,C) borocarbide] and intragranular [tiny rod and granular M7(B,C)3
borocarbide]. The contents of chromium and nickel in the borocarbides are different from these in the
matrix.
(2) The erosion-corrosion weight losses of Fe–Cr–Ni–B alloy and Cr28 first increase and then decrease with the
increasing of the impingement angle (0°, 30°, 45°and 60°), and they reach the maximum value at 45°
impingement angle. For Fe–Cr–Ni–B alloy, the Cr28 is eroded and corroded more seriously at the same test
condition, so Fe–Cr–Ni–B alloy exhibits better erosion-corrosion resistance.
Acknowledgments
This work was financially supported by the National Natural Science Foundation of China under grant (No.
51705414) and Natural Science Basic Research Plan in Shaanxi Province of China under grant (No.
2020JM-516)
ORCID iDs
Chong Li https://orcid.org/0000-0002-7593-8226
References
[1] Gahr K H Z and Eldis G T 1980 Abrasive wear of white cast irons Wear 64 175–94
[2] Li X L, Zhou X J, Xie W L and Ma Y P 2015 Influence of alloying on phase precipitation of high chromium cast iron Heat Treat. Met. 40
78–81
[3] Liu Z, Wang Y Q and Gao J Y 2006 Development and production of Cr26 Hi-chromium white cast iron Special Cast Iron 26 28–32
[4] Wang Y J, Song B L, Wei S C, Sheng Z Q, Zhang P, Huang Y W and Huang W 2018 Effect of carbon content and heat treatment process
on microstructure and wear resistance of high chromium cast iron Heat Treat. Met. 43 30–4
[5] Pokusová M, Brúsilová A, Šooš Ľ and Berta I 2016 Abrasion wear behavior of high-chromium cast iron Arch. Foundry Eng. 6 69–74
[6] Ozdemir O, Usta M, Bindal C and Ucisik A H 2006 Hard iron boride (Fe2B) on 99.97 wt% pure iron Vacuum 80 1391–5
[7] Durmuş H, Çömez N, Gül C, Yurddaşkal M and Yurddaşkal M 2018 Wear performance of Fe–Cr–C–B hardfacing coatings: dry sand/
rubber wheel test and ball-on-disc test International Journal of Refractory Metals& Hard Materials 77 37–43
[8] Wang Z H, Wan G L, He D Y, Jiang J M and Cui L 2014 Microstructure and wear resistance of Fe–Cr–B–C surfacing alloy Journal of
Material Engineering 4 57–62
[9] Hornung J, Zikin A, Pichelbauer K, Kalin M and Kirchgaßner M 2013 Influence of cooling speed on the microstructure and wear
behaviour of hypereutectic Fe–Cr–C hardfacings Materials Science & Engineering A 576 243–51
[10] Guo C Q and Gao S Z 2004 New Fe-base wear-resistant material FCB alloys Foundry 53 761–4
[11] Bruce H, Hertzman S and Lehtinen B 1999 Case Study of Different Cobra Rolls Metallographic Study of Impact Samples Project Status
Report-2 (Stockholm: Swedish Institute for MetalsResearch) pp. 1–11
[12] Chrisodoulou P, Graham E and Griffiths J R 1995 Development of Iron-Boron Alloys as High-Performance Cost-Effective Tooling
Materials (Brisbane: CSIRO Division of Manufacturing Technology) pp. 1–140
[13] American Society for Testing and Materials 2008 Standard Test Method for Microindentation Hardness of Materials (West
Conshohocken)
[14] Li Y F and Gao Y M 2010 Three-body abrasive wear behavior of CC/high-Cr WCI composite and its interfacial characteristics Wear 268
511–8
[15] Fu H G, Li Z H, Lei Y P, Jiang Z Q and Xing J D 2009 Structural variations in heat treated B-bearing stainless steel Mater. Des. 30 885–91
[16] Ma S Q, Xing J D, Liu G F, Yi D W, Fu H G, Zhang J J and Li Y F 2010 Effect of chromium concentration on microstructure and
properties of Fe-3.5B alloy Materials Science & Engineering A 527 6800–8
[17] Liu Z L, Chen X, Li Y X and Hu K H 2008 Effect of chromium on microstructure and properties of high boron white cast iron
Metallurgical & Materials Transactions A 39 636–41
[18] Chen H H et al 2006 Handbook for the Application of Wear Resistant (Beijing: Mechanical Industry Press) pp. 253–5
[19] Richardson R C D 1967 The wear of metals by hard abrasives Wear 10 291–309
9You can also read