Guardians of NZ Superannuation and New Zealand Superannuation Fund 2017-18 Review - NZ Super Fund
←
→
Page content transcription
If your browser does not render page correctly, please read the page content below
TITLE:

Guardians of NZ Superannuation and
New Zealand Superannuation Fund

2017-18 Review

AUTHOR:

Catherine Savage                  Matt Whineray
CHAIR                             CEO

EVENT | PRESENTATION:
Finance & Expenditure Select Committee, 20 February 2019
Agenda Our role and mandate Investment approach Investing in New Zealand Benchmarking Performance Outlook Scenario: • Re-occurrence of the GFC
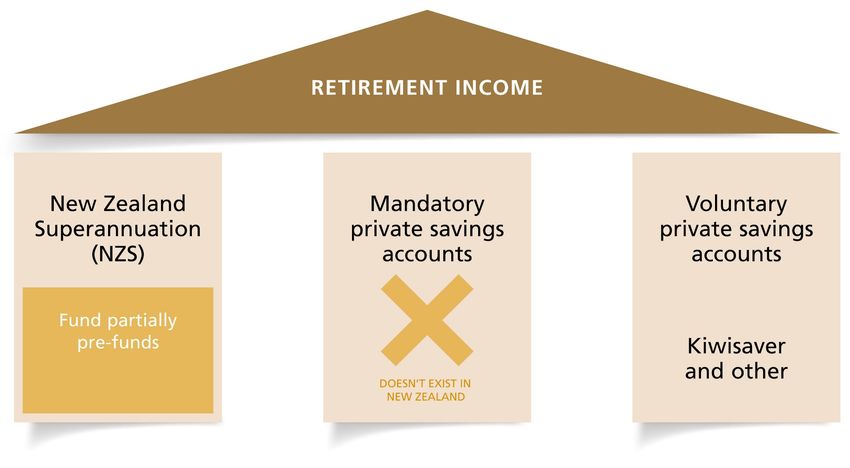
Where we fit in – part prefunding Tier 1
Tier 1 Tier 2 Tier 3
The NZ Super Fund is expected to pre-pay approximately 20% of NZ superannuation costs by 2040
Contributions were suspended from July 2009 and restarted in December 2017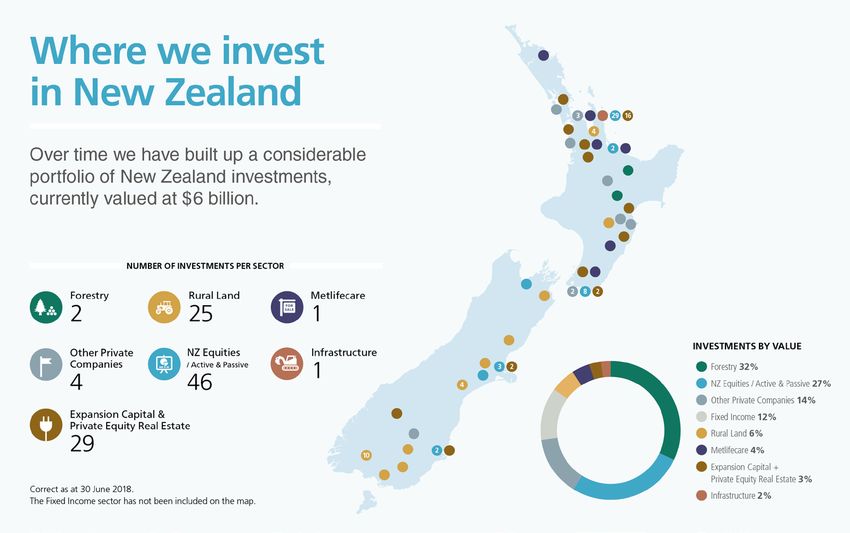
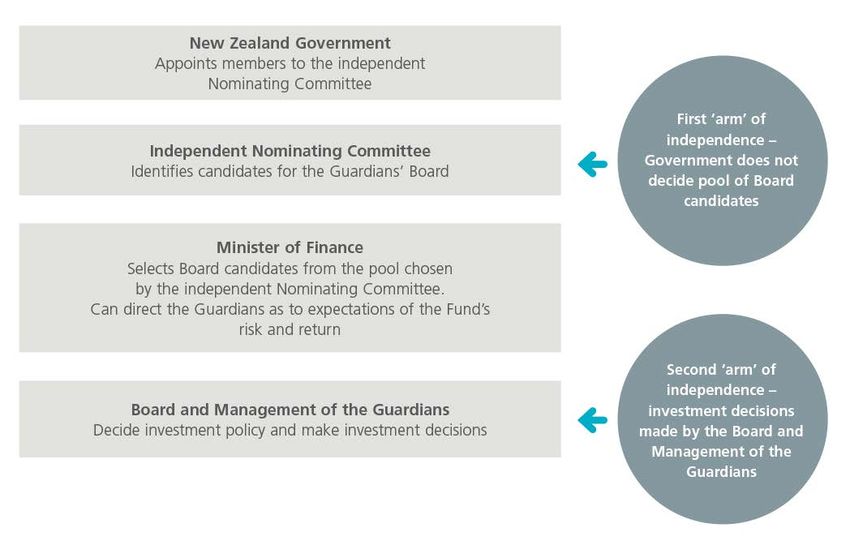
Governance framework The Guardians of NZ Superannuation is an autonomous Crown entity, legally separate from the Crown, and operates at double arms’ length from Government The Guardians manage and administer the Fund. The Fund is the pool of Crown assets
Mandate
Mandate (Act of Parliament):
– The Guardians must invest the Fund on a prudent, commercial basis and
must manage it in a manner consistent with:
• Best-practice portfolio management;
• Maximising return without undue risk to the Fund as a whole; and
• Avoiding prejudice to New Zealand's reputation as a responsible member
of the world community.
Investment approach
We look to utilise the Fund’s liquidity profile, long-term investment
horizon and governance strength
We construct a portfolio that balances our highest estimated return with
financial risk the best likelihood of success
– First capital withdrawals not currently scheduled until 2034-35
– Strong weighting towards growth assets (because we can ride out short-
term volatility)
Principles and advantages of long-term investment:
– A clear purpose + long horizon, highly liquid, operationally independent
– Discipline and capacity to stay the course - governance
– Transparency and clear communication with stakeholders
– Focus on best-practice, including environmental, social and governance
(ESG) factors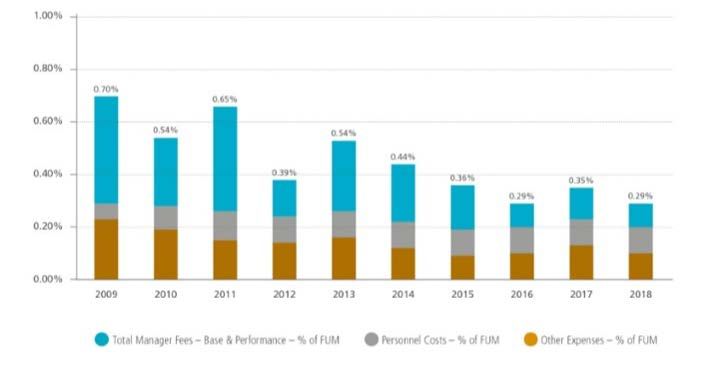
Investing in New Zealand
Ministerial Directive (2009)
– “…that opportunities that would enable the Guardians to increase the allocation of New Zealand
assets in the Fund should be appropriately identified and considered…”
– “This direction is not intended to be inconsistent with the Guardians’ duty to invest the Fund on a
prudent commercial basis, in accordance with section 58 of the Act, and the above paragraph is
subject to that duty.”
As at 31 December 2018, $5.8 billion was invested in New Zealand, 16.2% of
Funds Under Management - if the Fund had a passive approach to investing it
would hold 0.1% in NZ assets
The Fund is one of the largest institutional investors in NZ and plays a
significant role in NZ’s capital markets
Investments include Kiwibank, Datacom, Fidelity Life, NZ Gourmet, Kaingaroa
Timberlands, Metlifecare, NZ dairy farms, housing, NZ equities and (via
external managers) in expansion capital and infrastructure
Our NZ Direct investment team has set up an Investment Hub to drive
domestic deal flow in NZ by leveraging our experience and advantages – this
includes working towards partnerships with Māori investment organisations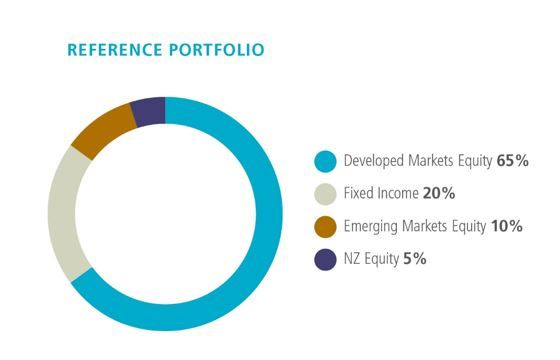
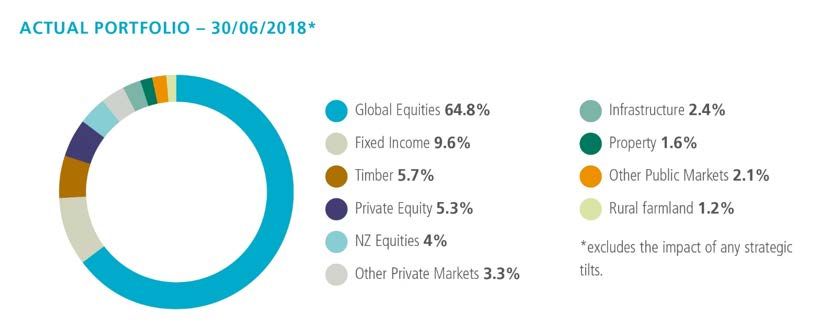
Investing in New Zealand As at 30 June 2018 around 2% of the Fund’s $6 billion New Zealand investment portfolio was invested in infrastructure. Infrastructure is an appealing investment because of its attractive, consistent returns and yield, defensive characteristics, and diversification benefits. In May last year the Fund, together with CDPQ Infra, made an unsolicited proposal to the Government, offering to invest in the Auckland Light Rail project. Our preferred procurement model is the Public-Public Investment (PPI) model. PPI is a model where a public investor and the Government form a partnership to take joint equity interest in a major project. The public investor, in this case NZSF/CDPQ, assumes end-to-end responsibility for the project and the vast majority of its risk. We have pitched to be involved in the Government’s KiwiBuild scheme, and are currently exploring investment opportunities in large scale housing infrastructure development and modular/pre-fabricated housing.
Investing in New Zealand
Benchmarks
We benchmark against best practice industry principles, measures
and relevant global peer funds
                 Internal measures and        External measures                        Stakeholder engagement
                 mechanisms
Cost structure   By business unit             CEM Benchmarking Survey
                 By investment opportunity    Hay remuneration database
                 Holistic view of fees
Governance       Reference Portfolio Review   Independent Reviews ‘04, ’09, ’14, ‘19
                                                                                       Peer fund engagement:
                 Internal Audit               (in process)
                                                                                       • 3Cs: Comparison,
                                              OAG special performance audit (‘08)
                                                                                         collaboration and co-
                                              SWF GAAP
                                                                                         investment
                                              Select Committee Reviews
Performance      NZ T Bill rate + 2.7%        Performance against both measures        Global expertise
                 Reference Portfolio + 1.0%   published monthly
Transparency     Website                      Sovereign Wealth Institute’s
                 Annual Report                Transparency Index
                 OIA
Responsible                                   UNPRI assessments
Investment
Risk             Risk Committee Reviews       CEM Benchmarking Survey
                 Risk Registers
                 Investment Risk Limits
                 Target Liquidity Level
Reference + Active = Actual Portfolio Growth-oriented portfolio, majority passive, highly diversified
Performance
Performance as at 31 December 2018             Last 10 years                          Since inception

Contributions received                         $2.37 billion                          $15.88 billion

Returns (after fees and foreign tax,           $28.15 billion                         $27.98 billion
and before NZ tax)

NZ tax (paid) / received*                      $(5.07) billion                        $(6.39) billion

Other movements**                              $0.07 billion                          $(0.05) billion

Closing Fund balance as at 31
December 2018                                                            $37.42 billion

* Tax ‘received’ covers any instances of refunds for overpayment of tax
** Other movements relate to transactions other than tax paid or received e.g. tax expense, movements in reserves
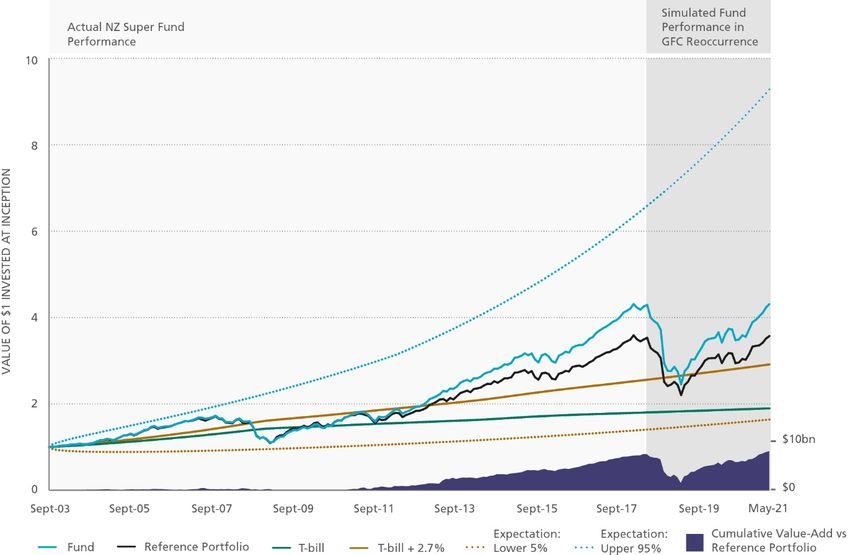
Performance
 This graph shows what has happened to the first dollar invested in the
 Fund over time.
                   4.8

                   4.3
                                                                                                       Exceeded
                   3.8                                                                                 Reference
                                                                                                       Portfolio by
 Value over time

                                                                                                       $7.7b
                   3.3                                                                                 (1.56% pa)       Exceeded
                                 Global financial                                                                       Treasury
                   2.8           crisis                                                                                 Bills by
                                                                                                                        $21.0 b
                   2.3                                                                                                  (5.67% pa)
                                                                                                                                        Total
                   1.8                                                                                                                  Fund
                                                                                                                                        Returns
                                                                                                                                        $27.98b
                   1.3
                                                                                                                                        (9.65%
                                                                                                                                        pa)
                   0.8
                                                                                                       Reference Portfolio return - the best
                                                                                                       passive, listed “market” return that would
                                                                                                       achieve the Fund’s objectives over time
                         Fund   T-Bill       Long-term Performance Expectation   Reference Portfolio
                                                                                                       Treasury Bill return - a measure of the
                                                                                                       cost to the Government of contributing to
                                                                                                       the Fund instead of paying down debt
Cost CEM (Cost Effectiveness Management) Benchmarking is the global leader in benchmarking pension and sovereign wealth funds CEM’s latest report found our net value-add was above the median of our peers and costs were below the median – both for the 12 months to December 2017 and over the five year period The Fund’s costs as a percentage of assets have reduced over time This has been driven by a reduction in manager fees and advisor costs, offset by increased performance fees and personnel costs (in- sourcing decision making)
Global peer engagement Systematic programme of engagement with peer funds: Compare, collaborate, co-invest Hosted the International Forum of Sovereign Wealth Funds in New Zealand in November 2016 These activities are designed to mitigate the distance and scale challenges inherent in running a (comparatively small) global investment Fund from New Zealand – ensuring we operate at global best practice standards
ESG integrated into the investment process

                                         Investment
                                          Selection
 Environmental, social and
 governance factors,
 including climate change,
 are integrated into the
 investment process

 As share owners, we
 manage ESG through
 collaboration, engagement
                                         ESG
 and, in some cases,
 exclusions                     Due
                                                      Ownership
                             Diligence

 Our performance on ESG is
 measured through global
 benchmarking
Climate change is an investment risk
CLIMATE CHANGE INVESTMENT WORKSTREAMS
RISK STRATEGY
REDUCE
GOAL A portfolio more resilient to climate- Reduce exposure to fossil fuel reserves
related risks. and carbon emissions.
TARGETS By 2020: to reduce the carbon
emission intensity of the Fund by at
least 20%; and reduce the carbon ANALYSE
reserves of the Fund by at least 40%. Incorporate climate change into investment analysis
PRINCIPLES and decisions.
1 — Whole portfolio
Manage climate risks and
opportunities of the whole portfolio.
2 — Consistency ENGAGE
Be as consistent as we can across all Manage climate risks by being an active owner
investments (listed and unlisted; through voting and engagement.
active and passive).
3 — Best tools
SEARCH
Use the full range of tools available Actively seek new investment opportunities, for
to us. There is no single solution. example in renewable energy.Climate strategy implementation Reduce, Analyse, Engage, Search At the end of June 2017 NZ$950 million was moved away from companies with high exposure to carbon emissions and reserves into companies with lower carbon risk Based on a bespoke carbon measure for listed equities developed in partnership with MSCI ESG We continue to hold some companies with carbon exposure where they are engaging and managing the risks We may continue active investments in companies with carbon exposure Not an exclusions strategy Carbon exposure was highly concentrated in a relatively small group of companies. In 2017/18 our focus turned to reducing the carbon exposure of the Fund’s actively managed equity holdings. A low carbon approach was implemented within the Fund’s emerging markets equities mandates.
Outlook Over the long term we expect average returns of approximately 8% a year, based on current portfolio settings Fund continues to be strongly weighted to growth assets – we are prepared to weather short-term volatility for a better long-term return The Fund’s advantages (our endowments) – long-term horizon, known liquidity, operational independence and Crown ownership – give important advantages as an investor Operationally, we are focused on: – Fewer, deeper relationships with external investment managers – Increased direct investment where we have an advantage, including in NZ – Scalability and efficiency as the Fund continues to grow in size
In a market downturn Given the level of market exposure chosen, the Fund may suffer large financial losses in a market crisis. It is largely unavoidable that a growth-orientated portfolio such as the Fund will fall in these periods. By taking on the market risk associated with growth assets, the Guardians accepts the risk that markets may experience sharp drops in value. In the event of a market drawdown, the active strategies may add or subtract value to the Fund. However, in return for taking this market risk, the Fund will earn higher returns in the long-run. The Fund is well-placed to wear such losses, as there is no immediate need to withdraw capital from it. Short-term losses can be treated as “paper losses” with little long-term ramifications for the Fund’s ability to fulfil its purpose.
Scenario: re-occurence of the GFC
The graph shows the simulated NZ Super Fund performance if the
Global Financial Crisis (GFC) period returns were to reoccur.

Note: the Guardians regards this as an “extreme” shock to the portfolio, and only expects such an event to occur once in every 50-
100 year period.
Scenario: re-occurence of the GFC From peak to trough (a ten-month period), we estimate the Fund would lose $20.3bn (-52.6%) in a repeat of the GFC. The notional Reference Portfolio benchmark would fall by -44.7%. The Fund expects to recoup any investment losses in a GFC scenario over a recovery period – although we can’t know how long this would be The GFC was characterised by both an unusually sharp drawdown and rapid recovery in financial market values – the fund recovered portfolio losses within 20 months This is a relatively rare occurrence; recoveries from significant market crises can often take longer than this. The Guardians believe that equity markets eventually mean-revert to higher fair values following transitory periods of crisis. The Guardians believes that short-term losses tend to be temporary and less material for a long-term investor. This belief relies, however, on stakeholder support for staying the course through periods of poor performance.
You can also read