Abstract Tailoring Body Mass Index for Prediction of Obesity in Young Adults: A Multi-Centric Study on MBBS Students of Southeast India - Cureus
←
→
Page content transcription
If your browser does not render page correctly, please read the page content below
Open Access Original
                              Article                                                   DOI: 10.7759/cureus.12579

                                             Tailoring Body Mass Index for Prediction of
                                             Obesity in Young Adults: A Multi-Centric Study
                                             on MBBS Students of Southeast India
                                             Swikruti Behera 1 , Alpana Mishra 2 , Angeleena Esther Sr. 2 , Ayaskant Sahoo 3

                                             1. Physiology, NRI Institute of Medical Sciences, Visakhapatnam, IND 2. Community Medicine, Kalinga Institute of
                                             Medical Sciences, Bhubaneswar, IND 3. Anaesthesia, NRI Institute of Medical Sciences, Visakhapatnam, IND

                                             Corresponding author: Alpana Mishra, alpana.mishra84@yahoo.com

                                             Abstract
                                             Introduction: Body mass index (BMI) has been used for a long period as a surrogative measure for obesity.
                                             But BMI does not differentiate between fat and nonfat tissue (blood, bone, and muscle) due to which it is not
                                             considered accurate anymore. But since BMI is easier to estimate and used widely for assessment of obesity,
                                             it is better if it is re-standardized according to the body fat percentage (BFP) of a specific population,
                                             community, and their ethnicity.

                                             Objective: To estimate and propose the BMI cut-off values in young Indian population especially MBBS
                                             students taking BFP as a standard.

                                             Design: This is a cross-sectional study. Anthropometric data (age, gender, height, weight, waist
                                             circumference, and hip circumference) were collected from the participants after taking consent. BMI was
                                             calculated using Quetelet’s Rule. BFP was estimated using Omron Body fat Monitor (HBF 385). It measures
                                             the BFP by the bioelectrical impedance (BI) method. Data were analyzed with appropriate statistical tests
                                             and receiver operating curve (ROC) curves were drawn to find the cut-off values of BMI to determine obesity.

                                             Setting: The present study is a multi-centric study conducted in four medical colleges (two in each state;
                                             Odisha and Andhra Pradesh, India).

                                             Participants: Apparently healthy MBBS students aged 18-24 years were included in this study. Students
                                             having any chronic or acute illnesses were excluded from the study. Out of 904 students contacted from four
                                             medical colleges, 863 (430 males and 433 females) consented and participated.

                                             Results: Some 863 MBBS students have participated in this study. After adjusting for age, BMI was found to
                                             be higher in males. BMI was found to be 29.33 for males and in females it was 29.06. BFP was higher in
                                             females (34.23) as compared to males (20.77). Waist hip ratio was found to be higher in females (0.92) than in
                                             males (0.84). Whereas, fat free mass (FFM) and fat free mass index (FFMI) are higher in males, i.e., 56.24 and
                                             18.48 respectively. Most appropriate cut-off value for obesity on ROC curve was found to be 22.09
Review began 12/03/2020
                                             (sensitivity 84.5%, specificity 83.46%) in males and that of females was 23.73 (sensitivity 85.26, specificity
Review ended 12/18/2020
Published 01/08/2021
                                             81.23). Whereas, the conventional cut-off of 25 for males had sensitivity of only 46% and that of females was
                                             70.5%. For total population BMI cut-off value was found to be 22.2 with 81% sensitivity and 74% specificity.
© Copyright 2021
Behera et al. This is an open access
article distributed under the terms of the    Conclusion: We propose the cut-off value for overweight/obesity in males to be 22.09 kg/m 2 and for females
Creative Commons Attribution License
                                             to be 23.73 kg/m2 in young adult Indian population. These values were found to have more sensitivity and
CC-BY 4.0., which permits unrestricted
use, distribution, and reproduction in any   specificity than current BMI cut-off value.
medium, provided the original author and
source are credited.

                                             Categories: Preventive Medicine, Public Health, Epidemiology/Public Health
                                             Keywords: young adults, body fat percentage, body mass index: bmi, roc curve, waist hip ratio, obesity, overweight

                                             Introduction
                                             Overweight and obesity are rapidly escalating problems in developing countries. But obesity has reached
                                             epidemic proportions worldwide and has more than doubled since 1980. According to the World Health
                                             Organization (WHO) report [1], in 2016, 1.9 billion adults 18 years and older were overweight, having a BMI
                                             greater than 25 kg/m2. Obesity is one of the important causes for increased incidence of noncommunicable
                                             diseases like diabetes, hypertension, etc. We have been using body mass index (BMI) as the identifying
                                             marker for obesity since long as it is more convenient and requires minimal equipment. But BMI does not
                                             discriminate between fat and fat free mass (muscle, blood, bone, and water). To estimate abdominal obesity,
                                             many studies have used anthropometric measurements such as waist circumference or waist-to-hip ratio
                                             (WHR) [2-3].

                              How to cite this article
                              Behera S, Mishra A, Esther A, et al. (January 08, 2021) Tailoring Body Mass Index for Prediction of Obesity in Young Adults: A Multi-Centric Study
                              on MBBS Students of Southeast India. Cureus 13(1): e12579. DOI 10.7759/cureus.12579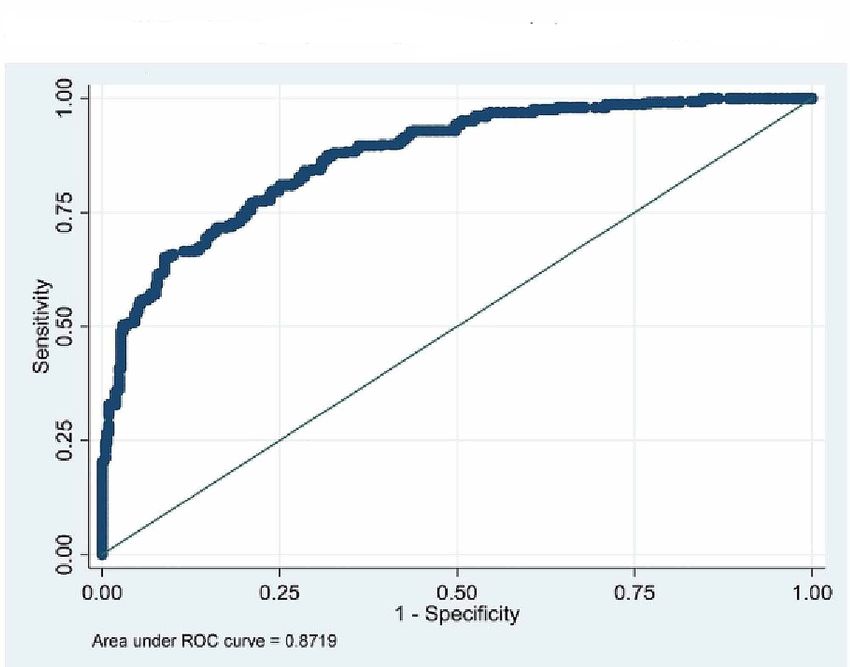
Overweight and obesity are defined as abnormal/excessive fat accumulation that presents a risk to health [4].
                                                 It is the accumulation of body fat that puts the person at risk for many serious medical conditions including
                                                 heart disease, diabetes, and even certain forms of cancer. Measuring the fat percentage is the more accurate
                                                 method for assessing the fatness and obesity rather than assessing it by using BMI which does not
                                                 differentiate between fat and muscle [5-6]. Fat percentage limits are different for males and females as they
                                                 have different physiology. Having said that, measuring the fat percentage accurately is not easily done and
                                                 certainly not without equipment so it is always more practical to use BMI which is adjusted according to the
                                                 population, community, and ethnicity.

                                                 The rigors of education are stressful for many students in the present scenario. Young students have to deal
                                                 with high academic demands, social changes, living away from home, busy schedules, eating unhealthy food
                                                 without parental monitoring, and not maintaining a proper exercise routine. This is reflected by weight gain
                                                 and declining fitness levels [7]. This not only has deleterious effects on physical well-being: stress-induced
                                                 neglect of proper nutrition and lack of sufficient physical activity but also can be detrimental to students’
                                                 mental health and social well-being in the long run.

                                                  World is a diverse place with a lot of ethnic and cultural variations. Owing to diverse culture, eating habits
                                                 and environmental condition, the body composition can vary from one country to another. Hence, BMI
                                                 should be customized according to ethnicity and race.

                                                 The aim of this study is to analyze and standardize the BMI cut-off values in young Indian population
                                                 especially MBBS students taking body fat percentage (BFP) into consideration.

                                                 Materials And Methods
                                                 This multi-centric study was carried out in four medical colleges situated in two states (Odisha, Andhra
                                                 Pradesh) of India. Participants (both males and females) were enrolled in this study from four Medical
                                                 Colleges of different cities in South and eastern part of India; namely, Berhampur, Bhubaneswar (Odisha),
                                                 Vishakhapatnam, and Amalapuram (Andhra Pradesh). Sample size was calculated considering prevalence of
                                                 obesity and overweight as 27% from previous study [8] and 4% allowable error (with design effect of 1.7). The
                                                 sample was equally divided among four sites out of which 836 students have consented and participated in
                                                 the study. Data were collected from June 2012 to June 2017 after obtaining due approval from Institutional
                                                 Ethical Committee. This is a cross-sectional study which was conducted on young adults (aged between 18
                                                 and 24 years) studying MBBS in Medical Colleges.

                                                 The study subjects were explained about the purpose of the study and were assured about the confidentiality
                                                 and anonymity of the information shared. Data were collected from the selected samples after written
                                                 consent was obtained from respondents. Information regarding socio-demographic profile and
                                                 anthropometric parameters were collected.

                                                 Height was measured using a stadiometer (Prestige & IS IndoSurgical) to the nearest of 0.1 cm. The
                                                 participant stood on the stadiometer without shoes with scapula, buttocks, and heels touching the vertical
                                                 bar, the neck held in a natural nonstretched position, the heels were touching each other, and the head was
                                                 held straight with the inferior orbital border in the same horizontal plane as the external auditory meatus
                                                 (Frankfurt's plane).

                                                 Body weight and BFP were assessed using OMRON HBF-385 (Karada scan), Krell Precision (Yangzhou Co.
                                                 Ltd., Yangzhou, PR China). Pre-standardization of the instrument was done. OMRON HBF-358-BW
                                                 measures the BFP by the bioelectrical impedance (BI) method. Muscles, blood vessels, and bones are body
                                                 tissues with a high-water content that conducts electricity easily. Body fat is a tissue that has little electrical
                                                 conductivity. The HBF-358-BW sends an extremely weak electrical current of 50 kHz and less than 500 μA
                                                 through your body to determine the amount of fat tissue. This weak electrical current is not felt while
                                                 operating the HBF-358-BW. After entering the age, gender, and height of the subject in the settings, the
                                                 participant was asked to stand barefooted on the unit with feet parallel and placed on the metal footplates.
                                                 After the bodyweight is displayed, the handheld unit should be held firmly with finger wrapped around the
                                                 plates in both palms and arms are extended at an angle of 90° to the body which should be kept straight at all
                                                 times during measurement [9].

                                                 Waist and hip circumference were measured using a stretch-resistant measuring tape. Measurement for
                                                 finding out hip circumference was taken from the maximum perimeter of the buttocks. The waist
                                                 circumference was measured at the approximate midpoint between the lower margin of the last palpable rib
                                                 and the top of the iliac crest [10]. All the measurements were made with the tape held snugly, but not too
                                                 tight and the tape was held parallel to the floor.

                                                 Calculations
                                                 Waist-to-hip ratio (WHR) = waist circumference/hip circumference

2021 Behera et al. Cureus 13(1): e12579. DOI 10.7759/cureus.12579                                                                                                      2 of 9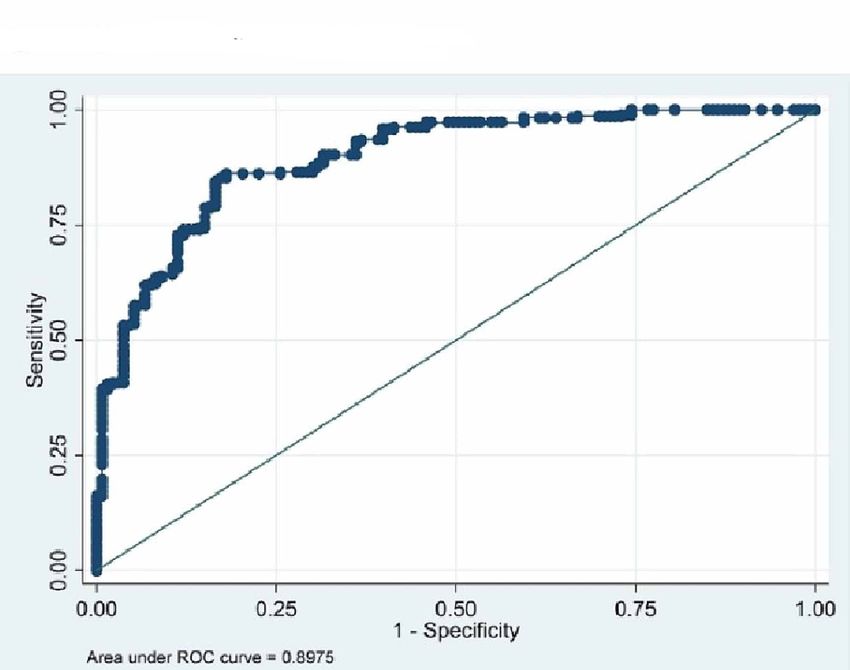
BMI calculated using the formula -

                                                  BMI = body weight (in kg) / [height (in metres)]2

                                                  Fat free mass index (FFMI) calculated using the formula -

                                                  FFMI = [body weight - (BFP × body weight)] / [height (in metres)]2 [11].

                                                 Body fat percentage of 25%-35% in females and 13%-23% in males [4-5, 9] was considered normal.
                                                 Overweight or obesity indicated by high body fat was defined as BFP >23% in males and >35% in females [9].
                                                 WHR ≥ 0.90 in males and ≥ 0.85 in females is considered abnormal as per WHO guidelines [10].

                                                 Students having fever or any other form of acute or chronic illness at the time of study were excluded from
                                                 the study.

                                                 Analysis and reporting
                                                 The data were entered into MS Excel and analysis was done using the SPSS 21 software. Mean, standard
                                                 deviation, student’s t test, and chi square test were done for generation of results. Receiver operating curve
                                                 (ROC) was plotted using the data for predicting cut-off values using BFP as a standard for predicting obesity
                                                 and overweight.

                                                 Results
                                                 Out of 904 students invited for study, 863 students (430 males and 433 females) have consented and
                                                 participated in the study.

                                                 Body fat percentage is higher in females (34.23) as compared to males (20.77). Whereas, FFM and FFMI are
                                                 higher in males, i.e., 56.24 and 18.48 respectively.

                                                 Table 1 shows that there was no difference in the BMI of males (23.75) and females (23.69). The BFP of both
                                                 genders was found significant (i.e., 22.09% in males versus 31.06% in females) [8]. FFMI (in males 18.22 and
                                                 16.13 in females) and WHR (0.87 in males and 0.82 females) were also different and significant in both
                                                 genders. Abdominal obesity was higher in females (30%) as compared to males (26%) but was not
                                                 statistically significant.

               Characteristics                                      Males mean (SD)                   Females mean (SD)                      p value

               Age (in years)                                       19.29(1.25)                       18.63(1.09)                           0.0001

               Weight (in kilograms)                                66.60(13.03)                      57.81(11.43)                          0.0001

               Height (in meters)                                   1.68(0.07)                        1.56(0.06)                            0.0001

               BMI                                                  23.75(4.04)                       23.69(4.40)                           0.575

               Waist circumference (in cm)                          59.96(26.43)                      61.58(22.13)                          0.328

               Hip circumference (in cm)                            68.89(29.55)                      75.26(27.19)                          0.01

               WHR                                                  0.87(0.05)                        0.82(0.06)                            0.0001

               BFP                                                  22.09(5.80)                       31.06(5.62)                           0.0001

               FFMI                                                 18.22(2.35)                       16.13(1.89)                           0.0001

              TABLE 1: Anthropometric profile and characteristics of study participants (n=863).
              SD, standard deviation; BFP, body fat percentage; BMI, body mass index; FFMI, fat free mass index; WHR, waist-to-hip ratio

              p value
Characteristics Male mean (SE) Female mean (SE) p value
BMI 29.33(3.02) 29.06(3.65) 0.0001
WHR 0.92(0.04) 0.84(0.05) 0.0001
Waist circumference (in cm) 88.94(6.47) 80.46(8.01) 0.0001
BFP 20.77(4.35) 34.23(4.67) 0.0001
Fat free mass 67.40(6.05) 56.24(4.47) 0.0001
FFMI 22.49(1.75) 18.48(1.57) 0.0001
TABLE 2: Gender wise distribution of age adjusted mean for selected characteristics of the study
population.
BMI, body mass index; WHR, waist-to-hip ratio; BFP, body fat percentage; FFMI, fat free mass index; SE, standard error
pCharacteristics Male Female
BMI levels N (%) N (%)
30 26(6.05) 39(9.01)
Waist circumference
90 cm 8(1.86) 54(12.47)
WHR
Normal 318(73.95) 299(69.05)
Chi Sq= 2.5422 p value=0.111
High 112(26.05) 134(30.95)
BFP
Normal 133(30.93) 277(63.97)
Chi Sq= 94.45 p value=0.0001
High 297(69.07) 156(36.03)
BMI
Normal 287(66.74) 306(70.67)
Chi Sq= 1.546 p value=0.214
High 143(33.26) 127(29.33)
TABLE 3: Association of anthropometric parameters with gender.
BMI, body mass index; WHR, waist-to-hip ratio; BFP, body fat percentage; BFP >23% in males and >35% in females were taken overfat/high [9].
Waist circumference >90 cm in males and > 80 cm in females is considered high. WHR >= 0.90 in males and >= 0.85 was considered high [10].
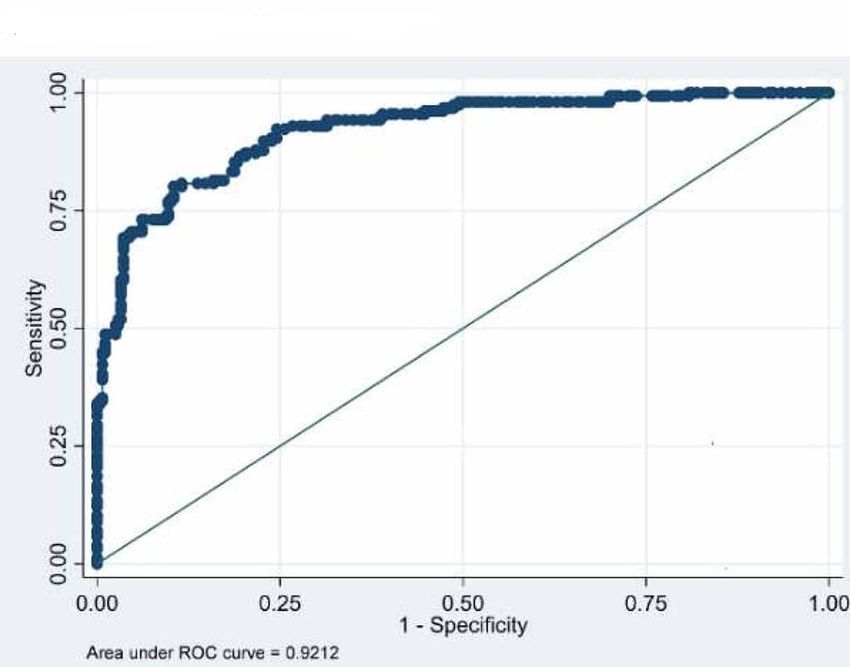
pFIGURE 1: ROC on BMI and BFP (both males and females).
ROC, receiver operating curve; BMI, body mass index; BFP, body fat percentage
FIGURE 2: ROC curve on males (BMI vs. BFP).
BMI, body mass index; BFP, body fat percentage; ROC, receiver operating curve
2021 Behera et al. Cureus 13(1): e12579. DOI 10.7759/cureus.12579 6 of 9FIGURE 3: ROC curve on females (BMI vs. BFP).
BMI, body mass index; BFP, body fat percentage; ROC, receiver operating curve
Discussion
Body mass index has been in use since mid-19th century. BMI has been a useful and convenient tool owing
to its universal acceptance, feasibility, and convenience. BMI has been used for long as the assessor for
fitness and fatness but BMI has the disadvantage of not distinguishing between fat and muscle as it has been
proved over the time by many [12-13]. It is fat content which increases the risk of several diseases
(noncommunicable and communicable). Use of BFP and FFM as the marker of obesity is more appropriate as
proved by various researchers all over the world. But owing to the fact that BMI is the easiest and most
widespread method to assess obesity, it is still used widely all over world as the proxy measure for health
and fitness.
The WHO expert committee meeting [14] had proposed BMI cut-off points 18-24.9 kg/m2 for normal, 25.0-
29.9 kg/m2 for overweight, and >30.0 kg/m2 for obese. Taking the fact into consideration that though Asians
in general have lower BMI, health risks related to obesity are also occurring at lower BMI; the Regional Office
for Western Pacific Region of WHO, the International Association for study of Obesity and the Obesity Task
force had proposed a separate classification for Obesity in Asia in 2000. This led to the proposal that adult
overweight was specified in Asians as BMI over 23.0, and that obesity was specified over 25.0 (WPRO
criteria) [15]. Aging is usually accompanied with a progressive increase in ratio of fat to lean mass owing to
several contributing factors. But in present times stressful academic and professional studies have led to
erratic lifestyle, lack of physical activity which in turn may also increase the total BFP [16]. In our study we
found males and females to have significant difference among all anthropometric parameters except BMI
and waist circumference (Table 1) but age adjusted mean found every parameter to be significant (Table 2).
Erdembileg et al. [17] found the relation between BMI and body fat deposit or parameters constituting
metabolic syndrome to be gender and age specific for Japanese workers.
Incidence of noncommunicable diseases in developing countries like India is on rise [18] more so at a young
age [19]. The foundation of good health starts from a young age and the criteria to assess the health should
be customized according to the need of the population. Aziz et al. [20] and Lim et al. [21] found that on
following the revised guidelines the prevalence of obesity increased in pregnant women and in chronic
obstructive pulmonary disease (COPD) patients respectively which will help in planning the intervention. As
found in our study BFP and WHR were found more significant than the current BMI guidelines (Table 3). Fat
percentage should be the ideal reference point for assessment of fatness.
From the ROCs (Figures 1-2 and Table 4) we found the cut-off value of BMI as 22.04 kg/m2 for males (with
84.5% sensitivity and 83.46% specificity) and 23.73 kg/m2 for females (85.26 and 81.23 specificity and
sensitivity respectively) with highest sensitivity and specificity. Singh et al. [22] have proposed a higher cut-
2021 Behera et al. Cureus 13(1): e12579. DOI 10.7759/cureus.12579 7 of 9off value of 23.85 kg/m2 for males using ROC curve. Similarly, Dudeja et al. [8] in 123 North Indians (86
males and 37 females) have proposed a BMI cut-off value of 21.5 kg/m2 corresponding to 25% body fat for
males and 19 kg/m2 for females. Fat percentage varies in males and females and so does the WHR [5, 7]. So,
keeping one reference value for both males and females is unfair and inaccurate to assess the overweight
and obesity.
We have used BI as the method to assess the BFP in the participants which is a fast, practical, noninvasive,
and widely used method. Several studies have validated the use of BI as a standard for body fat
estimation [23-24]. BMI is specific for race and hence, we agree to the conclusion of researchers like Piers et
al. [25], who have concluded that BMI is useful and convenient for population studies but ill-applied in
individuals. The need for population, ethnicity, and gender specific BMI cut-off is imperative and should be
used with more precision especially in Indian population where the culture and food habits vary compared
to other countries in Asian subcontinent.
Our study has included only young adults pursuing MBBS studies. All the data collected were from the
southeastern part of India which might or might not be a representation of whole India. BMI cut-off value
might change according to age. So, there is need to collect more data from older age groups as well as from
other regions of the country (north and western regions of India).
Conclusions
We propose the cut-off value for overweight/obesity in males to be 22.09 kg/m2 and that for females to be
23.73 kg/m2 in young adult Indian population which have more sensitivity and specificity than current BMI
cut-off value. Using these values for defining obesity in Indian population can help healthcare providers to
educate, prevent, and treat various diseases where obesity might play an important role.
Additional Information
Disclosures
Human subjects: Consent was obtained by all participants in this study. Institutional Ethics Committee.
Kalinga Institute of Medical Sciences issued approval KIMS/KIIT/IEC/40/2018. Animal subjects: All authors
have confirmed that this study did not involve animal subjects or tissue. Conflicts of interest: In
compliance with the ICMJE uniform disclosure form, all authors declare the following: Payment/services
info: All authors have declared that no financial support was received from any organization for the
submitted work. Financial relationships: All authors have declared that they have no financial
relationships at present or within the previous three years with any organizations that might have an
interest in the submitted work. Other relationships: All authors have declared that there are no other
relationships or activities that could appear to have influenced the submitted work.
References
1. World Health Organization: Obesity and overweight. World Health Organization, Geneva; 2013.
2. Wang J, Thornton JC, Kolesnik S, Pierson RN Jr.: Anthropometry in body composition. An overview . Ann NY
Acad Sci. 2000, 904:317-326. 10.1111/j.1749-6632.2000.tb06474.x
3. Van Gaal LF, Vansant GA, De LI: Upper body adiposity and the risk for atherosclerosis . J Am Coll Nutr. 1989,
8:504-514. 10.1080/07315724.1989.10720320
4. Body composition and fat percentage. Definition, guideline and methods for measuring body fat . (2020).
Accessed: Jan 6, 2020: https://www.verywellfit.com/what-is-body-composition-3495614.
5. Banjare JB, Bhalerao S: Obesity associated noncommunicable disease burden . Int J Health Allied Sci. 2016,
5:81-87. 10.4103/2278-344X.180429
6. Nishida C, Ko G, Kumanyika S: Body fat distribution and noncommunicable diseases in populations:
overview of WHO Expert Consultation on waist circumference and waist-hip ratio. Eur J Clin Nutr. 2008,
64:2-5. 10.1038/ejcn.2009.139
7. Kjeldstadli K, Tyssen R, Finset A, et al.: Life satisfaction and resilience in medical school a six-year
longitudinal, nationwide and comparative study. BMC Med Educ. 2006, 6:48. 10.1186/1472-6920-6-48
8. Dudeja V, Misra A, Pandey RM, Devina G, Kumar G, Vikram NK: BMI does not accurately predict overweight
in Asian Indians in northern India. Br J Nutr. 2001, 86:105-112. 10.1079/bjn2001382
9. Gallagher D, Heymsfield SB, Heo M, Jebb SA, Murgatroyd PR, Sakamoto Y: Healthy percentage body fat
ranges: an approach for developing guidelines based on body mass index. Am J Clin Nutr. 2000, 72:694-701.
10.1093/ajcn/72.3.694
10. World Health Organization: Waist Circumference and Waist-Hip Ratio: Report of a WHO Expert
Consultation, Geneva, 8-11 December 2008. World Health Organization, Geneva; 2011.
11. Schutz Y, Kyle U, Pichard C: Fat-free mass index and fat mass index percentiles in Caucasians aged 18-98 y .
Int J Obes. 2002, 26:953-960.
12. Zeng Q, Dong SY, Sun XN, Xie J, Cui Y: Percent body fat is a better predictor of cardiovascular risk factors
than body mass index. Braz J Med Biol Res. 2012, 45:591-600. 10.1590/s0100-879x2012007500059
13. Roy SM, Fields DA, Mitchell JA, et al.: Body mass index is a better indicator of body composition than
weight-for-length at age 1 month. J Pediatr. 2019, 204:77-83. 10.1016/j.jpeds.2018.08.007
14. World Health Organization: Obesity. Preventing and managing the global epidemic. Report on a WHO
consultation on Obesity. Technical Report Series Number 894. World Health Organization, Geneva; 2000.
15. WHO/IOSO/IOTF: The Asia Pacific Perspective: Redefining Obesity and Its Treatment . Health
2021 Behera et al. Cureus 13(1): e12579. DOI 10.7759/cureus.12579 8 of 9Communications Australia Pvt Limited, New South Wales; 2000.
16. Bibiloni MM, Karam J, Bouzas C, et al.: Association between physical condition and body composition,
nutrient intake, sociodemographic characteristics, and lifestyle habits in older Spanish adults. Nutrients.
2018, 10:1608. 10.3390/nu10111608
17. Erdembileg A, Kuninori S, Akiko N, et al.: The New BMI criteria for Asians by the regional office for the
Western Pacific Region of WHO are suitable for screening of overweight to prevent metabolic syndrome in
Elder Japanese workers. J Occup Health. 2003, 45:335-343. 10.1539/joh.45.335
18. Joshi SR, Saboo B, Vadivale M, Dani SI, Mithal A, Kaul U: Prevalence of diagnosed and undiagnosed diabetes
and hypertension in India-results from the Screening India’s Twin Epidemic (SITE) Study. Diabetes Technol
Ther. 2012, 14:8-15. 10.1089/dia.2011.0243
19. Mohan V, Deepa R, Rani SS, Premalatha G: Prevalence of coronary artery disease and its relationship to
lipids in a selected population in South India: the Chennai Urban Population Study (CUPS no 5). J Am Coll
Cardiol. 2001, 5:682-687. 10.1016/s0735-1097(01)01415-2
20. Aziz N, Kallur SD, Nirmalan PK: Implications of the revised consensus body mass indices for Asian Indians
on clinical obstetric practice. J Clin Diagn Res. 2014, 8:1-3. 10.7860/JCDR/2014/8062.4212
21. Lim JU, Lee JH, Kim JS, et al.: Comparison of World Health Organization and Asia-Pacific body mass index
classifications in COPD patients. Int J Chron Obstruct Pulmon Dis. 2017, 21:2465-2475.
10.2147/COPD.S141295
22. Singh SP, Sikri G, Garg MK: Body mass index and obesity: tailoring “cut-off” for an Asian Indian male
population. Med J Armed Forces India. 2008, 64:350-353. 10.1016/S0377-1237(08)80019-6
23. Raquel D Langer, Catarina N Matias, Juliano H Borges, Vagner X Cirolini, Mauro A Páscoa, Gil Guerra-Júnior,
Ezequiel M Gonçalves: Accuracy of bioelectrical impedance analysis in estimated longitudinal fat-free mass
changes in male army cadets. Military Med. 2018, 183:7-8. 10.1093/milmed/usx223
24. Carrion BM, Wells A, Mayhew JL, Koch AJ: Concordance among bioelectrical impedance analysis measures
of percent body fat in athletic young adults. Int J Exerc Sci. 2019, 12:324-331.
25. Piers LS, Soares MJ, Frandsen SL, O'Dea K: Indirect estimates of body composition are useful for groups but
unreliable in individuals. Int J Obes Relat Metab Disord. 2000, 24:1145-1152. 10.1038/sj.ijo.0801387
2021 Behera et al. Cureus 13(1): e12579. DOI 10.7759/cureus.12579 9 of 9You can also read