Accessing the Real Estate Investment Universe in 2021 - JANUARY 2021
←
→
Page content transcription
If your browser does not render page correctly, please read the page content below

Accessing the Real
Estate Investment
Universe in 2021

JANUARY 2021

Each year LaSalle’s research and strategy team                                                                 CONTACT AUTHORS
                                                                                                               Research & Strategy Group
estimates the size of the income-producing real
                                                                                                               Jacques Gordon
estate universe throughout the world, by country,                                                              jacques.gordon@lasalle.com

and by segment. 2020 was a turbulent year as                                                                   Daniel Mahoney
                                                                                                               daniel.mahoney@lasalle.com
a result of the COVID-19 pandemic and this is                                                                  Eduardo Gorab
reflected in our latest estimates. LaSalle’s analysis of                                                       eduardo.gorab@lasalle.com

                                                                                                               Frances Osei Bonsu
the institutional-owned and total income producing                                                             frances.oseibonsu@lasalle.com

universe measures its size at the end of 2020,                                                                 Chris Psaras
                                                                                                               chris.psaras@lasalle.com
incorporating the pandemic’s initial impact. At year-
                                                                                                               Elysia Tse
end 2020, global institutionally owned real estate                                                             elysia.tse@lasalle.com

totaled $10.2 trillion, 4% less than a year ago.                                                               Dennis Wong
                                                                                                               dennis.wong@lasalle.com
LaSalle 2021 Global Real Estate Universe

Defining the Universe
                                         The gross asset value of real estate owned by REITs and REOCs listed on public exchanges.
Public Real Estate                       Includes vertically-integrated development companies in emerging markets, but not
                                         exclusive homebuilders or infrastructure REITs.

Institutional Invested                   The unleveraged total value of all professionally managed real estate portfolios, both public
Real Estate                              and private.

                                         Value of existing stock of all commercial (office, retail, industrial, alternatives) with the
Total Income-Producing
                                         potential to be income-generating and all currently rented residential buildings. Owner-
Real Estate                              occupied residential homes, infrastructure, and agricultural land are not included.

Sources used in LaSalle analysis: Oxford Economics, Citigroup, Bloomberg, NCREIF, MSCI, Investment Property Forum (UK), National Bureau of Statistics
of China, US Bureau of Economic Analysis, US Federal Reserve, Company financial statements. The public universe reflects estimates as of Q2 2020. The
institutional owned and total income producting estimates are for year-end 2020.

LaSalle Investment Management Research & Strategy | Accessing the Real Estate Universe in 2021                                                          2
Our update briefing this year goes beyond a review of                        Although investors’ choice of channel may vary, the
the relative size of different countries. Rather than solely                 underlying characteristics of the real estate exposure they
focus on the underlying universe, we also look at the many                   access is common across structures. For instance, the
different ways that investors can access the real estate                     academic literature shows that, despite higher short-term
opportunity set.                                                             volatility, real estate security performance approximates
                                                                             direct real estate over longer periods.
Many Roads Leading To The Same Destination
                                                                             It is also important to note that investors can gain access
In Chapter 3 of the 2021 Investment Strategy Annual (ISA)
                                                                             to the four quadrants of real estate (public, private, debt
report we set out the case for real estate in a mixed asset
                                                                             and equity) through most of the channels defined in Table
portfolio. We argue that in addition to the large opportunity
                                                                             1. Investors can access real estate debt in public markets
set, low volatility, strong risk adjusted returns, and inflation
                                                                             through securities (mortgage REITs or the Commercial
hedging characteristics of real estate, one of the key
                                                                             Mortgage-backed Securities (CMBS) market), and in
characteristics of the asset class is its high and rising degree
                                                                             private markets through commingled private debt funds,
of accessibility. The number of real estate investment
                                                                             indirect and multi-manager channels, as well as through
vehicles has risen to offer both institutional and individual
                                                                             separate accounts. Similarly, equity-like returns from real
investors a wider array of options than in the past.
                                                                             estate are available to investors through public market
Investors can access real estate equity and debt returns                     vehicles (REITs and Property Companies) as well as private
through a variety of paths, and Table 1 defines their                        markets through any combination of separate accounts,
main characteristics. While the multitude of structures                      commingled funds, and indirect approaches.
and vehicles adds complexity for real estate investors,
                                                                             Portfolio Balance
this diversity of channels is also a positive feature rather
than an obstacle. Based on preferences, investors have                       These approaches each carry relative benefits and
the ability to select a structure that optimizes the balance                 drawbacks and therefore investors will face inherent trade-
between control, liquidity, diversification, and cost to best                offs when choosing a combination of vehicles that best
suit their needs.                                                            meets their objectives. Investors can use multiple channels

Table 1: Channels to Access Real Estate Assets (Debt and Equity)

Channel                                                Definition

                          Equity                       Where an investor buys/originates and holds real estate equity or debt investments
Direct
                          Debt                         utilizing mostly in-house expertise and capabilities.

                          Equity REITs
Real Estate               Mortgage REITs               Publicly-traded, with underlying assets backed by physical real estate assets.
Securities*
                          CMBS

Commingled                Equity                       A vehicle that pools capital from various sources. Managed by a specialized real estate
Fund*                     Debt                         investment manager.

                                                       A commingled fund established to acquire interests in a number of other
Fund of Funds*
                                                       commingled funds.

                                                       A partnership between a real estate operator and a single capital partner, typically to
Joint Ventures (JV)*
                                                       acquire a property or properties.

                                                       A partnership between a real estate operator and multiple capital partners to acquire
Clubs*
                                                       and manage a property.

                                                       A partnership between a commingled fund and a capital partner(s) whereby the capital
Co-investment*                                         partner provides a portion of the equity capital to acquire a property(s), typically
                                                       because the capital requirement is too large for the commingled fund.
                                                       An investment vehicle set up for a single investor by a dedicated third-party investment
Separate Accounts                                      manager. This type of account can invest in any combination of direct, indirect, public,
                                                       private, debt, and equity as agreed between the investor and the manager.

*Together Comingled Funds, Funds of Funds, Clubs, JVs, Co-investment, and Securities approaches can be termed “indirect.”
Source: LaSalle Investment Management

LaSalle Investment Management Research & Strategy | Accessing the Real Estate Universe in 2021                                                   3
Chart 2: Four Quadrants of Real Estate and Investment Structures

Source: LaSalle Investment Management

as complements, blending them to achieve a portfolio that           By virtue of trading on a deep exchange, real estate securities
best balances the benefits of each.                                 in the debt and equity space are significantly more liquid
                                                                    than other vehicles. Yet the relative liquidity between these
Table 2 on the following page traces the relative attributes
                                                                    options are not a free lunch, as higher liquidity is generally
of the various investment structures that we defined
previously across eight dimensions. The table highlights            accompanied by higher volatility. For example, securities are
that in contrast to commingled funds and direct ownership,          subject to systematic volatility in broader stock and bond
real estate securities and various indirect approaches              markets that is not always tied to real estate fundamentals
provide a comparatively simple solution for investors               and real estate capital markets. Also, REITs often trade well
seeking access to international and niche-sector real estate.       above or below the Net Asset Value of the underlying real
Let’s examine four of these attributes more closely: control,       estate, which adds another component of volatility. Investor
liquidity, diversification, and costs.                              preferences around liquidity and ability to accept this higher
                                                                    volatility will vary depending on their investment objectives,
Liquidity: The relatively illiquid nature of real estate is         funding needs and time horizons.
one of the key reasons that the asset class commands a
premium over bonds. Direct real estate holdings can take            Diversification: While all properties are relatively illiquid,
months to transact. Commingled funds, as well as indirects,         no two properties are alike. Idiosyncratic property-level risks
can offer a degree of liquidity in some cases. Open-ended           are an important source of risk for investors in real estate.
fund structures allow investors to redeem periodically.             Investors tend to build their exposure to real estate debt and
Although closed-end funds lack that formal liquidity option,        equity through portfolios of assets. Concentration of risks
the existence of a secondary market for open- and closed-           is greatest where portfolios are small and declines as the
end commingled funds provides a window for investors                number of assets increases. Since property lot sizes tend to
to gain liquidity. That said, fund secondary markets can be         be large, diversification is hardest (costliest) to achieve for
particularly shallow when considering very niche products           direct investors. By virtue of investing in multiple pools of
or periods of elevated market stress.                               assets, a Fund of Funds approach can provide a cost-efficient
                                                                    solution to the diversification problem.

LaSalle Investment Management Research & Strategy | Accessing the Real Estate Universe in 2021                                    4
Table 2: Relative Advantages of Different Real Estate Investment Structures
(Scale: 1=Highest on This Dimension, 5= Lowest on This Dimension)

Source: LaSalle Investment Management

Control: Cost-efficient diversification often comes at               vehicles and thus be unable to influence the way the
the expense of being a small shareholder of a large pool             underlying property portfolios are set up or managed.
of assets. As a result, an investor’s degree of control              Given real estate’s heterogeneity and asset management
over the assets varies greatly across the access routes.             intensity, control is not an unambiguously desirable trait
Direct ownership means an investor can fully influence               for all investors, and delegating this responsibility can be
strategic buy/hold/sell decisions, as well as major asset            positive. Investors may lack the resources or desire to
management decisions. Separate account agreements will               manage a real estate portfolio and can often benefit from
                                                                     investment manager expertise.
typically set out the parameters under which a portfolio
will be managed, thus allowing investors control over                Cost: Achieving diversification, as well as accessing
key decisions. By contrast, for indirects and securities,            specialist manager skills all come at a cost. As such, the
investors will typically hold non-controlling stakes in the          various access points carry different financial costs to

   “Given real estate’s
   heterogeneity and
   asset management
   intensity, control is not an
   unambiguously desirable
   trait for all investors”

LaSalle Investment Management Research & Strategy | Accessing the Real Estate Universe in 2021                                      5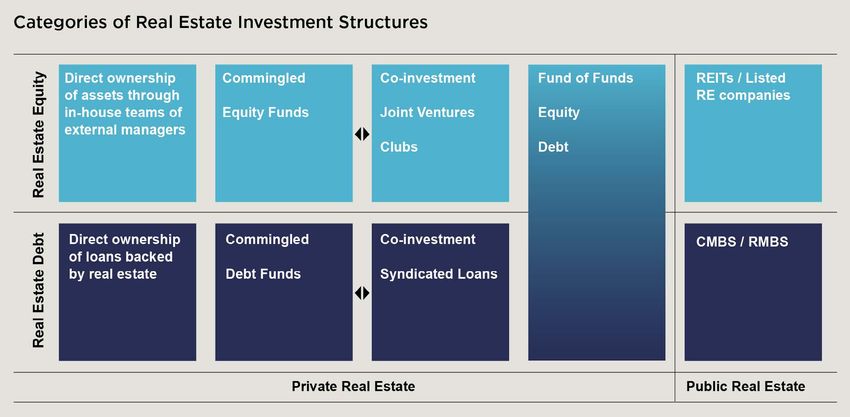
Chart 3: Indicative Mix of Real Estate Investment Vehicles by Investor Size

             Smallest Investors                            Size of Fund/Staff                                  Largest Investors

                                                                                   JVs, Clubs, Co-investment
                                                                                   Direct Investing

investors. At one end of the spectrum, real estate securities        necessarily those that are the best fit based on all the
face the least prohibitive cost barriers, as any investor can        dimensions highlighted above.
trade in public markets by paying a very low transaction
                                                                     Strong home market bias in investors’ portfolios is an
fee or a low asset management fee. Direct investment fees
                                                                     example of “status quo” thinking. Data from INREV/ANREV/
are also comparatively low, as investors transacting directly
                                                                     NCREIF highlights that an investor’s domicile region tends
only face the purchase and sale costs of the assets they
                                                                     to correlate closely with the composition of their portfolio.
trade. Due to additional (and possibly overlapping layers
                                                                     A portfolio of real estate securities or a fund of funds
of) management fees, the separate accounts and indirect
                                                                     approach could be efficient ways to counter this bias. As
routes tend to be more costly, with substantial variation
                                                                     we have argued elsewhere, enlisting specialists, can also
across risk style, and promote structures that share upside
                                                                     help. Survey evidence shows that 63% of institutional
with the sponsor, especially for non-core strategies.
                                                                     investors in the real estate space outsource all portfolio
One Size Does Not Fit All                                            management duties to third-party managers, whilst only
                                                                     9% carry out all portfolio management in-house.3
Institutional investor characteristics and preferences
ultimately shape which channel fits best for them. Indeed,           As we discuss in Chapter 3 of the 2021 Investment
pension funds, insurance companies and sovereign wealth              Strategy Annual, investor size can be a key driver of which
funds are managed differently around the world, and                  channels are optimal for accessing real estate. Chart 3
institutions vary significantly in their level of resources and      above shows a simple model outlining how allocations
experience with real estate markets. These two factors               across different vehicles may vary as an investors’ size and
are important determinants of how investors access real              resources increases.
estate assets.
                                                                     This simple model highlights that investors are well-
Yet, in addition to those drivers, behavioral biases                 served by building a real estate portfolio through more
sometimes also drive the way investors access real                   than one channel simultaneously. Indeed, this mix of
estate. These can nudge investors towards themes and                 multiple channels is what we see in practice. The smallest
investment structures they are already familiar with, not            investors, despite resource constraints, can still achieve

2 “Why Global Real Estate?” LaSalle (2019)
3 Hodes Weill Allocations Monitor (2020)

LaSalle Investment Management Research & Strategy | Accessing the Real Estate Universe in 2021                                     6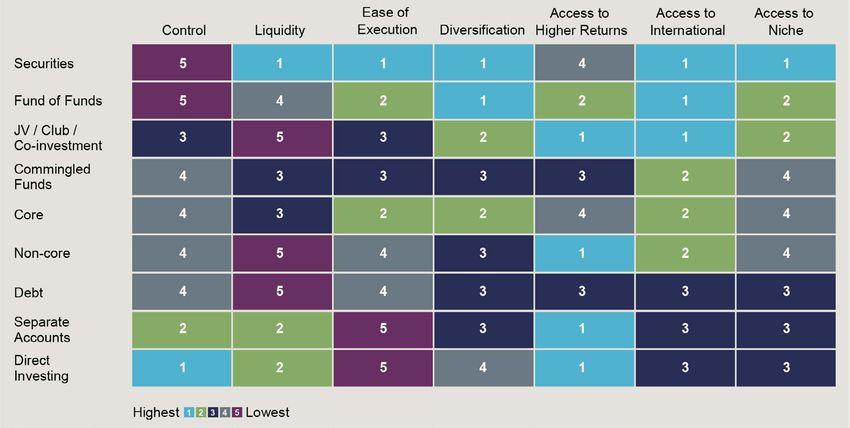
“The variation in institutional
                                                                     ownership around the
                                                                     world reflects the extremely
                                                                     fragmented nature of real
                                                                     estate ownership and very high
                                                                     share of private ownership in
                                                                     many markets.”

a diversified, and professionally managed exposure to                corporate-controlled real estate. The discussion below
real estate through a combination of real estate securities          highlights many of these differences around the world.
and multi-manager routes. Meanwhile, even the largest
                                                                     Only a Fifth of the Universe is Owned by Institutions:
institutions often retain exposure to external expertise,
                                                                     Many institutional investors consistently report that
via separate accounts, commingled funds, multi-manager
                                                                     they are under-invested in real estate relative to their
or securities alongside internally-managed assets. Indeed,
                                                                     target allocation.4 Lack of suitable product that achieves
Hodes-Weill survey data shows both large and small
                                                                     targeted returns is often cited as the reason. Yet LaSalle’s
investors report positive demand for the access channels
                                                                     real estate universe estimates show that institutionally-
we have identified. Larger investors with an allocation to
                                                                     owned real estate only comprises about 20% of all
real estate well over $1 billion display a greater preference
                                                                     income-producing property. In that case, why don’t
for direct investments and separate accounts than smaller
                                                                     institutionally-invested owners own more of the universe?
investors, whereas commingled funds are more commonly
                                                                     This seems to reflect a mismatch in the real estate that
sought out by investors whose real estate allocations are
                                                                     institutional investors are comfortable investing in and
under $1 billon.4
                                                                     the broader universe of all leased real estate.
Matching Channels of Access to LaSalle’s
Underlying Real Estate Investment Universe                           In some markets, institutions do own a much larger share,
                                                                     like the UK. But in Hong Kong and Korea, corporate-owned
When we compare the myriad channels of accessing                     and family-controlled positions are much more common.
real estate against our underlying estimates of market               Large conglomerates and shipping companies have
size, as we have for more than ten years, it has provoked            had historic positions in port facilities, and maintained
some recurring questions because it can differ markedly              this ownership, even as the land converted to other
from survey responses, capital flows analysis, and index             commercial uses. The variation in institutional ownership
allocations. In fact, when we compare data measuring                 around the world reflects the extremely fragmented
investment flows through different channels against                  nature of real estate ownership and very high share of
our universe estimates, there can be large differences.              private ownership in many markets. While each property
Unraveling the “why?” and “what does it mean?” of                    owner has a monopoly on space at an exact address,
these differences provides insights about where the                  institutional owners compete directly with non-institutional
opportunities for global real estate growth and increased            (mainly family-owned) properties, leading to less market
institutionalization lie. This discussion also highlights            concentration in real estate relative to other parts of the
some of constraints shaping allocation decisions and the             global economy.
different ways the data is assembled in markets where
institutional ownership is secondary to family-owned or

4 Hodes Weill Allocations Monitor (2020)

LaSalle Investment Management Research & Strategy | Accessing the Real Estate Universe in 2021                                  7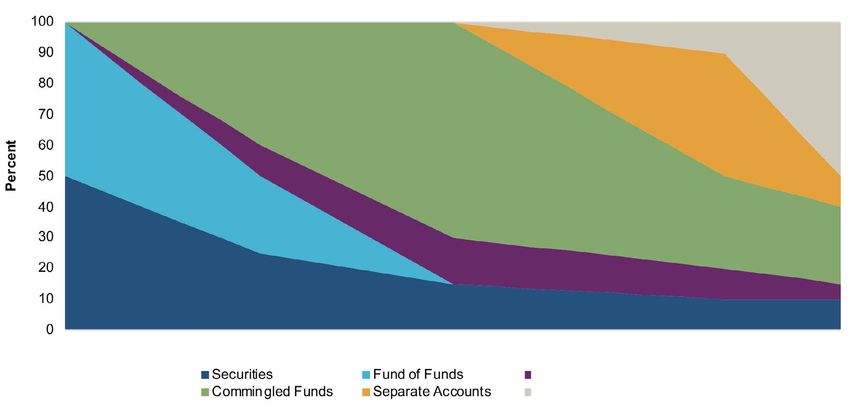
Overlapping Layers of Ownership and Fluid Investment
Styles Makes Segmenting the Universe Difficult:
When we total the capital flowing through different access
channels to real estate (e.g. debt funds, funds of funds,
separate accounts, etc.), or investment by risk profile (e.g.
core, core-plus, value-add, and opportunistic) and try to                    “Our approach is
match them up to the underlying stock of real estate, it is                  differentiated by
nearly impossible to reconcile the amounts. This challenge
is the result of overlapping ownership layers and the fluidity               its combination
of the capital stack that finances various property types and
                                                                             of bottom-up and
risk categories.
                                                                             top-down data
Take as an example a development asset owned through a JV
between a public REIT and a private commingled fund, with                    covering nearly
moderate leverage. The capital in this asset is held through
                                                                             every country, our
multiple channels, and the asset itself moves between an
opportunistic style and core style after it is fully leased.                 incorporation of
Rather than untangling and parsing these layers across tens
of thousands of properties, we have focused our real estate
                                                                             transparency index
universe estimates on the gross value of the underlying real                 and urbanization
estate rather than the channel of ownership. In effect, rather
than trying to untie this Gordian knot in the estimates we
                                                                             to improve the top-
present, we are cutting the rope by showing estimates for                    down estimates,
the underlying gross asset value.
                                                                             and its detail
Our Universe Estimates Show Significant Differences
vs. Index Allocations: The final source of questions relate
                                                                             on the market
to our real estate universe estimates versus fund benchmark                  capitalization of
allocations. INREV, ANREV, MSCI, and NCREIF AUM allocations
often significantly differ from the underlying universe. These
                                                                             metro areas.”
differences tend to be self-perpetuating because to replicate/
track the benchmark you must have a similar region and
sector composition to that index. Yet they also reveal the
path of likely evolution for those benchmarks, perhaps best
reflected in the gradual growth of allocations to Asia-Pacific,
the institutionalization of the residential sector, and
growth of niche/alternative property types.

Below you will find our updated estimates for the size of the
real estate universe as of year-end 2020. As in prior years, we
have updated our estimates for three distinct asset types –
public, institutional-invested, and total income-producing real
estate. We have also updated our estimates of market size
for the world’s largest metro areas.

While there are several high-quality market size estimates
available, from EPRA and MSCI for example, our approach
is differentiated by its combination of bottom-up and top-
down data covering nearly every country, our incorporation

LaSalle Investment Management Research & Strategy | Accessing the Real Estate Universe in 2021     8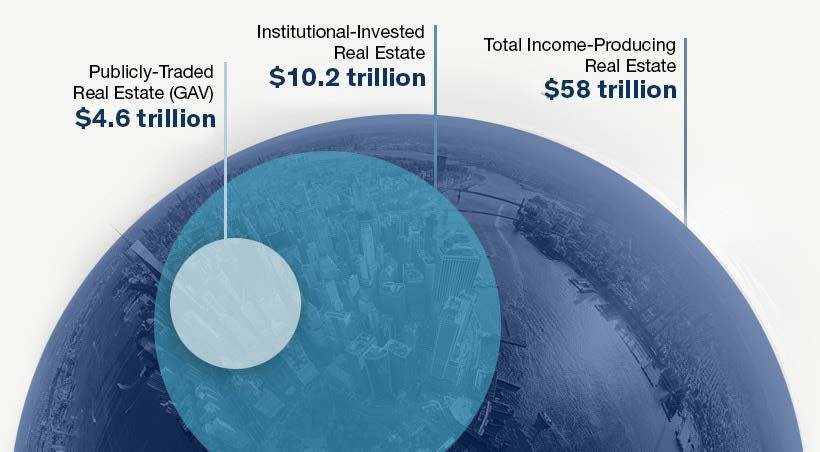
Summary Table
                                                        Public Real      Institutional Invested Real    Total Income Producing
                                                   Estate Universe                  Estate Universe        Real Estate Universe

 Total (US$ Billions)                                       $4,589                          $10,209                   $57,559
 Regional Share

 Americas                                                      39%                               36%                      33%
 Asia Pacific                                                  42%                               32%                      33%
 Europe                                                        16%                               28%                      29%
 Middle East and Africa                                         3%                                4%                       5%
 Size By Country/Region (BN $)

 Americas

 United States                                              $1,630                           $2,937                   $14,986
 Canada                                                       $114                               $303                   $1,287
 Mexico                                                        $27                               $103                    $623
 Brazil                                                        $19                               $137                    $789
 Other Americas                                                $11                               $145                   $1,137
 Europe

 UK                                                           $133                               $547                   $2,494
 France                                                       $182                               $400                   $1,941
 Germany                                                      $176                               $520                   $3,019
 Italy                                                           $6                              $101                   $1,319
 Spain                                                         $40                                $91                    $948
 Netherlands                                                   $19                               $160                    $794
 Switzerland                                                   $30                               $237                    $594
 Sweden                                                        $60                               $204                    $460
 Other Western Europe +
                                                               $67                               $439                   $3,285
 Russia
 Central & Eastern Europe                                        $6                              $135                   $1,198
 Turkey                                                          $5                              $66                     $432
 Asia

 Japan                                                        $527                           $1,266                     $4,426
 Australia                                                    $143                               $285                   $1,089
 Hong Kong                                                    $194                               $273                    $383
 Singapore                                                    $121                               $199                    $324
 China                                                        $813                               $964                   $9,232
 South Korea                                                   $0.0                              $134                    $737
 Other Asia                                                   $147                               $191                   $3,085
 Middle East & Africa                                         $120                               $371                   $2,977

LaSalle Investment Management Research & Strategy | Accessing the Real Estate Universe in 2021                                9
of transparency index and urbanization data to improve Estimated Institutional Owned Office, Industrial,
the top-down estimates, and its detail on the market and Retail Real Estate, by Metro
capitalization of metro areas. A detailed explanation of our City Institutional- Metro
(Metro Area) Owned RE, Pop.
methodology is also included below. $BN (000s)
There is no single standard way of defining a metropolitan 1 Greater Tokyo $550 37,025
area globally, and the way these definitions are drawn has a 2 New York Combined Statistical Area $319 20,897
large impact on the rankings to the right. To standardize this 3 Greater London $291 13,260
comparison and make it as meaningful as possible, we have 4 Paris / Ile de France $274 12,287
selected our boundaries carefully and used the broadest 5 Los Angeles Combined Statistical Area $250 17,862
official definitions available that include each city and all its 6 Hong Kong $226 7,504
surrounding suburbs, drawing upon existing definitions from 7 San Francisco Bay Area $187 6,720
Eurostat, the United Nations, Oxford Economics, and many 8 Singapore $177 5,835
individual country statistics agencies. 9 Washington DC Metro $140 6,235
Estimate Methodology 10 Sydney Greater Capital City Area $117 5,379
11 Boston-Cambridge Metro $109 4,860
LaSalle’s $4.6 trillion USD public, listed real estate universe
12 Greater Toronto Area $107 6,713
estimate is the gross value of commercial real estate assets
(GAV) owned by companies traded on stock markets around 13 Seoul Capital Area OECD Metro $98 23,810
Definition
the world, using the most recent available estimates as
14 Chicago Metro $93 9,484
of August 2020. GAV combines net asset value and debt,
15 Shanghai Urban Agglomeration $91 24,386
making it a better measure of the underlying real estate
16 Osaka Prefecture $90 8,841
owned by public firms than net asset value (NAV) or market
17 South Florida (Dade, Broward, Palm $78 6,144
capitalization alone. This measure is also independent of
Beach)
public market pricing. In other words, listed companies can
18 Metropolregion Munchen $76 6,120
trade at very large discounts or premiums to the value of
19 Greater Melbourne Capital City Area $74 5,169
their underlying real estate holdings. Our estimates are
20 Beijing Urban Agglomeration $73 21,634
based on the gross (NAV + debt) asset values of the property,
21 Seattle-Tacoma Metro $71 3,935
not the market capitalization of the listed securities. LaSalle
22 Greater Moscow $69 7,525
Investment Management Securities is the primary source
23 Stockholm Eurostat Metro $65 2,398
for this data. LaSalle Securities actively tracks public real
estate NAVs and debt in the largest developed and emerging 24 Houston Metro $63 6,976
markets. The markets covered by LaSalle Securities represent 25 Guangzhou Urban Agglomeration $58 15,647
the majority of public universe GAV. 26 Berlin & Brandenburg $55 6,190
27 Frankfurt Eurostat Metro $55 2,734
For several emerging markets, such as the Philippines and
28 Atlanta Metro $54 5,945
the United Arab Emirates, we use listed property company
29 Hamburg Eurostat Metro $53 3,189
enterprise values. This data is collected from Citigroup and
30 Shenzhen Urban Agglomeration $53 13,805
Bloomberg. We include listed companies that are long-term
holders of real estate and exclude companies whose primary 31 Zurich Canton $52 1,545
business is residential homebuilding. 32 Helsinki-Uusimaa Region $42 1,687
33 Stuttgart Eurostat Metro $42 2,810
Beginning in 2020, we have also excluded
34 Milan Eurostat Metro $41 4,363
infrastructure REITs, such as cell tower companies,
from our estimate. Our estimates include vertically- 35 Madrid Eurostat Metro $41 6,694
integrated development firms that are also holders of 36 Greater Mexico City $41 26,901
commercial property, which increases the breadth of 37 San Diego Metro $40 3,334
companies included, particularly in markets like China. Our 38 Região Metropolitana de São Paulo $38 21,884
inclusion criteria are broader than those used by global 39 Greater Vancouver $36 2,677
indices such as FTSE EPRA/NAREIT (e.g. we include firms
40 Philadelphia Metro $35 6,091
that do not meet the FTSE EPRA/NAREIT ground rules on
English-language reporting, free float, and size). Source: LaSalle. Estimates as of year-end 2020. Analysis based on office, industrial,
and retail properties only. Population estimates are as of 2020 and are from the UN,
Eurostat, the US Census and local statistical agencies.
LaSalle Investment Management Research & Strategy | Accessing the Real Estate Universe in 2021 10Institutional Public and Private Real Metropolitan Market Estimates, Institutional
Estate Universe Invested (Office, Industrial, Retail)
The $10.2 trillion USD institutional real estate universe Our metro estimates combine a bottom-up and top-
encompasses commercial real estate assets owned down approach, using local data sources and estimates
by institutions, including REITs, pension funds, pooled where they are available, such as in London (IPF), US cities
private funds, and endowments. This universe is (NCREIF), Hong Kong (Rating and Valuation Department),
smaller than the total amount of institutional-grade and MSCI city-level data. Our approach starts with
stock because it is restricted to only those properties national-level institutional invested estimates, adjusted to
currently within institutional portfolios. It is based on represent only office, industrial, and retail market value
a combination of primary data gathered by MSCI in 26 (excluding residential and niche/alternative property
developed markets with data to year-end 2019, custom types). We exclude residential and niche because
LaSalle estimates for six major markets in the Asia-Pacific institutional ownership of these property types differs
region, and top-down LaSalle estimates for 169 markets. very widely between markets.
Beginning in 2018, the top-down estimate is based on a Next, we determine how much each metropolitan market
regression analysis. It uses PPP per capita GDP relative is as a share of the national market – this ranges from
to the US and UK, the urbanization rate, and the market’s 100% in city-states like Hong Kong to well below 5%
Global Real Estate Transparency score to predict the ratio for some major US markets. This share is based on a
of institutional owned real estate to GDP in each market. city’s share of its national index wherever index data
The regression coefficients are estimated based on 32 is available (e.g. in the US, Atlanta’s share is based on
countries where bottom-up data is available and then it is its share of national retail, office, and industrial in the
applied to the other 169 markets. This approach replaces NCREIF index). Where index data is not available, the
Youguo Liang and Willard McIntosh’s a GDP-driven share is estimated using a regression with two inputs: the
investable universe methodology, from their 1999 paper city’s share of national GDP and the city’s average office
Global Commercial Real Estate , which assumed a ratio of market value per square foot (data from JLL). We then
high quality “institutional-grade” real estate to GDP of 45%. multiply the city’s share of the national estimate with the
national total of office, industrial, and retail.
For 26 developed markets covered by MSCI, we adjust
MSCI’s year-end 2019 estimate of the total size of the These estimates are for the entire metropolitan
institutional invested universe. This is a bottom-up market – including the principal city and its suburbs
estimate that includes all properties owned through that are economically connected to it. The geographic
professional managers. MSCI’s estimates are among the definitions for each metropolitan market are based on
best available and are larger than the value of assets local definitions wherever available (e.g. Eurostat for
tracked by the MSCI and NCREIF market indices because most markets in the European Union and, in Australia,
not every investment mandate is included in these we use Greater Capital City Statistical Areas defined
indices. We adjust MSCI’s year-end estimates through by the Australian Bureau of Statistics). In cases where
year-end 2020 by calculating the impact of year to date a true metro area definition was not available or is
changes in exchange rate and apply LaSalle’s forecast for unclear, we use definitions from JLL cities research, the
capital value changes. UN’s definitions of urban agglomerations, and Oxford
Economics. Precise geographic definitions are available
Similar to a year ago, our estimates for Hong Kong,
on request.
Singapore, China, Japan, Australia, and South Korea are
custom estimates based on a combination of bottom-
up data and top-down analysis by LaSalle’s Asia Pacific
Research & Strategy team.
5 Youguo Liang and Willard McIntosh, Prudential Real Estate Research.
“Global Commercial Real Estate.” Published April 1999.
LaSalle Investment Management Research & Strategy | Accessing the Real Estate Universe in 2021 11Total Commercial Income Producing Real properties. The ownership of land in China is retained
Estate Universe by the government and investors purchase long-
term use rights to the land. The value of these usage
The $58 trillion estimate of the total commercial
rights is contained in our estimates of property value
universe is the aggregate value of all commercial
wherever possible.
real estate worldwide, including corporate,
government, and private investor owned assets. The ratio of total income producing real estate to
The total commercial estimate includes property GDP in the US and UK is then the starting point for
of all quality types and is intended to represent our top-down estimates in other markets lacking
the value of all assets that have been or could be bottom-up data. We take this ratio, adjust it based
bought by investors, even if the current owners are on the PPP GDP per capita in each market as well by
not institutional investors (for example, government- the urbanization rate, and then multiply by nominal
owned commercial property or smaller assets held GDP. Our $58 trillion estimate is useful for putting
by individuals or families). the asset class as a whole into perspective and
comparing the relative size of different regions, but
We use bottom-up estimates of total commercial
with notable caveats. There is a large margin of error
income producing real estate in five markets: the
for emerging markets.
US, UK, China, Hong Kong, and Singapore. For the
US estimate, we use the U.S. Bureau of Economic
Analysis’ estimates of fixed real estate assets and
adjust them with Federal Reserve data to incorporate This piece draws on work from a broad group
the value of the land. For the UK, we draw on the across LaSalle Investment Management and
Year-end 2018 IPF Research Programme report that JLL, with specific thanks due to LaSalle Global
estimated the size of the UK property market. For Real Estate Securities, JLL Global Research,
and Joe Oslawski.
China, we used National Bureau of Statistics (NBS)
estimates of the cumulative total value of completed
LaSalle Investment Management Research & Strategy | Accessing the Real Estate Universe in 2021 12Important Notice and Disclaimer This publication does not constitute an offer to sell, or the solicitation of an offer to buy, any securities or any interests in any investment products advised by, or the advisory services of, LaSalle Investment Management (together with its global investment advisory affiliates, “LaSalle”). This publication has been prepared without regard to the specific investment objectives, financial situation or particular needs of recipients and under no circumstances is this publication on its own intended to be, or serve as, investment advice. The discussions set forth in this publication are intended for informational purposes only, do not constitute investment advice and are subject to correction, completion and amendment without notice. Further, nothing herein constitutes legal or tax advice. Prior to making any investment, an investor should consult with its own investment, accounting, legal and tax advisers to independently evaluate the risks, consequences and suitability of that investment.LaSalle has taken reasonable care to ensure that the information contained in this publication is accurate and has been obtained from reliable sources. Any opinions, forecasts, projections or other statements that are made in this publication are forward-looking statements. Although LaSalle believes that the expectations reflected in such forward-looking statements are reasonable, they do involve a number of assumptions, risks and uncertainties. Accordingly, LaSalle does not make any express or implied representation or warranty, and no responsibility is accepted with respect to the adequacy, accuracy, completeness or reasonableness of the facts, opinions, estimates, forecasts, or other information set out in this publication or any further information, written or oral notice, or other document at any time supplied in connection with this publication. LaSalle does not undertake and is under no obligation to update or keep current the information or content contained in this publication for future events. LaSalle does not accept any liability in negligence or otherwise for any loss or damage suffered by any party resulting from reliance on this publication and nothing contained herein shall be relied upon as a promise or guarantee regarding any future events or performance.By accepting receipt of this publication, the recipient agrees not to distribute, offer or sell this publication or copies of it and agrees not to make use of the publication other than for its own general information purposes.Copyright © LaSalle Investment Management 2021. All rights reserved. No part of this document may be reproduced by any means, whether graphically, electronically, mechanically or otherwise howsoever, including without limitation photocopying and recording on magnetic tape, or included in any information store and/or retrieval system without prior written permission of LaSalle Investment Management. LaSalle Investment Management Research & Strategy | Accessing the Real Estate Universe in 2021 13
Amsterdam     Los Angeles   Paris           Sydney

Atlanta       Luxembourg    San Diego       Tokyo

Baltimore     Madrid        San Francisco   Toronto

Chicago       Mexico City   Seoul           Vancouver

Hong Kong     Munich        Shanghai

London        New York      Singapore

lasalle.com
You can also read