Additional Data Sources: Weekly Summary - Flu.nc.gov
←
→
Page content transcription
If your browser does not render page correctly, please read the page content below
Additional Data Sources:
                                                                     Weekly Summary

       COVID-19 Respiratory Surveillance: February 28 – March 6, 2021
                         Updated March 11, 2021
COVID-19 Key Findings
Statewide       During the week ending March 6, 2021, the percentage of emergency department
Updates         visits for COVID-like illness decreased from the previous week.
                The percent of people seen in the emergency department for COVID-like illness
                who had to stay in the hospital decreased.
                The total number of people admitted to hospitals in the Public Health Epidemiologist
                (PHE) network for COVID-19 went down, and the percentage admitted to the ICU
                went down.
                13 new cases of MIS-C meeting the CDC case definition were reported this week.
Regional        Among neighboring states (SC, GA, VA, TN), all 4 states saw a decrease in
Updates         COVID-19 activity based on total case numbers and rate of new cases per 100,000
                population over the last 7 days (03/02/21-03/08/21).
                https://covid.cdc.gov/covid-data-tracker/#compare-trends_newcasesper100k
National        The national percent positive was 8.8% on 03/08.
Updates
                The nationwide rate of new cases per 100,000 population has decreased over the
                past 7 days (03/02/21-03/08/21).
                https://www.cdc.gov/coronavirus/2019-ncov/covid-data/covidview/index.html
International   Worldwide the Americas (North America, Central America, and South America)
Updates         accounted for a majority of COVID-19 infections. For more country specific details
                please visit: https://covid19.who.int/

Influenza Key Findings
Statewide       Influenza-like illness (ILI) remained low the week ending March 6, 2021. The
Updates         geographic spread of flu was SPORADIC this week.
                Of the 260 specimens submitted to the State Laboratory of Public Health (SLPH)
                for viral testing this week, one was positive for influenza type A (H1) and one was
                positive for influenza type A (unsubtyped). PHEs reported one positive influenza
                type A (unsubtyped) result out of 2,833 samples tested during the week ending
                03/06/2021.

Regional        The proportion of visits due to ILI in Region 4 (Southeastern US) was at 1.25% for
Updates         week 8 (ending 02/27/2021). The regional baseline for ILI is 3.1%.
National        The proportion of visits due to ILI nationwide was at 0.87% for week 8 (ending
Updates         02/27/2021). The national baseline for ILI is 2.6%.
International   In worldwide influenza laboratories seasonal influenza B viruses accounted for a
Updates         majority of detections (64.1%) followed by influenza A viruses (35.9%) from
                February 1, 2021 to February 14, 2021. For more country specific details please
                visit:
                https://www.who.int/influenza/surveillance_monitoring/updates/latest_update_GIP_
                surveillance/en/
Introduction
The North Carolina Department of Health and Human Services (NCDHHS) uses
multiple surveillance systems to monitor respiratory diseases across the state. These
surveillance systems include information related to outpatient visits, emergency
department visits, laboratory data, as well as hospital data from epidemiologists at
seven of the state’s largest healthcare systems. Data sources used to gather the
information presented here are described below.

NC DETECT
The North Carolina Disease Event Tracking and Epidemiologic Collection Tool (NC
DETECT) is North Carolina’s statewide, electronic, real-time public health surveillance
system. NC DETECT was created to provide early event detection and timely public
health surveillance using a variety of secondary data sources, including data from the
NC Emergency Departments (EDs). Each ED visit is grouped into syndromes based on
keywords in several different fields and/or diagnosis codes. Two syndromes used to
track COVID-like illness (CLI) and influenza-like illness (ILI) are presented in this report.

CLI and ILI data track the number and percent of emergency department visits that are
for illnesses compatible with COVID-19 or influenza. This includes visits that do not
have positive test results for either disease.

The CLI and ILI syndromes have similarities because COVID-19 and influenza share
many of the same symptoms. However, there a few key distinctions between the two
syndrome definitions. ILI includes the key word term “sore throat” while CLI does
not. CLI contains keyword terms that ILI does not, including ones regarding the loss of
taste and smell, pneumonia, and specific terms like “COVID” and “corona.” CLI also
includes ICD-10-CM diagnosis codes1 specific to COVID-19 and ILI does not include
any ICD-10-CM codes. The syndrome definitions are as follows:

1
  The International Classification of Disease, Tenth Edition, Clinical Modification (ICD-10-CM) system is
used by physicians and healthcare providers to code diagnoses for all patient visits.

NC Department of Health and Human Services | COVID-19 Respiratory Surveillance: February 28 – March 6, 2021   2
CLI and ILI Syndrome Definitions
                                     Influenza-like illness (ILI)           COVID-19-like illness (CLI)
 Chief complaint only                                N/A                    COVID or corona or coronavirus

 Chief complaint or triage           ((fever OR febrile OR FUO OR           loss of sense of smell / taste or no
 notes                               temperature OR Documented              taste / smell or unable to smell /
                                     Initial ED Temp > 38C) AND             taste or loss sense of smell / taste
                                     (cough or sore throat))                or lost taste / smell
                                                                                          OR
                                                                            ((Chief complaint or triage notes:
                                                                            (cough or shortness of breath or
                                                                            SOB or SHOB or respiratory
                                                                            distress or cannot breathe or
                                                                            cyanosis or difficulty breathing or
                                                                            dyspnea or hypoxia or pleural
                                                                            effusion or pneumon or stridor)
                                                                                          AND
                                                                            (Febrile or fev* or fvr or temp or
                                                                            chills or rigor or shivers or initial
                                                                            ED temp > 38))
                                                                                          OR
                                                                            Specific ICD-10-CM codes

 ICD-10-CM Codes                                     N/A                    B97.2% OR B34.2 OR J12.81 OR
                                                                            U07.1 OR U07.2

In order to better differentiate between CLI and ILI, the CLI syndrome definition has
been modified to exclude any visits that contain a diagnosis code for influenza.

    •    If an ED visit has the signs and symptoms of CLI or a diagnosis of COVID-19
         they are included.
    •    If an ED visit has the signs and symptoms of CLI and receives a diagnosis of
         influenza AND COVID they are included.
    •    If an ED visit has the signs and symptoms of CLI but receives an influenza
         diagnosis without also receiving a COVID diagnosis they are excluded.

NC DETECT was created by the North Carolina Division of Public Health (NCDPH) in
collaboration with the Carolina Center for Health Informatics (CCHI) in the UNC
Department of Emergency Medicine.

Public Health Epidemiologists Program

In 2003, NCDPH created a hospital-based Public Health Epidemiologist (PHE) program
to strengthen coordination and communication between hospitals, health departments
and the state. The PHE program covers approximately 38 percent of general/acute care
beds and 40 percent of ED visits in the state. PHEs play a critical role in assuring routine
and urgent communicable disease control, hospital reporting of communicable diseases,
outbreak management and case finding during community wide outbreaks.

NC Department of Health and Human Services | COVID-19 Respiratory Surveillance: February 28 – March 6, 2021         3
Influenza-like Illness Network The U.S. Outpatient Influenza-like Illness Surveillance Network (ILINet), is a collaboration with providers, state health departments, and CDC to conduct surveillance for influenza-like illness. ILINet providers in primary care clinics and hospitals across the state send samples collected from patients with influenza-like illness to the North Carolina State Laboratory of Public Health for testing. With the current COVID-19 pandemic, ILINet has been expanded to include testing for SARS-CoV-2. Providers are asked to submit up to 10 samples from symptomatic patients each week. For ILINet surveillance purposes symptomatic is defined as fever (>100°F) and cough or sore throat. More information about ILINet can be found at flu.nc.gov. NC Department of Health and Human Services | COVID-19 Respiratory Surveillance: February 28 – March 6, 2021 4
COVID-19 SURVEILLANCE 2020-2021                                                                                 SYNDROMIC SURVEILLANCE

                                      What percent of ED visits this season are for
                                    COVID-like illness compared to previous seasons?

           The above graph shows how the percentage of ED visits for CLI this season compares
           to previous seasons. COVID-19 and influenza can both cause fever and respiratory
           illness, so CLI syndrome and ILI syndrome detect some of the same ED visits.

           The percentage of ED visits for COVID-like illness DECREASED the week ending
           March 6, 2021.

           NC Department of Health and Human Services | COVID-19 Respiratory Surveillance: February 28 – March 6, 2021    5
COVID-19 SURVEILLANCE 2020-2021 SYNDROMIC SURVEILLANCE
How does the percentage of ED visits for COVID-like illness
compare between regions of the state?
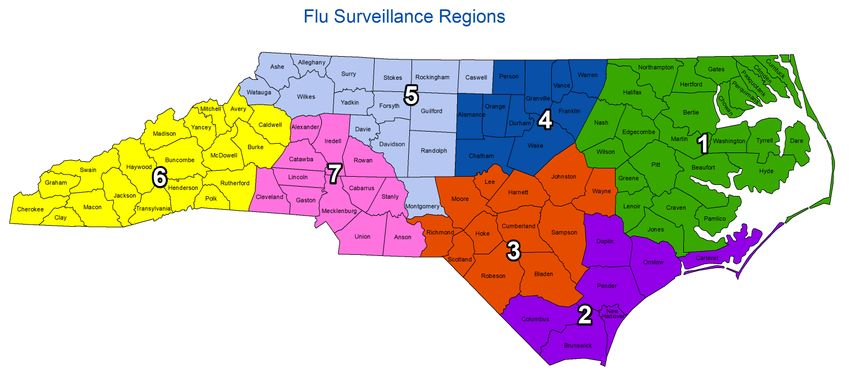
Diseases, including COVID-19, do not spread across the state evenly. The above graph
shows the differences between regions in the percentage of ED visits for CLI. The
colors of the lines correspond to the colors on the region map below.
Regions 1, 3, 5, and 7 showed a DECREASE in the percent of ED visits for CLI the
week ending March 6, 2021. Region 2 showed an INCREASE in the percent of ED
visits for CLI the week ending March 6, 2021. Regions 4 and 6 DID NOT CHANGE
SIGNIFICANTLY* in the percent of ED visits for CLI the week ending March 6, 2021.
*Regions 4 and 6 experiencedCOVID-19 SURVEILLANCE 2020-2021 SYNDROMIC SURVEILLANCE
What percentage of people who go to the ED for
COVID-like illness have to stay in the hospital?
The percentage of patients seen in the ED for CLI who were admitted to the hospital
DECREASED the week ending March 6, 2021.
NC Department of Health and Human Services | COVID-19 Respiratory Surveillance: February 28 – March 6, 2021 7COVID-19 SURVEILLANCE 2020-2021 PUBLIC HEALTH EPIDEMIOLOGIST NETWORK
How many people were admitted to a hospital in the PHE network with COVID-19?
What age groups were admitted most often?
800
700
600
Number of Admissions
500
400
300
200
100
0
6-Jun 6-Jul 6-Aug 6-Sep 6-Oct 6-Nov 6-Dec 6-Jan 6-Feb 6-Mar
Week End Date
Total COVID-19 Admit # (Age 0-4) (Age 5-17) (Age 18-24) (Age 25-49) (Age 50-64) (Age 65+)
The number of people admitted to hospitals in the PHE network for COVID-19
DECREASED the week ending March 6, 2021.
The most hospital admissions were among those 65+ years old the week ending March
6, 2021.
NC Department of Health and Human Services | COVID-19 Respiratory Surveillance: February 28 – March 6, 2021 8COVID-19 SURVEILLANCE 2020-2021 PUBLIC HEALTH EPIDEMIOLOGIST NETWORK
What level of care did COVID-19 patients admitted
to a hospital in the PHE network require?
800 100%
90%
700
80%
600
70%
500
60%
400 50%
40%
300
30%
200
20%
100
10%
0 0%
6-Mar
1-Aug
8-Aug
15-Aug
22-Aug
29-Aug
6-Jun
13-Jun
20-Jun
27-Jun
3-Oct
10-Oct
17-Oct
24-Oct
31-Oct
4-Jul
11-Jul
18-Jul
25-Jul
5-Dec
12-Dec
19-Dec
26-Dec
5-Sep
12-Sep
19-Sep
26-Sep
2-Jan
9-Jan
16-Jan
23-Jan
30-Jan
6-Feb
13-Feb
20-Feb
27-Feb
7-Nov
14-Nov
21-Nov
28-Nov
ICU COVID-19 Admit # Non-ICU COVID-19 Admit # % ICU Admissions
Patients who are admitted to the ICU versus other parts of the hospital require a higher
level of care, may require a ventilator to help them breath, and are more likely to die
from their illness.
The percentage of patients with COVID-19 requiring ICU level of care DECREASED the
week ending March 6, 2021.
NC Department of Health and Human Services | COVID-19 Respiratory Surveillance: February 28 – March 6, 2021 9COVID-19 SURVEILLANCE 2020-2021 PUBLIC HEALTH EPIDEMIOLOGIST NETWORK
What percentage of people tested for the virus
that causes COVID-19 at PHE facilities are positive?
40000 18%
16%
35000
14%
30000
12%
25000
10%
20000
8%
15000
6%
10000
4%
5000
2%
0 0%
Positive Tests Negative Tests Percent Positive
In the week ending March 6, 2021 a total of 21,228 people were tested for the virus that
causes COVID-19 at PHE facilities of which 928 were positive. The percentage of
people who were tested and were positive helps us to understand how common the
virus is in people who get tested for COVID-19.
The percentage of people tested who were positive for the virus that causes COVID-19
DECREASED the week ending March 6, 2021.
NC Department of Health and Human Services | COVID-19 Respiratory Surveillance: February 28 – March 6, 2021 10COVID-19 SURVEILLANCE 2020-2021 MULTISYSTEM INFLAMMATORY SYNDROME IN CHILDREN
How many cases meeting the CDC case definition for Multisystem Inflammatory
Syndrome in Children (MIS-C) Associated with COVID-19
have been reported in North Carolina?
Number of New Cases Reported Total Reported Cases in NC
Week Ending March 6, 2021
13 132
12
10
8
6
4
2
0
Week of MIS-C Symptom Onset
Multisystem inflammatory syndrome in children (MIS-C) is a rare health condition that
has been identified in a small subset of children with current or recent COVID-19. MIS-C
is similar to other serious inflammatory conditions such as Kawasaki disease and toxic
shock syndrome. Children with MIS-C can have problems with their heart and other
organs and need to receive medical attention.
NCDPH is looking for cases of this new syndrome is three different ways:
1. Physicians directly report suspect cases to NCDPH
2. PHEs report suspect cases to NCDPH
3. NC DETECT does surveillance for children with compatible symptoms
4. The graph above shows the number of cases that met the CDC case
definition for MIS-C by the week their MIS-C symptoms first started. More
information on MIS-C is available from CDC here.
NC Department of Health and Human Services | COVID-19 Respiratory Surveillance: February 28 – March 6, 2021 11INFLUENZA SURVEILLANCE 2020-2021 SYNDROMIC SURVEILLANCE
What percent of ED visits this season are for
influenza-like illness compared to previous seasons?
6%
5%
4%
ILI %
3%
2%
1%
0%
Week End Date
June 2018- March 2019 June 2019- March 2020 June 2020- March 2021
The above graph shows how the percentage of ED visits for influenza-like illness this
season compares to previous seasons. Influenza and COVID-19 can both cause fever
and respiratory illness, so influenza-like illness syndrome and COVID-like illness
syndrome detect some of the same ED visits.
The percentage of ED visits for influenza-like illness DID NOT CHANGE
SIGNIFICANTLY* the week ending March 6, 2021.
*The state experiencedINFLUENZA SURVEILLANCE 2020-2021 SYNDROMIC SURVEILLANCE
How does the percentage of ED visits for influenza-like illness
compare between regions of the state?
9%
8%
7%
6%
5%
% ILI
4%
3%
2%
1%
0%
Week Ending Date
Region 1 % ILI Region 2 % ILI Region 3 % ILI Region 4 % ILI Region 5 % ILI Region 6 % ILI Region 7 % ILI
Diseases, including influenza, do not spread across the state evenly. The above graph
shows the differences between regions in the percentage of ED visits for influenza-like
illness. The colors of the lines correspond to the colors on the region map below.
Regions 1 and 3 showed a DECREASE in the percent of ED visits for influenza-like
illness the week ending March 6, 2021. Region 2 and 6 showed an INCREASE in the
percent of ED visits for influenza-like illness the week ending March 6, 2021. Regions
4, 5, and 7 DID NOT CHANGE SIGNIFICANTLY* in the percent of ED visits for
influenza-like illness the week ending March 6, 2021.
*Regions 4, 5, and 7 experiencedINFLUENZA SURVEILLANCE 2020-2021 INFLUENZA DEATHS
How many patients had an influenza-associated
death this flu season?
An influenza-associated death is defined for surveillance purposes as a death (adult or
pediatric) resulting from a clinically compatible illness that was confirmed to be influenza
by an appropriate laboratory or rapid diagnostic test with no period of complete recovery
between the illness and death.
Influenza-Associated Deaths Reported in North Carolina (10/3/20-5/8/21)
Flu Deaths Week Ending in 03/06 Total Flu Deaths
0 6
Laboratory Confirmed Influenza Deaths by Week, 2020-2021
25
Number of Deaths
20
15
10
5
1 1 1 1 2
0
Week End Date
Adult Deaths Pediatric Deaths
Influenza-Associated Deaths Reported in North Carolina, by Age Group 2020-2021
10
8
No. of Deaths
6
5
4
2
1
0
0-4 5-17 18-24 25-49 50-64 65+
Age Group
NC Department of Health and Human Services | COVID-19 Respiratory Surveillance: February 28 – March 6, 2021 14INFLUENZA SURVEILLANCE 2020-2021 LABORATORY SURVEILLANCE
Influenza Positive Tests Reported by SLPH
25 50%
20 40%
15 30%
10 20%
5 10%
0 0%
A (not subtyped) 2009 A (H1N1) Seasonal A (H3) B (Victoria)
B (Yamagata) B (not subtyped) Percent Positive †
Influenza Virus Isolate Results for 2020–2021 Season*
# Positive from SLPH Total Positive for SLPH # Positive from PHE Total Positive for PHE
Virus Type (02/28/21-03/06/21) (09/27/20-05/08/2021) (02/28/21-03/06/21) (09/27/20-05/08/2021)
A (unknown) 1 7 1 19
2009 A(H1N1) 1 2 0 1
A(H3) 0 0 0 2
B (unknown) 0 1 0 8
B (Victoria) 0 1 N/A N/A
B (Yamagata) 0 0 N/A N/A
Total 2 11 1 30
* 2020-2021 influenza season began September 27, 2020
NOTE: PHE facilities cannot differentiate Flu B, SLPH data may change due to the COVID-19 response.
Influenza Positive Tests Reported by PHE Facilities
25 10%
20 8%
15 6%
10 4%
5 2%
0 0%
A (not subtyped) 2009 A (H1N1) Seasonal A (H3) B (not subtyped) Percent Positive †
NC Department of Health and Human Services | COVID-19 Respiratory Surveillance: February 28 – March 6, 2021 15RESPIRATORY DISEASE SURVEILLANCE 2020-2021 LABORATORY SURVEILLANCE
What respiratory viruses are being found in patients
tested at hospitals in the PHE network?
6000
5000
4000
Number of Positive Results
3000
2000
1000
0
Week Ending Date
# RSV Positive # Parainfluenza Positive # Adenovirus Positive # Rhinovirus Positive
# hMPV Positive # Influenza Positive # COVID-19 Positive
Many viruses can cause respiratory illness. The graph above shows all tests for the
listed respiratory viruses done at hospital laboratories in the PHE network. Tracking test
results for patients in this network of health systems can help us to understand what
other viruses are making people sick. It is important to remember that the number of
positive tests depends on how many tests are done, so will change based on access to
testing and testing priorities.
The most common respiratory virus seen in PHE facilities was SARS-CoV-2, the virus
that causes COVID-19 the week ending March 6, 2021.
NC Department of Health and Human Services | COVID-19 Respiratory Surveillance: February 28 – March 6, 2021 16RESPIRATORY DISEASE SURVEILLANCE 2020-2021 LABORATORY SURVEILLANCE
What respiratory viruses are being found in symptomatic patients
tested at the State Laboratory of Public Health?
1,400
1,200
1,000
Number of Results
800
600
400
200
0
Week Ending Date
COVID-19 Positive Flu Positive COVID-19 & Flu Positive Flu/COVID-19 Negative
The State Laboratory of Public Health (SLPH) tests specimens submitted from
symptomatic patients for influenza and COVID-19 using a multiplex assay. Depending
on laboratory capacity, a small number of nasopharyngeal specimens may also be
tested for other respiratory viruses if they are negative for both influenza and COVID-19.
The graph shows the results from all tests for the respiratory viruses listed above and
performed at SLPH on specimens from symptomatic patients. Tracking test results for
patients at SLPH can help us to understand the distribution of COVID-19 and influenza
as well as potential co-infections. Because testing at SLPH focuses on prioritized
populations at increased risk for COVID-19 and all results in the graph came from
specimens collected from symptomatic patients, the percentage of positive tests for
COVID-19 is likely to be higher than the state average.
There were 48 specimens positive for COVID-19, two specimens positive for influenza,
and no co-infections out of 260 specimens tested at SLPH the week ending in March 6,
2021.
NC Department of Health and Human Services | COVID-19 Respiratory Surveillance: February 28 – March 6, 2021 17Who are the non-hospital participants in North Carolina’s Influenza sentinel
surveillance program reporting data and samples?
Local Health Departments Private Practices Colleges and Universities
Student Health Programs
Alamance County Health ECU Department of Elizabeth City State U Student Health
Department Pediatrics Services
Northampton County Health Duke Primary Care Oxford NC A&T State University Student
Department Health Center
Franklin County Health Department Sisters of Mercy Urgent Wake Forest University
Care South
Pender County Health Department Dilworth Pediatrics ASU Health Services
Stokes Family Health Center UNC-Charlotte Student Health Center
Craven County Health Department UNC Chapel Hill
Johnston County Health Department ECU Student Health Services
Cabarrus Health Alliance Meredith College Student Health
Wilkes County Health Department
Rockingham County Division of
Public Health
Stanly County Health Department
Legend
Urgent Care Local Health Dept.
Student Health Pediatrics Family Practice
NC Department of Health and Human Services | COVID-19 Respiratory Surveillance: February 28 – March 6, 2021 18You can also read