Addressing Airport Congestion as Traffic Takes Off in the Age of Uber and Lyft - ACRP University Design Competition
←
→
Page content transcription
If your browser does not render page correctly, please read the page content below
Addressing Airport Congestion
as Traffic Takes Off in the Age
of Uber and Lyft
ACRP University Design Competition

Graduate Student Team: Shannon Eibert, Ian Girardeau, and Jaime
Phillips;Advisor: Michael Smart
RUTGERS UNIVERSITY | APRIL 29, 2019
Acknowledgements
Special thanks to:

       Peter Carbonaro
       Eva Cheong
       Don Free
       Craig Leiner
       Peter Mandle
       Kathe Newman
       Sarah Pilli
       Julian Porta
       Kelcie Ralph
       Melissa Sabitine
       Stuart Shapiro
       Michael Smart
       Shirlene Sue
       Thor Vasquez

For their expertise, advice, and assistance in developing this report.
Executive Summary
This report examines potential solutions to address landside congestion caused by the
operation of Transportation Network Companies (TNCs), such as Uber and Lyft, on airport
facilities. Since their official introduction to airports in 2015, TNC mode share has risen
dramatically compared to traditional airport access modes, including taxis, limousines, shared
vans, personal vehicles, and public transportation. The team’s recommendations aim to reduce
congestion at the terminal curbside, reduce CO2 emissions, streamline the passenger and driver
experience, and recover the airport’s costs of providing services to TNCs operating at their
facilities.
The recommendations are intended for large-hub airports and include (1) combining TNC
drop-off, pick-up, and pre-dispatch staging in a single terminal-adjacent, non-curbside facility, in
addition to having a larger non-terminal-adjacent staging area for longer waits; (2) using re-
match, which allows drivers dropping passengers off to be immediately paired with another
passenger if one is available, to eliminate trips to the staging lot; (3) increasing awareness and
enforcement of no idling regulations to reduce CO2 emissions; (4) restructuring the pricing
scheme to allow curbside drop-off and pick-up for a higher price to allow for convenience while
incentivizing use of the non-curbside facility, and; (5) raising per-trip fees for TNCs serving
airport passengers to cover operating costs. The report also contains a literature review of
existing research on the impact of TNCs on airport operations, and a Safety Risk Assessment
(SRA) and Cost-Benefit Analysis (CBA) of the proposed policy recommendations and design
changes. These analyses, along with several interviews conducted with landside management
staff from multiple airports, informed the final recommendations.Table of Contents 1. Problem Statement and Background........................................................................................... 1 2. Literature Review........................................................................................................................ 2 2.1 TNC Background .................................................................................................................. 2 2.2 TNC Permitting ..................................................................................................................... 2 2.3 Congestion from TNCs ......................................................................................................... 3 2.4 TNC Operations Siting Locations ......................................................................................... 5 2.5 TNC Enforcement ................................................................................................................. 9 2.6 TNC Impacts on Other Modes .............................................................................................. 9 2.7 TNC Revenue Impacts ........................................................................................................ 10 2.8 TNC Revenue Pricing Strategies......................................................................................... 11 3. Problem Solving Approach ....................................................................................................... 12 3.1 Reasoning and Methodology............................................................................................... 12 3.2 Recommendations ............................................................................................................... 13 4. Safety Risk Assessment ............................................................................................................ 15 5. Description of Technical Aspects ............................................................................................. 18 5.1 Driver Decision Methodology............................................................................................. 18 5.2 Geofence Requirements ...................................................................................................... 19 6. Description of Interactions with Airport Operators and Industry Experts ................................ 20 7. Projected Impacts ...................................................................................................................... 21 7.1 Cost-Benefit Analysis ......................................................................................................... 22 7.2 Other Considerations ........................................................................................................... 30 8. Conclusion ................................................................................................................................ 31 Appendix A. .................................................................................................................................. 32 Appendix B. .................................................................................................................................. 33 Appendix C. .................................................................................................................................. 35 Appendix D. .................................................................................................................................. 37 Appendix E. .................................................................................................................................. 39 Student Evaluation .................................................................................................................... 39 Faculty Evaluation..................................................................................................................... 42 Appendix F.................................................................................................................................... 44
Table of Tables
Table 1: Estimated volumes for departing and non-connecting passengers at LAX, SFO,
and OAK (2015) ............................................................................................................................ 5
Table 2: Safety risk assessment including mitigation strategies............................................. 17
Table 3: Costs of developing the project ................................................................................... 23
Table 4: Costs of combining pick-up, drop-off, and pre-dispatch staging ............................ 24
Table 5: Description of Benefit Scenarios................................................................................. 27
Table 6: Benefits of Combined Pick0up, Drop-off, and Pre-dispatch Staging ..................... 28
Table 7: The costs and benefits projected for 10 years using a 3%, 5%, and 7% discount
rate................................................................................................................................................ 30

Table of Figures
Figure 1: Airports that have operational agreements with Lyft (2019)................................... 6
Figure 2: Lyft airport drop-off location by NPIAS 2019-2023 hub classification (2019) ....... 7
Figure 3: Lyft airport pick-up location by NPIAS 2019-2023 hub classification (2019) ........ 7
Figure 4: Detailed curbside Lyft airport pick-up location by NPIAS 2019-2023 hub
classification (2019) ....................................................................................................................... 8
Figure 5: Hazard rating matrix ................................................................................................. 16
Figure 6: TNC driver decision process ..................................................................................... 18
1. Problem Statement and Background
       In recent years, airports have faced rising landside congestion and a shift in landside

revenue due to changes in mode choice among airline passengers. One impetus for these changes

is the rise of Transportation Network Companies (TNCs) operations at airports. TNC drivers

often vie for the same curb-frontage and passengers as other, more established airport passenger

transport modes, such as private vehicles, taxis, limousines, shared-ride vans, and public transit.

A 2019 survey of the top 25 largest U.S. airports found that since the rise of TNC operations, the

majority of airports with TNC operations have experienced a decrease in the overall demand for

taxis, limousines, shared-ride vans, rental cars, and — important for revenues — private vehicle

parking. Of the airports that reported their mode-share revenues, the majority indicated a decline

in total revenues from taxi, limousine, and shared-ride vans with the rise of TNC usage (Ricondo

& Associates, 2019). A 2016 survey of the largest 100 U.S. airports - herein referred to as the

2016 Mandle and Box survey - found that airports at which TNCs have been operational for

more than one year experienced a decrease of 5% to 10% in the number of parking transactions,

entries and exits, per airline passenger (Mandle & Box, 2017).

       Developing a solution for TNC management is vital for achieving the best operational

efficiency of airport landside access and for meeting the desires of airport passengers.

Establishing best practices for TNC management now will likely enhance airport efficiency

when the impending rise of autonomous vehicles (AVs) becomes a reality and the demand for

airport travel modes shifts again.

                                                                    Eibert, Girardeau, and Phillips | 1
2. Literature Review
2.1 TNC Background
Although the definition varies from state to state, in general, a Transportation Network
Company (TNC) is a mobility service provider or ride-hailing service that connects riders with
drivers through a phone application or digital network in which drivers provide their own
personal vehicles for transport. TNCs are generally more loosely regulated than taxicab and
limousine services and as a result, usually offer less expensive fares (Conway, Salon, & King,
2018). The most popular TNCs in the United States are Lyft and Uber, although there are many
additional TNCs, some of which operate at the regional or municipal level.
The rise of TNCs began in San Francisco in 2010 with the founding of UberCab, now
Uber, as an app-based luxury ride-hailing service. Lyft, which evolved from Zimride, a 2007
carpooling application designed to reduce vehicle congestion and the cost of car ownership,
launched in 2012 (Shaheen, 2018). Reviewing data from the 2017 National Household Travel
Survey (NHTS) indicated that since 2009, the use of TNCs has doubled and reached a relatively
high market penetration comparable to that of public transit usage (Conway, Salon, & King,
2018).
2.2 TNC Permitting
The first airport to enter into an operational agreement with a TNC company was
Nashville International Airport (BNA) in 2014, followed shortly thereafter that year by San
Francisco International Airport (SFO). In both cases, TNCs had been in operation at these
airports prior to a formalized agreement with airport operators (Mandle & Box, 2017). In 2015,
TNCs began to eclipse taxi usage at airports (Nelson, 2018) and today more than 343 airports
nationwide have entered into operational agreements with TNCs (Lyft, 2019).
Eibert, Girardeau, and Phillips | 2As with taxis, limousine companies, and other private operators, airports generally
require that TNCs obtain a permit to operate on airport property. Unlike private services with
professional drivers, TNCs receive a company-wide permit because of the large volume of
drivers and high turnover rate (Mandle & Box, 2017). According to their respective websites,
Lyft has agreements to operate at 343 airports in the U.S. and Uber has agreements to operate at
146 airports in the U.S. (Lyft, 2019; Uber, 2019).
TNC permits cover the use of roads at the airport, the location for pick-up and drop-off,
fees charged to the TNC, driver behavior, and Federal Aviation Administration (FAA) or airport
specific rules regarding the appearance, vehicle make, and identification of TNC vehicles
(Mandle & Box, 2017; Lyft 2019). TNCs are responsible for training and disciplining negligent
drivers, in addition to paying any fines incurred by them. Financial requirements for the TNC
typically cover insurance, airport fees, use of a geofence (TNC mobile app enabled to track TNC
driver movements using GPS), driver training, and remedial action for drivers (Mandle & Box,
2017).
2.3 Congestion from TNCs
Congestion occurs when demand for use of a roadway outstrips its capacity. At airports,
growing air traffic has led to increased landside traffic congestion, as passenger demand
increases but roadway capacity remains constrained (Failla, Bivono, & Ventola, 2014). Effective
roadway capacity at airports is in part limited by curb space; simply adding a travel lane may not
meaningfully increase roadway capacity if drivers are all vying for space in the curb lane.
Landside congestion, particularly at the curbside, should be mitigated as much as possible as it
inhibits passenger flow, a safety concern since it limits airport access and egress. Curbside
congestion also detracts from the passenger experience and research has indicated that it directly
Eibert, Girardeau, and Phillips | 3contributes to a passenger’s perception of an airport’s quality of service (Failla, Bivono, &
Ventola, 2014). In addition, vehicle congestion creates negative environmental externalities,
primarily increased greenhouse gas emissions from vehicle emissions and higher rates of
crashes.
One solution to growing passenger volumes at airports would be to encourage higher-
occupancy vehicle trips. Yet the vast majority of passengers traveling to airports choose to take
private transportation due to the high level of reliability. Personal vehicles, taxis, limousines, and
private TNC trips all qualify as private trips, whereas public transportation, shared shuttles, and
shared TNC rides are classified as shared trips. In 2015, it was found that Los Angeles
International Airport (LAX), San Francisco International Airport (SFO), and Oakland
International Airport (OAK), three airports where TNC usage is prominent, had private trip rates
of 78%, 63%, and 70% respectively (Hermawan, 2018).
Airports looking to reduce congestion would be well advised to encourage travelers to
take shared modes of transportation to decrease the number of vehicles entering the airport’s
roadways. With finite curb space, there is a limit to the number of vehicles that can occupy the
pick-up and drop-off zones at a given time, thus vehicles carrying more passengers are more
efficient at reducing curbside congestion.
Though many TNCs offer shared-ride services in which multiple passengers can occupy
the same TNC vehicle for their trip, they have been relatively ineffective at reducing airport
congestion. In 2015, when TNCs began offering shared rides through services like Lyft Line and
UberPool, Hermawan found that TNCs replaced a larger number of shared rides than they
created at SFO and OAK. As seen in Table 1, this study determined that 1.7% and 0.9% of
departing passengers at these airports respectively switched from shared modes to private TNC
Eibert, Girardeau, and Phillips | 4rides (Hermawan, 2018). This indicates that despite the availability of TNC shared-ride services,
many airport passengers actually switched from shared modes to private rides, increasing airport
congestion. A survey of the largest 25 airports in the U.S. indicated that TNC growth
significantly worsened roadway congestion for a majority of airports (Ricondo & Associates,
2019).
Table 1: Estimated volumes for departing and non-connecting passengers at LAX, SFO, and OAK
(2015)
Description SFO OAK
Total 2,367,042 232,933
Used TNCs 1,597,121 134,485
Substituted shared modes with TNCs 339,388 40,345
Complemented shared modes with TNCs 71,740 15,069
Substituted transit with TNCs 239,568 28,241
Complemented transit with TNCs 65,881 14,793
Used pooled TNCs 53,344 0
Source: Hermawan, K. (2018). Transportation Network Companies' (TNC) Impacts and Potential
on Airport Access. (Doctoral dissertation) UC Irvine. Retrieved from
https://escholarship.org/uc/item/01m726rr
2.4 TNC Operations Siting Locations
A major concern of airport operators regarding TNC traffic is that of cruising, where
TNC drivers travel slowly through the pick-up lane, hoping for a passenger. This contributes to
curbside congestion and creates safety issues. The most common solution to this problem is the
creation of staging areas where drivers wait to be matched with a passenger before entering the
pick-up zone (Mandle & Box, 2017). A 2016 survey of 100 large airports found that 82% of the
responding airports had designated staging areas for TNC vehicles to wait for customers, with
55% providing space in a surface lot, 20% in a parking structure, and 7% in an area utilized by
taxis or other ground transportation (Mandle & Box, 2017).
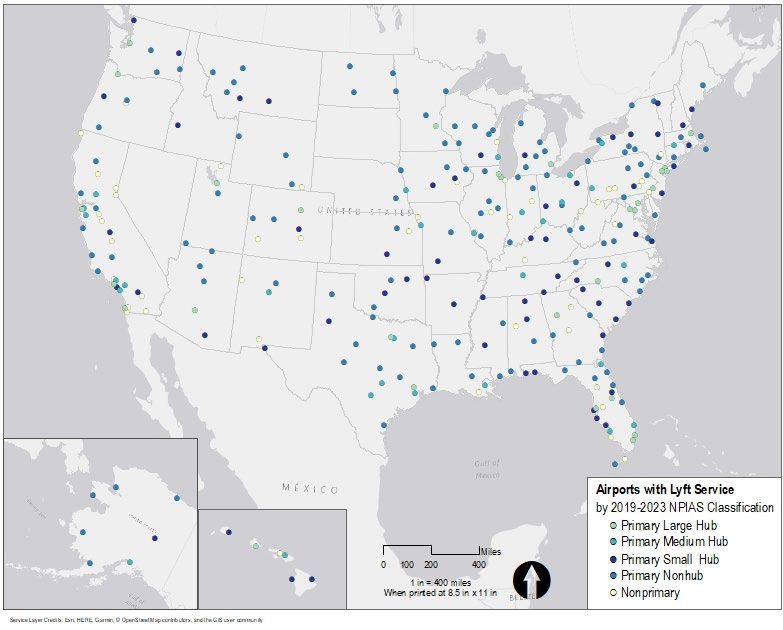
We conducted an analysis of TNC pick-up, drop-off, and staging locations using the
information available on Lyft’s website which stated rules and locations for pick-up, drop-off,
Eibert, Girardeau, and Phillips | 5and staging areas for the 343 airports in the U.S. at which they operate. The airports included in
this analysis are provided in Figure 1.
Figure 1: Airports that have operational agreements with Lyft (2019)
This analysis revealed that all airports allow drop-offs at the curbside and that the
majority (224) allow drop-offs at the passenger’s airline of choice at the same curbside location
as private vehicles. Twenty airports have a designated curbside area for TNC drop-offs and three
require TNCs to use the commercial vehicle lane. The majority of airports allow curbside pick-
up, with 14 specifying designated areas in surface lots and 10 specifying designated areas in
parking garages. Of those airports allowing curbside pick-up, 127 allow pick-up at the
passenger's airline, 88 at a curbside designated area, and 10 at a commercial designated area. The
Eibert, Girardeau, and Phillips | 6percentage of types of airport drop-off and pick-up locations in use by airports according to their
NPIAS 2019-2023 classification are depicted in Figure 2 and Figure 3 respectively. Figure 4
illustrates detailed information for airports allowing curbside pick-up.
Figure 2: Lyft airport drop-off location by NPIAS 2019-2023 hub classification (2019)
100%
90%
80%
70% Commercial
60% Vehicle Lane
50% Curbside
Designated Area
40%
Passenger's Airline
30%
20%
10%
0%
Large Hub Medium Hub Small Hub Non-Hub
Figure 3: Lyft airport pick-up location by NPIAS 2019-2023 hub classification (2019)
100%
90%
80%
70%
60% Parking Garage
50% Surface Lot
40%
Curbside
30%
20%
10%
0%
Large Hub Medium Hub Small Hub Non-Hub
Eibert, Girardeau, and Phillips | 7Figure 4: Detailed curbside Lyft airport pick-up location by NPIAS 2019-2023 hub classification
(2019)
100%
90% Parking Garage
80%
70%
Surface Lot
60%
50%
Commercial
40% Designated Area
30%
Curbside Designated
20% Area
10%
Passenger's Airline
0%
Large Hub Medium Hub Small Hub Non-Hub
Categorizing the airports in this dataset using the National Plan of Integrated Airport
Systems (NPIAS) 2019-2023 classifications for large, medium, small, and non-hub airport
highlights some trends in pick-up and drop-off location (U.S. Congress, 2019). First, large hub
airports use parking garages for pick-ups at higher rates than surface lots (Figure 3). This may
indicate that large hub airports tend to have parking garages in close proximity to the airport
rather than surface lots. Second, a higher percentage of large hub airports require pick-up at
designated areas on the curbside than at medium and small hub airports (Figure 3). Regardless
of an airport’s NPIAS hub-size classification, all hub airports require curbside pick-up at a
designated location at a significantly higher rate than non-hub airports (Figure 4).
Eibert, Girardeau, and Phillips | 82.5 TNC Enforcement
The addition of TNC traffic to airport pick-up and drop-off zones has shifted
responsibilities for airport employees. The 2016 Mandle and Box survey found that 87% of
responding airports depend on traffic officers and operations employees to enforce TNC rules.
Approximately 50% of the airports relied partially or completely on police officers to enforce
TNC regulations (Mandle & Box, 2017). A 2019 survey of the top 25 largest U.S. airports
indicated that TNC growth has led to additional staff roles in TNC administration, maintenance,
security, enforcement, and traffic control (Ricondo & Associates, 2019).
Most airports use geofences to gather data and enforce rules on TNCs. Geofencing is a
technology that uses app-based GPS tracking to monitor TNC movements within the
geographical boundaries (the “fence”) of the system. When a TNC vehicle crosses the geofence
boundary, it begins transmitting travel information to the airport’s geofence system. This allows
airports to track the number of TNC vehicles entering their facility. This information is used to
ensure that TNCs are meeting their payment obligations under their operational agreements.
(Mandle & Box, 2017).
Geofences can also be used to restrict driver access to TNC apps to a particular staging
area, preventing them from cruising through the pick-up area while searching for a new customer
(Curtis, 2015). A 2016 survey of 100 large airports found that 44% of responding airports
designated their staging area as the sole location at which TNC drivers could receive new
customer requests while within the geo-fenced boundary (Mandle & Box, 2017).
2.6 TNC Impacts on Other Modes
Many airports have limited data on TNCs because they have not been operating for long
and data collection was initially sporadic. Before-and-after research conducted at SFO found that
Eibert, Girardeau, and Phillips | 9of individuals now using TNCs, 50% previously used taxis, 22% used transit, and 18% used
private vehicles (Mandle & Box, 2017). At SFO, there is an estimated decrease in taxi trips by 5-
20%, a decrease in shared van trips, and no change in limousine trips (Mandle & Box, 2017). A
2019 survey of the top 25 largest U.S. airports reported that since the rise of TNCs at their
airport, the majority have experienced a decrease in the overall demand for taxis, limousines,
shared-ride vans, rental cars, and private vehicle parking (Ricondo & Associates, 2019).
LAX, another early adopter of TNCs, included them as a travel mode option for a
passenger study for the first time in 2015. According to LAX data, this new mode has grown
significantly, quickly catching up to taxi use (Hermawan & Regan, 2018). In addition, the share
of TNC use at the airport is expected to continue increasing due to the lower price point of TNCs
over other private modes (taxi, limousine, etc.) and a shorter trip time than shared modes (shared
van, public transit, etc.) (Hermawan & Regan, 2018). Interviews conducted by the project team
with airport staff at LAX, SFO, JFK, and LGA indicate that this trend is consistent at other large-
hub airports.
2.7 TNC Revenue Impacts
According to a review of global airport revenues, non-aeronautical revenues generated
approximately $7.12 billion in 2018 (Papatheodorou, 2018). Globally, about 20.5% of this
revenue was generated by car parking, but in North America this share was nearly double, at
40.8%, illustrating the importance of parking fares as a revenue source for U.S. airports
(Papatheodorou, 2018). Airport revenue is sensitive to parking and ground transportation that
could be affected by changes to the general transportation system (Zhang & Wang, 2017). The
prevalence and convenience of TNCs causes many passengers to shift their mode choice from
taxis and personal vehicles to TNCs, representing a meaningful change to the overall
Eibert, Girardeau, and Phillips | 10transportation system (Feng & Miller-Hooks, 2014). Despite an average 10-20% decline in
private vehicle usage for airport trips and a 5-10% decline in average airport parking customers
(Mandle & Box, 2017), aircraft parking capacity and fees are currently formulated based on
historical passenger throughput, travel mode splits, and projected future aircraft demand (Feng &
Miller-Hooks, 2014). Lost parking transactions due to the rise of TNCs are not included in this,
indicating that airports may wish to adjust the pricing of TNC fees to make up for this forgone
revenue.
The 2016 Mandle and Box survey found that, in addition to the average decline in airport
parking transactions, airport rental car transactions have also decreased by an average of 13%
and taxicab trips by an average of 5-13%. Of the 100 airports surveyed, all but two indicated that
TNC fees did not outpace the loss of parking, taxi, and rental car revenues (Mandle & Box,
2017). Of those that reported their mode-share revenues in a 2019 survey of the top 25 largest
U.S. airports, the majority indicated a decline in total revenues from taxi, limo, and shared-ride
vans with the rise of TNC usage (Ricondo & Associates, 2019).
2.8 TNC Revenue Pricing Strategies
Airports are using multiple strategies to price TNCs. The majority of airports (98%)
require that TNCs pay one or more of the following (Mandle & Box, 2017):
● Annual permit fees. These have historically averaged $2,000 per year.
● An activation fee, also known as a geofence fee, at the time of signing an operational
agreement. These have historically ranged from $1,000 to $100,000.
● Per-trip fees for passenger pick-ups, drop-offs, or both, paid by TNCs on a monthly basis.
● A minimum annual guarantee (MAG) amount which charges the higher of either a per-
trip fee or a minimum annual guarantee fee.
Eibert, Girardeau, and Phillips | 11A substantial majority (87%) of airports require per-trip fees, which are difficult for airports
to price when negotiating an operational agreement because airports lack information about TNC
mode-share and the costs associated with providing services to TNCs (Mandle & Box, 2017).
Currently, per-trip fees range from $1.00-$5.00 per pick-up trip and $1.00-$4.00 per drop-off trip
(Mandle & Box, 2017). When pricing per-trip fees, airports should consider that the demand for
outbound TNC trips outweighs the demand for inbound TNC trips (Feng & Miller-Hooks, 2014);
existing taxi and limousine fees; fees charged by peer airports; and the revenue needed to cover
the provision of TNC services and forgone parking revenue (Mandle & Box, 2017). More than
80% of airports have relied on TNCs for self-reporting trips, but some airports have initiated
geofences to track TNC trips to ensure proper payment (Mandle & Box, 2017).
3. Problem Solving Approach
3.1 Reasoning and Methodology
As TNCs gain popularity among airline passengers, airports are searching for ways to
address this new source of curbside congestion. One team member was anecdotally aware that
airport operators were uncertain of how to handle TNCs as permitting legislation allowed them
to operate in more localities.
Data from maps of airports that Lyft serves was compiled to determine the locations of
drop-off, pick-up, and staging areas. Lyft was chosen because of the availability of data on their
website and because it operates at more airports in the United States than any other TNC. This
data informed the decision to focus the project on large-hub airports, as classified by the NPIAS
2019-2023, since large hub airports use parking garages for TNC pick-ups at a higher rate than
other airport classifications. This may imply higher rates of curbside congestion at large hub
airports, which can be ameliorated through the use of parking garages as pick-up locations.
Eibert, Girardeau, and Phillips | 12Based on this information and phone interviews with industry experts, the topic was further
refined to focus on reducing TNC-based congestion at large hub airports with the understanding
that these airports have the most significant problems due to higher airline passenger volumes.
A review of the January 14, 2019 Draft ACRP 01-35 report titled “Transportation
Network Companies (TNCs): Impacts to Airport Revenues and Operations,” led to a phone
interview with the Principal Investigator, Craig Leiner. Our interview with Mr. Leiner influenced
the decision to focus our recommendations on innovative approaches for TNC management.
Additionally, personal experiences utilizing TNCs at large-hub airports shaped our desire to
promote passenger-friendly solutions.
A phone conversation with landside operations staff at the Port Authority of New York
and New Jersey (PANYNJ) informed our decision to move away from recommending the
combination of drop-off, pick-up, and staging in one location, to instead recommending the
combination of drop-off, pick-up, and pre-dispatch staging in addition to a non-terminal adjacent
staging area. Establishing a separation between pre-dispatch staging and the staging done while
waiting to reach the front of the queue to be matched with a passenger was changed in response
to the large numbers of TNC drivers that may be waiting in staging lots at any one time.
3.2 Recommendations
Our recommendations aim to reduce congestion at the terminal curbside, reduce CO2
emissions, streamline the passenger experience, and recover the costs of providing services to
TNCs serving the airport. The recommendations include (1) combining TNC drop-off, pick-up,
and pre-dispatch staging in a single terminal-adjacent, non-curbside location along with a larger
non-terminal adjacent staging area for long-term waiting; (2) using re-match for drivers
dropping-off passengers to eliminate trips to the staging lot; (3) increasing awareness and
Eibert, Girardeau, and Phillips | 13enforcement of no-idling regulations to reduce CO2 emissions; (4) restructuring the pricing
scheme to allow curbside drop-off and pick-up for a higher price to incentivize usage of non-
curbside location; and (5) raising per-trip fees for TNCs serving airport passengers.
Combining TNC drop-off, pick-up, and pre-dispatch staging into a central location allows
for more efficient TNC operations by eliminating travel time between the drop-off and pick-up
zones for drivers who are able to re-match after dropping a passenger off. Re-match refers to
drivers receiving a new fare (rider) directly after dropping off a passenger, typically within 30 to
60 seconds. Drivers who are able to re-match eliminate a trip to and from the staging lot. Drivers
that do not get a re-match proceed to the staging lot to enter the “virtual queue.” TNCs use a
first-in, first-out model for assigning rides that queues the drivers based on when they arrive at
the staging lot. With pre-dispatch staging, once a driver reaches a certain position in the virtual
queue, that driver will move from the non-terminal adjacent staging lot to the pre-dispatch
staging area near the terminal. This will eliminate wait time for passengers because the TNC
drivers will be at the pick-up area when they are matched. It is further recommended that airports
locate the combined pick-up and drop-off facilities close to the terminal to allow passengers
easier access. Due to decreases in private vehicle parking and rental car usage, some parking
garages that house these facilities may have underutilized space that can be repurposed for TNC
operations, ensuring that the airport maximizes its use of space.
On average, TNC drivers wait between 10 and 30 minutes in the staging lot before being
assigned a ride (Free, Porta, Vasquez, 2019). Airport operators have stated that TNC drivers
often have their cars idling the entire time they are waiting to either heat or cool their vehicle
(Free, 2019). This means that TNC vehicles contribute to CO2 emissions at the airports they
Eibert, Girardeau, and Phillips | 14serve. Increasing awareness and enforcement of no idling regulations will reduce CO2 emissions
from TNC drivers and improve air quality.
Restructuring the pricing scheme to allow for curbside drop-off and pick-up at an
increased price allows airline passengers to opt for a shorter journey but enables airports to
control TNC-based traffic by encouraging passengers to opt for the non-curbside option. This
change would address potential passenger complaints after relocating drop-off and pick-up
locations to a non-curbside site, by offering TNC passengers a choice of access points. It could
also provide a slight increase in revenue for the airports if the price differential is sufficient
enough to cause behavior change, without significantly impacting traffic.
Combining the drop-off and pick-up locations will likely involve minor logistical costs,
construction costs, and future operational costs for airports. To cover some of these costs, it is
recommended that airports consider charging higher per-trip fees to TNC operators when
establishing an operational agreement or re-negotiating an existing operational agreement.
4. Safety Risk Assessment
Safety is a vital consideration for all projects, especially those based at airports. As part
of the preparation of this report, the team explored potential hazards to both TNC operators and
users in implementing the proposed recommendations and possible methods for risk mitigation.
As indicated in Figure 5, hazard ratings vary from “Extremely Improbable” to “Frequent” in
likelihood and “Minor” to “Catastrophic” in severity. As indicated in FAA AC 150/5200-37,
Introduction to Safety Management Systems for Airport Operators, a high level of risk is
considered unacceptable and cannot be implemented until it is reduced to a medium or low level
of risk. A medium level of risk is considered acceptable, but it achieves the minimum safety
objective and requires continuous tracking and management. Therefore, achieving a low level of
Eibert, Girardeau, and Phillips | 15risk was the target objective in developing the final recommendations and as such, the Cost-
Benefit Analysis (CBA) will explore the costs of achieving this level of hazard mitigation.
Table 2 identifies the hazards, their likelihood of occurrence, the severity of their
impact, and ways to mitigate the risk. This table was developed using the steps taken in
formulating a Safety Management System (SMS) and included: (1) describing the system, (2)
identifying hazards, (3) analyzing the risk in terms of likelihood and severity, (4) assessing the
risk, and (5) controlling the risk.
Figure 5: Hazard rating matrix
Severity
No Safety
Minor Major Hazardous Catastrophic
Effect
Extremely
Improbable
Extremely Remote
Likelihood
Remote
Probable
Frequent
Eibert, Girardeau, and Phillips | 16Table 2: Safety risk assessment including mitigation strategies
Hazards Likelihood Severity Controlling the Risk
Visible Striping on Crosswalk, Lighting in
Roadway Crashes -
Remote Minor Crosswalks, Rapid Reflective Flashing
Minor, No Injuries
Beacons, Speed Limit Signage
Improved Lighting in Garage, Mirrors Around
Garage Crashes -
Remote Minor Sharp Turns, Designated Waiting Area w/
Minor, No Injuries
Curb, Speed Limit Signage
Improved Lighting in Garage, Mirrors Around
Garage Crashes - Extremely
Major Sharp Turns, Designated Waiting Area w/
Minor, w/ Injuries Remote
Curb, Speed Limit Signage
Weather Exposure - Extremely
Major Indoor Waiting Area
Cold Remote
Weather Exposure - Extremely
Major Deicing and Snow Removal Strategies
Ice Remote
Improved Lighting, Police/Staff Presence,
Parking Garage Extremely
Major Crime Prevention Through Environmental
Safety - Robbery Remote
Design (CPTED), Emergency Call Boxes
Getting Lost Probable Minor Wayfinding Campaign
Greater Travel Handrails, High-traction Surfaces, Elevators
Frequent Minor
Distance and Escalators
Luggage Cart Collector in Parking Garage,
Luggage Transport Probable Minor
Staff Member Collecting Carts
Improved Lighting, Police/Staff Presence,
Parking Garage Extremely
Hazardous Crime Prevention Through Environmental
Safety - Assault Remote
Design (CPTED), Emergency Call Boxes
Visible Striping on Crosswalk, Lighting in
Roadway Crashes -
Remote Major Crosswalks, Rapid Reflective Flashing
Minor, w/ Injuries
Beacons, Speed Limit Signage
Roadway Crashes - Visible Striping on Crosswalk, Lighting in
Extremely
Major, w/ Severe Catastrophic Crosswalks, Rapid Reflective Flashing
Improbable
Injuries or Death Beacons, Speed Limit Signage
Garage Crashes - Improved Lighting in Garage, Mirrors Around
Extremely
Major, w/ Severe Catastrophic Sharp Turns, Designated Waiting Area w/
Improbable
Injuries or Death Curb, Speed Limit Signage
Bollards to Protect Waiting Area, Enhanced
Extremely
Terrorism Catastrophic Security Presence - Cameras and Staff, "See
Improbable
Something, Say Something" Signage
Low Risk Medium Risk High Risk
Eibert, Girardeau, and Phillips | 175. Description of Technical Aspects
5.1 Driver Decision Methodology
Figure 6 describes a potential system for TNC driver operations at an airport. After
dropping off a passenger at the TNC airport operations facility, the driver can choose to leave the
airport without a passenger or attempt to be re-matched with a new passenger.
Figure 6: TNC driver decision process
Eibert, Girardeau, and Phillips | 18As seen in Figure 6, the system attempts to match the driver within 30-60 seconds. If the
system does not find a match, the driver can choose to leave the airport or proceed to the staging
lot and join the virtual queue to be matched with a passenger. The driver does not enter the
virtual queue until arriving at the holding lot. Once the driver reaches a designated position in the
queue as chosen by the airport, they are instructed to travel to the TNC pick-up, drop-off, and
pre-dispatch staging area. The queue position at which the driver is instructed to travel to the
TNC facility can be altered based on the travel time between the holding lot and the facility, or at
the airport’s discretion. Once in the pick-up location, the driver waits to be matched with a
passenger. Once they are matched, the driver picks up their passenger and departs the airport
with the passenger(s). The pick-up location could be staged several ways. For example, it could
have waiting parking spots and an area where drivers pull up to pick-up passengers once they are
matched. It could also have marked parking spots that the app assigns to drivers and the app
would then notify passengers at which parking spot their driver is located.
5.2 Geofence Requirements
The system requires a geofence to restrict drivers to the holding lot when they are in the
queue. Geofences utilize a Global Positioning System (GPS) to restrict the use of applications
when in a certain geographical area. In the case of TNCs, many airports have already
implemented geofences to restrict TNC drivers to waiting in holding lots instead of contributing
to congestion by driving around on airport roadways. The system of operations proposed above
would require slight alterations to existing geofences to allow drivers in the front of the virtual
queue to maintain their position in the queue when traveling to the pre-dispatching staging lot.
Pre-dispatching reduces the time that passengers and drivers spend actively waiting for a ride and
it also serves to reserve high-value, terminal-adjacent property for passenger use.
Eibert, Girardeau, and Phillips | 196. Description of Interactions with Airport Operators and Industry
Experts
In February 2019, the research team contacted Peter Mandle at InterVISTAS as he was
one of the authors of the 2017 report, Transportation Network Companies: Challenges and
Opportunities for Airport Operators. Mr. Mandle referred the team to Craig Leiner, an Associate
Director at Ricondo and Associates, Inc., who is the lead investigator on a follow-up report
examining best practices for airport operators to handle interactions with TNCs titled
Transportation Network Companies (TNCs): Impacts on Airport Revenues and Operations. The
team spoke to Mr. Leiner over the phone regarding his ongoing research. He provided insight on
a variety of subject areas the team was considering and provided advance access to a database
being developed for airport operators as part of the project that will be publicly accessible at the
conclusion of the project for the exclusive purpose of informing our recommendations to airport
operators. As a result of this interaction, the team decided to examine how airports can reduce
congestion from TNC operations at large airports because Mr. Leiner stated that large airports
have the most severe congestion issues and have been considering different alternatives to handle
those issues.
The team then reached out to airport operators at LAX, SFO, and the Port Authority of
NY & NJ (PANYNJ), which operates Newark Liberty International Airport (EWR), John F.
Kennedy International Airport (JFK), and LaGuardia International Airport (LGA). The team
spoke with Shirlene Sue, Landside Management and Airport Permit Services at LAX, who
provided information about parking revenue at LAX and the considerations that go into siting
TNC driver pick-up, drop-off, and staging. The team also spoke with Don Free, Peter Carbonaro,
Julian Porta, and Thor Vasquez from the Aviation Department at PANYNJ about the
considerations for operating TNCs at JFK, LGA, and EWR. From this conversation, the team
Eibert, Girardeau, and Phillips | 20learned that TNC pick-up and staging is combined in a parking garage at Terminal B at LGA,
which is popular with customers and drivers. However, Mr. Free emphasized that staging and
pick-up should not be located in the same location because it contributes to vehicle and
pedestrian congestion of in the central terminal area. Mr. Vasquez also discussed the staffing
needs associated with the operation of TNCs and parking revenue at LGA. Furthermore, the team
spoke with Eva Cheong, Airport Director at SFO, about the airport’s TNC operations. Director
Cheong discussed the evolution of TNC operations at SFO and their impact on congestion. After
initially offering curbside pick-up, the airport switched to a choice between garage pick-up and
curbside pick-up at an increased price. However, airport operators found there to be little price
elasticity among frequent flyers, with the choice of pick-up locations providing only minimal
relief for the congestion problem. Director Cheong discussed the airports exploration of potential
solutions, along with the effects of TNCs on ground transportation mode share. Finally, she
described staffing needs relating to TNC oversight by SFO. The information gained from these
discussions helped to inform the team’s Cost-Benefit Analysis and understanding of the
projected impacts of the recommendations.
7. Projected Impacts
The team’s recommendations are intended to improve vehicular traffic flow at the
terminal, reduce CO2 emissions, improve the passenger experience, and recover some of the
costs of providing services to TNCs operating at the airport.
Eibert, Girardeau, and Phillips | 217.1 Cost-Benefit Analysis
The costs and benefits of combining pick-up, drop-off, and pre-dispatch staging into a
parking garage close to the airport are calculated below. The costs and benefits calculated here
represent those of improving an existing parking garage to serve as a TNC facility rather than the
costs of constructing a ground transportation facility that can serve the needs of TNCs and other
types of ground transportation. As TNC mode share grows, airports may consider this kind of
facility in the future. The benefits to passengers and reduced CO2 emissions significantly
outweigh the costs of improving the parking garage.
The costs include one-time planning, engineering, and construction costs per terminal,
and recurring maintenance, security, and operation costs to improve a garage to function as a
TNC waiting area. The costs incorporate recommendations from the Safety Risk Assessment to
mitigate risks. The team did not monetize the cost of forgone parking revenue due to the variety
of parking rates and availability at different airports. Though some parking revenue may be lost
due to the loss of these spaces, many airports are already facing decreasing parking transactions
(Ricondo & Associates, 2019). As parking transactions continue to decline due to the increasing
mode share of TNCs, airports should consider repurposing any underutilized garage space near
terminals to locate TNC pick-up and drop-off. By raising per trip fees on TNC trips, airports can
recover some of the revenue lost to re-allocating parking garage space to TNC operations.
The costs of developing the project include the cost of the project team, project advisor,
and professionals that gave their time to help the project team. The cost of labor was calculated
using wage statistics from the Bureau of Labor Statistics (BLS) and a 1.47 multiplier was applied
to account for benefits and overhead (U.S. Bureau of Labor Statistics, 2018). These costs totaled
to approximately $6,000 (Table 3).
Eibert, Girardeau, and Phillips | 22Table 3: Costs of developing the project
Item Rate ($/hr.) Quantity (hr.) Total ($)
Professionals* $54.93 8 $439.47
Graduate Students (Project Team)* $21.77 210 $4,571.85
Professor (Advisor)* $53.71 20 $1,074.23
*Wages from BLS multiplied by 1.47 for benefits and overhead Total: $6,085.55
The research team estimated a high and low range for the costs of planning, engineering,
and construction (Table 4). The cost of labor was calculated using wage statistics from the BLS
along with a 1.47 multiplier to account for benefits and overhead (U.S. Bureau of Labor
Statistics, 2018). The costs of construction materials were estimated using the cost estimate
document “Average Bid Prices for Awarded Contracts State Aid Projects Not Included 1/1/2017
to 12/31/2017” from the Minnesota Department of Transportation (MNDOT). The sources for
other costs are shown in Table 4. The cost ranges between $100,000 and $460,000 for altering
the garage to serve TNCs and to provide ongoing staff support for security, operations,
maintenance, and customer support (Table 4). These costs would be incurred by the airport.
Eibert, Girardeau, and Phillips | 23Table 4: Costs of combining pick-up, drop-off, and pre-dispatch staging
Low Scenario High Scenario
Quantity Quantity
Item Cost Total ($) Total ($)
(hr.) (hr.)
Planner* $50.52 40 $2,021 250 $12,631
Costs
Staff
Engineer* $59.90 120 $7,188 750 $44,927
Quantity Quantity
Item Cost Total ($) Total ($)
(per item) (per item)
Wayfinding Signage** $115 10 $1,150 20 $2,300
Speed Limit Signage** $115 0 $0 5 $575
"See Something, Say Something"
$115 0 $0 2 $230
Signs**
No Idling Signage** $115 2 $230 4 $460
Sign Installation** $112 12 $1,344 29 $3,248
Parking Garage Lights1 $1,157 20 $23,140 50 $57,850
Construction Costs
Install Lighting Unit** $527 20 $10,540 50 $26,350
Emergency Call Box System2 $600 0 $0 2 $1,200
CCTV Cameras** $8,381 0 $0 3 $25,143
CCTV Installation** $1,668 0 $0 3 $5,003
Fire Extinguisher3 $500 2 $1,000 3 $1,500
Bollards** $1,308 10 $13,075 20 $26,150
High Visibility Crosswalk4 $2,500 1 $2,500 2 $5,000
Luggage Cart Area5 $500 1 $500 1 $500
Bench** $1,961 3 $5,883 6 $11,766
Garbage Can6 $350 1 $350 4 $1,400
Recycling Can6 $350 1 $350 4 $1,400
Eibert, Girardeau, and Phillips | 24Low Scenario High Scenario
Quantity Quantity
Item Cost Total ($/yr.) Total ($/yr.)
(hr./yr.) (hr./yr.)
Security Guard* $19.05 1095 $20,861 2,190 $41,722
Janitor* $17.67 365 $6,449 730 $12,899
Recurring Costs
Maintenance - General* $26.62 156 $4,153 260 $6,922
Maintenance - Snow/Ice* $26.62 0 $0 20 $532
Operations Manager* $87.24 0 $0 50 $4,362
Customer Service Representative* $23.24 0 $0 7,300 $169,657
One-Time One-Time
$69,271 $227,632
Total: Total:
Notes:
*Wages from BLS multiplied by 1.47 for benefits and Recurring Recurring
$31,463 $236,094
overhead (U.S. BLS, 2018) Total: Total:
**Cost estimate from MNDOT (Minnesota DOT, 2018)
GRAND GRAND
$100,734 $463,726
TOTAL: TOTAL:
Sources:
1 (U.S. Department of Energy, 2013)
2 (Telcom Data, 2019) 3 (Home Advisor, 2019)
4 (Federal Highway Administration, 2019)
5 (Carriage Trade Service Co, Inc., 2018)
6 (Global Industrial, 2019)
The recommendations will not only benefit TNC drivers and passengers, but also airport
passengers that do not take TNCs. These benefits include a reduction in CO2 emissions due to
stricter enforcement of no idling laws in the parking garage and saving non-TNC passengers’
time by reducing curbside congestion. Re-match at the parking garage and pre-dispatch staging
will improve driver productivity and lessen the time spent waiting for a passenger. These
benefits accrue to the airport customers, TNC drivers, and society-at-large for the reduction in
CO2 emissions.
Eibert, Girardeau, and Phillips | 25The research team did not calculate the monetary benefits to airports of raising the per-
trip fee for TNCs or using a price differential for garage and curbside pick-up and drop-off due
to variation in airport permits and pricing schemes. However, airports can recoup some of their
costs by using these methods.
The research team calculated four benefit scenarios as shown in Table 5. The benefits of
reduced CO2 emissions from reduced idling and driving to and from staging lots are something
that airports can incorporate into their goals for improving sustainability and reducing emissions.
A high and low range for the monetary benefits of reducing CO2 emissions by reducing idling
and driving to and from staging lots was estimated using the following assumptions (Table 5):
● The high and low range are determined by calculating the 1st and 3rd quartile for the
passenger volume for all large-hub airports. This means that 25% of large-hub airports
would see greater benefits, 25% would see lesser benefits, and 50% of airports would see
benefits within the range calculated.
● The TNC passenger volume is assumed to be 8% of this passenger volume because
research at both LAX and SFO found that 8% of passengers were using TNCs to access
the airport (Hermawan & Regan, 2018).
● The amount of CO2 saved by not idling is assumed to be one pound of CO2 per ten
minutes for a typical passenger vehicle (Environmental Defense Fund, 2009).
● The social cost of carbon for 2020 with a 3% discount rate is used. This is $42 per metric
ton of CO2 (U.S. Environmental Protection Agency, 2016).
Eibert, Girardeau, and Phillips | 26Table 5: Description of Benefit Scenarios
Scenario Description
1 Low time estimate, low passenger volume estimate
2 High time estimate, low passenger volume estimate
3 Low time estimate, high passenger volume estimate
4 High time estimate, high passenger volume estimate
A high and low range for saving non-TNC passenger time was calculated using the
average wage for a person employed in business and finance to account for the relatively higher
wages of individuals that fly, especially frequent fliers (U.S. Bureau of Labor Statistics, 2018). It
was assumed that the reduced congestion would save 0.25 minutes per passenger not using a
TNC (Table 6).
A high and low range was also calculated for TNC driver time by averaging the estimates
for hourly wages from surveys of Uber and Lyft drivers (Ridester, 2018). It was assumed that
about 25% of drivers would get a re-match immediately and that drivers that got re-matched
would save five to ten minutes by not having to drive to and from the staging lot and an
additional five to twenty minutes by not waiting for a new passenger.
Eibert, Girardeau, and Phillips | 27Table 6: Benefits of Combined Pick0up, Drop-off, and Pre-dispatch Staging
Scenario
1 2 3 4
Rate of CO2 production from idling 1lb./10 min.
Reduced Idling Time (mins) 10 30 10 30
TNC Trips 958,284 958,284 1,882,265 1,882,265
Reduced Idling
CO2 Saved (lbs.) 958,284 2,874,852 1,882,265 5,646,796
CO2 Saved (metric tons) 435 1,304 854 2,561
Social Cost of Carbon $42/metric ton
Subtotal: $18,256 $54,769 $35,859 $107,578
Rate of CO2 production from driving 1.5lb/5 min.
Reduced Driving Time per Trip (mins) 15 30 15 30
TNC Trips to Staging Lot Avoided 239,571 239,571 470,566 470,566
Trips Avoided
CO2 Saved (lbs.) 1,078,070 2,156,139 2,117,549 4,235,097
CO2 Saved (metric tons) 489 978 961 1,921
Social Cost of Carbon $42/metric ton
Subtotal: $20,538 $41,077 $40,342 $80,683
Time Saved per Trip (mins) 0.15 0.25 0.15 0.25
Passenger Time
Wage of Average Businessperson ($/hr.) $32.55 $32.55 $32.55 $32.55
Non-TNC
Number of Passengers 23,957,102 23,957,102 47,056,636 47,056,636
Subtotal: $1,949,509 $3,249,182 $3,829,234 $6,382,056
Time Saved per Trip (mins) 5 7 5 7
Driver Time
Wage of Average TNC Driver ($/hr.) $16.78 $16.78 $16.78 $16.78
Number of Passengers 958,284 958,284 1,882,265 1,882,265
Subtotal: $1,340,001 $1,876,001 $2,632,034 $3,684,848
GRAND TOTAL: $3,328,305 $5,221,029 $6,537,469 $10,255,165
Eibert, Girardeau, and Phillips | 28The benefits for Scenario 1, which assumes a low amount of time saved and a low
passenger volume, are $3.3 million. This may represent the benefits experienced by large hub
airports with lower passenger volumes. The middle range of benefits, represented by Scenarios 2
and 3, were $5.2 million and $6.5 million, respectively. The benefit for Scenario 4, which
assumes a high amount of time saved and a high passenger volume, are $10.3 million. This may
represent the benefits experienced by large hub airports with higher passenger volumes. The
benefit of saved time accrues to non-TNC passengers and TNC drivers. It may also accrue to
TNC passengers who may not have to wait for their driver to arrive if pre-dispatch staging works
as intended, however this was not monetized. The benefit of reduced air pollution from the
airport accrues most acutely to those employed at the airport and individuals who live near the
airport. However, these benefits also accrue to society at-large due to the reduction in greenhouse
gases. The airport may recover some of their costs of providing services to TNCs by raising per
trip fees when establishing or renegotiating a contract with TNCs.
The costs and benefits were projected for 10 years using a 3%, 5%, and 7% discount rate.
The discount rate accounts for the opportunity cost of spending money instead of investing it
where it would earn a return. It accounts for the tendency of people to discount future benefits in
favor of more immediate gain. When a discount rate is used, it shows the present value of the
costs and benefits expected to accrue over the projected time period. These costs and benefits are
also annualized at each discount rate to show the present value of the cost and benefits that will
accrue each year. In all cases the benefits outweigh the costs (Table 7).
Eibert, Girardeau, and Phillips | 29Table 7: The costs and benefits projected for 10 years using a 3%, 5%, and 7% discount rate
Costs Benefits Total Benefits
Total (3% DR) $1,159,729 $24,908,080 $23,748,350
Total (5% DR) $1,054,048 $21,388,364 $20,334,317
Total (7% DR) $963,031 $18,432,088 $17,469,057
Annualized (3% DR) $115,973 $2,490,808 $2,374,835
Annualized (5% DR) $105,405 $2,138,836 $2,033,432
Annualized (7% DR) $96,303 $1,843,209 $1,746,906
7.2 Other Considerations
To improve the passenger experience, TNC pick-up and drop-off locations should be
within comfortable walking distance of the terminal. These locations should be prioritized
because they can greatly inform a passenger’s first and last impression of the airport. At LGA,
which is managed by the PANYNJ, passengers previously had to take a bus to get to the TNC
pick-up location. After the pick-up location was moved to a parking garage within walking
distance from the terminal, staff saw a 15% increase in TNC rides due to the improved
convenience. From the customer and driver perspective, the relocation has been highly
successful.
There are some costs associated with locating TNCs in parking garages, such as lower
parking revenue due to space allocation to TNCs and traffic management challenges because the
garage being used was not designed to accommodate the traffic patterns of TNC operations. To
handle these challenges, the PANYNJ use operations staff to direct traffic at LGA. The landside
planning staff recommended that future garages have a separate TNC entrance if they will be
used for TNC pick-up and staging.
Eibert, Girardeau, and Phillips | 30You can also read