Adults' Media Use and Attitudes report 2022 - Welsh overview available - Ofcom
←
→
Page content transcription
If your browser does not render page correctly, please read the page content below

Adults’ Media Use
                           and Attitudes report
                                                    2022

Welsh overview available            Published 30 March 2022
Overview
This report examines adults’ media literacy in the UK. Ofcom’s definition of media literacy is ‘the
ability to use, understand and create media and communications in a variety of contexts’. The report
is a reference document for industry, stakeholders and the general public.

The Communications Act 2003 places a responsibility on Ofcom to promote, and to carry out
research into, media literacy. This report supports our work in this area and our wider Making Sense
of Media programme.

Key findings:
Digital exclusion

•   The proportion of those without internet access at home remained stable in 2021; 6% of
    households have no internet access.

•   Young adults were often helping others do something online; 86% of internet users aged 16-24
    had offered assistance and 46% of those 16-24-year-old ‘helpers’ did this weekly. Half of those
    who did not use the internet at home were getting some proxy use via other people.

•   A growing number (21%) of internet users were accessing the internet exclusively via a
    smartphone. This was more likely among those aged 25-34, in C2 or DE households, and the
    most financially vulnerable, and was more likely among women than men.

•   But there continue to be limitations associated with complete reliance on smartphones to go
    online. A majority of smartphone users agreed that activities such as completing forms and
    working on documents, or comparing products or services online, were more difficult on a
    smartphone than on a laptop or desktop.

•   But smartphone users have a clear preference for doing some activities on their phone rather
    than on a laptop or desktop, including social media, video calls, online banking and accessing
    news. A laptop or desktop was preferred for job applications or watching TV programmes or
    films.

Online knowledge and understanding

•   Almost eight in ten internet users (79%) said they were confident in using the internet,
    although a smaller proportion (59%) were confident in managing access to their personal data.

•   There was often a gap between people’s confidence in being able to recognise advertising,
    identify a scam message or judge the veracity of online content, and their ability to do this
    when shown examples.

                                                     1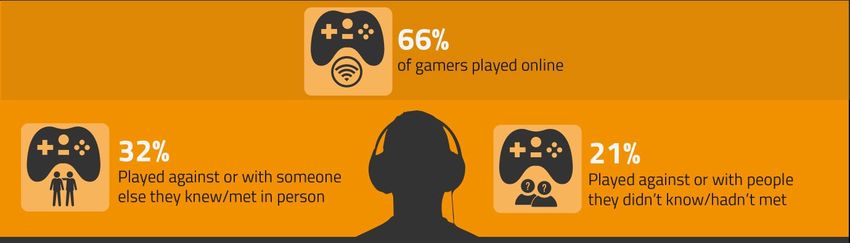
•   A third of internet users were unaware of the potential for inaccurate or biased information
    online; 6% of internet users believed that all the information they find online is truthful and 30%
    of internet users don’t know – or don’t think about – whether the information they find is
    truthful or not.

•   Just over a third of internet users did not make any appropriate checks before registering their
    personal details online. 16-34 year olds were more likely not to have made any such checks.

Attitudes towards being online

•   A majority (58%) of internet users agreed that the benefits of being online outweigh the risks.
    A minority (14%) disagreed and 28% were unsure.

•   Internet users were more likely to agree (46%) than disagree (27%) that they worry about
    whether something they say online could cause them problems in the future. Younger internet
    users were more likely to agree than average.

•   There was growing agreement on the need for online protection. The proportion of internet
    users that thought those online should be protected from inappropriate or offensive content
    rose from 61% in 2020 to 65% in 2021.

•   A majority of people (55%) now disagree with the idea that people should be able to say
    whatever they want online, even if hurtful or controversial, up from 47% in 2020.

•   Views were mixed on online anonymity. Since last year, there has been a slight shift towards
    the view that people should not be able to hide their identity online; the proportion who
    thought this rose from 34% to 44%.

Online behaviours

•   Internet users were using more than six different online communications platforms on
    average. The widest users of online communication platforms were younger adults, and in
    particular 16-24s, who were using an average of 8.7 online communication platforms compared
    to 3.0 for internet users aged 65+.

•   Half of internet users aged 16-24 had multiple profiles on the same online communication
    platform. The most common site or app for this was Instagram, and the most common reasons
    were having a separate account dedicated to a hobby or business or having one account for
    close friends and another for a wider circle of contacts. Use of multiple profiles decreased with
    age.

•   Half of internet users aged 16-34 were uploading their own videos to video-sharing platforms
    and 28% were live-streaming their own content. These activities were less common among
    older internet users.

•   88% of those aged 16-24 were playing games on an electronic device and the majority of 16-24
    gamers were playing online with or against other people, including 29% who were playing with
    people they didn’t know and hadn’t met in person.

                                                      2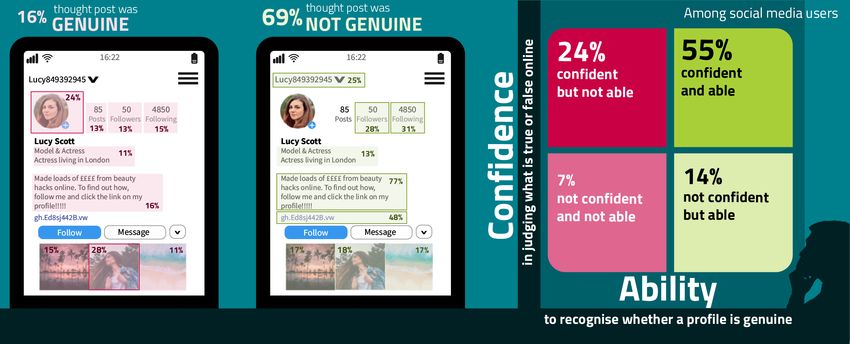
Drawing largely on our quantitative Adults’ Media Literacy Tracker surveys, this report provides
evidence on media use, attitudes and understanding among UK adults aged 16 and over. More
detail, including additional demographic analysis and responses to the full set of survey questions,
can be found in the accompanying interactive report and data tables.

To support us in providing an over-arching narrative on the key themes of adults’ media experience
in 2021, this report also draws on our Adults’ Media Lives research which is a qualitative,
longitudinal, ethnographic project which has been running since 2005. The research has followed 20
participants over time – with 12 of them having been in the study for at least 14 years – interviewing
them at home to understand their relationship with digital media. This year, 60-minute interviews
were conducted online via Zoom.

In 2021, we adapted and expanded Ofcom’s media literacy research programme to refresh and
future-proof our suite of research vehicles in a constantly evolving digital media landscape. This has
involved splitting our Adults’ Media Literacy tracker into three surveys. 1

This year, we also conducted an additional CATI (telephone) omnibus survey in November-December
2021, replicating a similar study carried out in February-March 2021, aiming to provide detailed
evidence on use of the internet at home or elsewhere, and to ask further questions of those without
home internet access to understand their reasons for, and experience of, being offline.

Where there has been a substantial shift in methodology (i.e., for questions carried on the Online
Behaviours & Attitudes and Online Knowledge & Understanding surveys), direct comparisons
between the current and previous waves are not possible. However, wherever there were questions
in the core study in both 2020 and 2021, or in both 2021 waves of the CATI omnibus, without any
significant change of wording, we can draw comparisons where it is relevant to do so.

1
 The postal-based methodology was used a result of the ongoing Covid-19 pandemic in 2020 and 2021, and
we expect to return the core survey to a face-to-face methodology in the future.

                                                       3
4
5
6

Summary of
                                                                  key findings

Digital exclusion2
The proportion of households offline has remained stable in 2021
As in March 2021, 6% of households did not have access to the internet at home in December 2021.
We estimate this equates to around 1.7 million households (+/- 200,000). 3

A further 2% of adults aged 18+ had access to the internet at home but did not use it.

Following an initial uplift in the proportion of homes with internet access during 2020, the first year
of the Covid-19 pandemic, this suggests that there remains a group more resistant to going online
who saw little added motivation to get connected in 2021. Indeed, a majority (69%) of those without
home internet access said that nothing would prompt them to go online in the next 12 months. The
most common reason given was that they were not interested or felt no need to go online (47%).

The groups more likely not to have internet access at home continued to be those aged 75+ (26%),
those in DE households (14%) and those who are most financially vulnerable (10%). 4

Among all working-age (18-64) people in DE households, the incidence of not having internet access
at home was 5%. This increased to 30% among those aged 65+ in DE households. However, those of
working age in DE households were still more likely to not have internet access at home than those
of working age in non-DE households (1%).

2
  This topic is covered in more detail in the accompanying Digital Exclusion Review which provides an overview
of Ofcom’s historical research on digital exclusion and the more recent impacts of the Covid-19 pandemic,
both positive and negative.
3
  All generated household estimates are reported to the nearest 100,000 and use the latest ONS population
estimates. Note that this household estimate was generated from a CATI survey aimed at questioning adults
on an individual basis and is weighted to the profile of UK adults not UK households. However, this specific
question is asked at the level of the household.
4
  Financial vulnerability is a measure that has been devised by Ofcom to better understand the impact of
financial vulnerability on ownership and use of communications services. The analysis creates three distinct
household types by combining household income and the size of the household (including number of
children).

                                                         7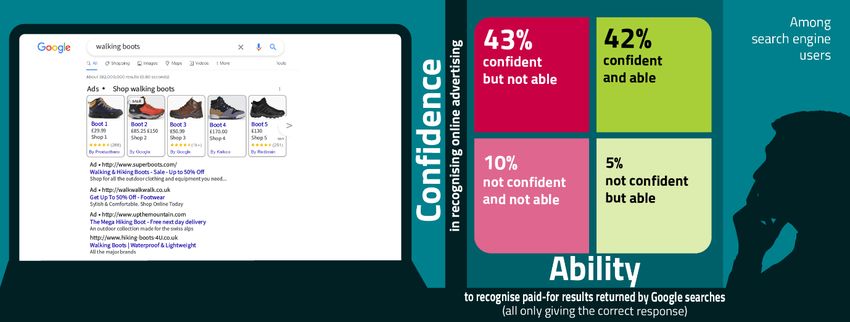
A large majority (83%) of those without home internet access were also not accessing it anywhere
else. In total, 7% of adults aged 18+ did not use the internet at home or elsewhere.

Proxy use remained an important gateway to completing online activities for half of those
who did not use the internet at home
Half (49%) of those who did not use the internet at home had asked someone else to do something
for them online in the past year. Among these proxy users, the most common request was to buy
something (63%). Help was also sought with a variety of important Government, civic or health
activities: 18% asked someone to access public services provided by the Government or council on
their behalf, 15% to access health services online, and 9% to apply for or claim some type of benefit.

Many internet users may embrace the increasing number of activities and processes that can be
completed online. However, in another year in which face-to-face interactions and facilities have
been restricted, people who rely on others to complete online activities for them, and especially
those who have no-one to help them, remain at greater risk of digital exclusion.

Young adults were often providing help with online tasks
Among those who use the internet, a majority (63%) said that they had helped someone else to do
something online in the past 12 months. Young adults were the most likely to have offered help:
86% of internet users aged 16-24 did so; this then decreased with age. Those in ABC1 households
were more likely than C2DEs to have helped someone online (70% vs 56%).

Of those who had provided help, 70% were doing so at least monthly and 37% at least weekly.
Again, for younger helpers this was higher; 81% of 16-24s who had helped someone online were
doing so monthly and 46% weekly.

                                                     8
Narrow or limited internet users
Digital exclusion goes beyond access to the internet
As well as looking at those who are at risk of digital exclusion due to a lack of access to the internet,
we are interested in exploring the differences in online experience among people who do have
access, and the limitations that they can experience, based on levels of use, understanding and
access to devices.

One way of looking at this is by using breadth of use analysis. This defines three categories of
internet user, based on the range of activities they complete online. ‘Narrow’ internet users are
defined as those who had ever undertaken between one and four of the 13 online activities we
asked about. This accounted for 29% of internet users. ‘Medium’ internet users had ever undertaken
5-8 activities, and this accounted for 40% of internet users. Finally, ‘broad’ internet users had ever
undertaken 9-13 of the activities, and this accounted for 28% of internet users. 5

Narrow internet users were more likely than average to be aged 65+ and in DE households. In
contrast, broad internet users were more likely to be aged 25-44 and in ABC1 households.

Overall, narrow internet users generally demonstrated lower-than-average confidence online and
were less critically aware, while broad internet users were better equipped to navigate the online
environment confidently and knowledgably. Further commentary on the differences we observed
between these types of internet user can be found throughout this report.

5
  The 13 activities we ask about are: online banking or paying bills, paying for council tax or another local
council service, looking for public services information on government sites, finding information for work/
business/ school/ college/ university, looking or applying for jobs, finding information for leisure time,
completing government processes, signing a petition or using a campaigning website, using streamed audio
services, listening to live, catch-up or on-demand radio through a website or app, watching TV programmes/
films/ content, watching or posting livestream videos. This is not an exhaustive list of online activities, but this
selection was found to be the most discriminating in determining breadth of use from an initial longer list of
activities.

                                                             9
One in five internet users were accessing the internet exclusively via a smartphone
Another way in which we look at possible digital exclusion is via access to devices. A range of devices
can now be used to go online, but an increasing proportion (now 21%) of internet users access the
internet exclusively via a smartphone.
Questionnaire changes limit direct comparability, but when we adapt the devices asked about in
2020 to bring them in line with those asked about in 2021, 11% of internet users were smartphone-
only in 2020 and we can be confident that this significantly increased in 2021.
This was even higher for certain groups including those aged 25-34 (32%), in C2 (28%) or DE (31%)
households, and who were most financially vulnerable (31%). Women were also more likely than
men to be smartphone-only (24% vs 18%).
Those reliant on smartphones as their only device to access the internet may find it
difficult to use some online services
A majority of smartphone-only internet users did not feel disadvantaged by this, but for some,
accessing the internet exclusively via a smartphone was not necessarily by choice: 26% of
smartphone-only internet users said they felt disadvantaged by this. While smartphones allow users
to complete a broad spectrum of online activities, some of these are more difficult to complete on a
smartphone because of the smaller screen size, or limitations in functionality or data allowance.
A large majority (88%) of all smartphone users had completed a form or application on their mobile
phone and a quarter (26%) were doing so weekly. But 71% of all smartphone users agreed that
completing forms and working on documents was more difficult on a smartphone than on a laptop
or desktop. Smartphone-only internet users were less likely than average to agree, but nevertheless,
more than half (55%) agreed.
The association of greater difficulty in completing such activities on a smartphone has remained
consistent, with no change since 2020. But despite this, an increasing number of people are using
their smartphones to complete a form or application; the proportion who had ever done this rose
from 83% in 2020 to 88% in 2021.
Comparing products or services online was also generally seen to be more difficult on a smartphone
than on a laptop or desktop; 54% of all smartphone users agreed with this statement. Again,
smartphone-only internet users were less likely than average to agree, but were still more likely to
agree than disagree (37% vs 31%).
10Larger data packages and greater availability of free wi-fi in recent years may have reduced concerns
about reaching or exceeding mobile data limits. Nevertheless, a third (32%) of all smartphone users
said that when they go online on their smartphone to complete tasks, they do this as quickly as
possible to avoid using up too much data. A similar proportion (35%) of smartphone-only internet
users agreed. This tendency to rush could prevent people from completing tasks fully or properly, in
some cases limiting the effectiveness of the task.
Smartphone-only internet users were also more likely than all internet users to be narrow users.
Some of the limitations felt by narrow internet users also applied to smartphone-only users,
including lower confidence and critical understanding skills online.
Some online activities are better suited to certain devices
There were several online activities that smartphone users said they preferred to do on a
smartphone rather than on a laptop or desktop. In particular, younger adults aged 16-44 were more
likely than average, and women more likely than men, to prefer doing most of the activities we
asked about via a smartphone. But there were some activities that smartphone users preferred to
do on a laptop or desktop, and of the nine activities we asked about (seen in the graphic below),
70% of smartphone-only internet users said they preferred to do at least one of them on a laptop or
desktop.
11Trust and misinformation
‘Critical understanding’ is a core component of media literacy; it enables users to understand,
question, and manage their media environment. This is important if they are to get the benefits that
the internet and other media can offer while avoiding potential risks or harms.
This report looks at confidence, and the interaction it has with critical understanding. Confidence
does not just follow from good media literacy skills but intersects with it in a way which can either
bolster or undermine good critical understanding. Someone whose confidence is not matched by
ability in practice may be more likely to make mistakes which could lead to harm. Conversely,
someone who has good critical understanding skills but is not confident in them may not trust their
own good judgement, which could lead them to feel unsure or unsafe in an online environment.
Some internet users were unaware of the potential for inaccurate or biased information
online
The critical thinking skills needed to assess and evaluate information found online were lacking in a
third of internet users: 6% believed that all the information they find online was truthful and 30%
did not know or did not consider the potential truthfulness of online information at all.
Of those who did consider the truthfulness of online information, the vast majority (90%), sought to
check on the accuracy of the information. 6
In order to assess perceived accuracy and bias in more detail, we asked respondents who had used
search engines in the past year to choose, from a list of statements, the one which matched most
closely their opinion about the level of accuracy or bias of the information on the websites listed on
a search results page. Search engine users aged 16-44 tended to be less media-literate than average
in interpreting the accuracy of search results; 34% of 16-24-year-olds thought that if websites had
6
Checks included: if the same information appears on different websites, if the website address looks genuine,
the credibility of the information (author’s name or link to original publication), if the site looks professional,
whether the site is regularly updated, whether people they trust use the site, verify the information on a fact
checking website/ app like Full Fact.
12been listed by the search engine, they would contain accurate and unbiased information. Indeed,
savviness, or at least wariness, seemed to increase with age: search engine users aged 55+ were
more likely than average to give the media-literate response that some results will be accurate, and
some won’t be.
Although social media users were highly confident that they could judge the validity of
online content, most did not spot the valid indicators of a genuine social media post
Adults who use social media apps or sites were shown a genuine social media post (an official
Government travel checklist, shown below) and asked which of the features in a prompted list
suggested that the post was genuine. The most common features that users associated with a
genuine social media post were the blue tick and the information contained within the post.
The majority (63%) were able to identify correctly any of the features which demonstrated that the
scenario was genuine, including 47% nominating the blue tick next to the profile name, 30% the
profile name and links to other websites (21%). However, only a fifth (22%) pointed only to the valid
features, whereas over half (58%) pointed to invalid features such as the logo, number of likes,
professional design of the post and information contained within the post. 7
This would suggest that although many people can identify indicators which suggest that a post is
genuine, others find it difficult. Those who selected only invalid features (17%) were more likely to
be aged over 65 (23%).
Although seven in ten (69%) adult internet users said they were confident in judging whether online
content was true or false, most were actually unable to correctly evaluate the reasons that indicate
whether a social media post is genuine. Six in ten (61%) social media users who said they were
confident in judging whether online content is true or false lacked the skills to do so. 8 This was
higher among 55-64s (70%), men (65%) compared to women (58%), and those in ABC1 households
(65%) compared to C2DE households (57%).
7
The ‘information contained within the post’ response is classed as invalid, as people should not rely on this to
judge a post as genuine without other means of verification. However, even when removing this response
from the analysis, and to check the impact that this real example containing publicly-available information
might have had, a large proportion still chose invalid features that had no bearing on the accuracy of the post.
The proportion who were confident and not able dropped only slightly, to 56%.
8
This quadrant analysis of confidence and ability reports on findings from social media users through the
Online Knowledge and Understanding survey which was conducted with online panellists. Other reporting uses
a measure of confidence among internet users through the Core survey conducted through a mixed method
postal and online panel approach.
13Over four in ten (43%) social media users said they had seen something on social media apps or
sites 9 that they thought was a deliberately untrue or misleading news story in the past 12 months.
36% said they hadn’t and 21% were unsure.
Although the majority of social media users could recognise a fake social media profile, a
third could not, and there was some confusion among these people about what to look
for when judging veracity
Adults who use social media apps and websites were shown a mocked-up screengrab of a fake social
media profile and asked if they thought the profile was genuine.
Almost seven in ten (69%) stated that it was not genuine, with others saying that it was genuine
(16%), or they didn’t know (15%). Younger adults aged 16-24 (82%), those from ABC1 households
(72%) compared to C2DE households (62%), and broad users of the internet (75%), were more likely
than average to say that the profile was not genuine.
Social media users aged 25-44 (21%), men (20%) and narrow users (21%) were more likely to think
that the post was genuine.
Participants were then asked to say which features showed whether the profile was genuine or not.
Those who believed it was not genuine were more likely to consider text, web links, numbers of
followers/following and profile name. They pointed to the description under the biography (77%),
the link in the description (48%), the number of people they were following (31%), the number of
followers (28%) and the profile username (25%).
Those who felt that the profile was genuine were more likely to consider the imagery. They pointed
to features such as a posted picture (28%), the profile picture (24%), the description under the
biography (16%), the number following (15%) and the number of posts (13%).
More than half of adult social media users were both confident and able to identify a fake profile
(55%). However, a quarter felt confident that they were able to judge whether online content was
true or false, but in reality were unable to do so (24%). This was higher among men (28%) than
9
Including video sharing, live streaming, messaging and other social media apps or sites.
14women (21%). Younger adults aged 16-24 (62%) and broader internet users (66%) were more likely
than average to be both confident and able to identify a fake profile.
When judging suspicious messages, a minority claimed to be confident but did not take
appropriate actions
Three-quarters of adults who go online said they were confident in being able to judge an email/
text as suspicious and would take appropriate action if they received one.
Participants were shown an example of a suspicious message (see below) and asked what they
would do if they received it. Unprompted, three in ten (31%) said that they would delete it and 24%
said they would ignore it. When prompted with a list of options, the vast majority were able to deal
with it correctly. Ninety-five per cent selected a valid answer such as deleting it, blocking the
number, ignoring it, reporting it to their mobile provider (e.g., forwarding to 7726), checking the
website link to see if it was legitimate, or reporting it to the police. Eighty-nine per cent selected just
valid options, while 7% also selected invalid responses such as clicking the web link, replying to it,
following the instructions in the text or adding it to their contacts. Two per cent chose only invalid
options.
This illustrates that on the whole, internet users felt confident in judging whether an email or
text/online message was potentially suspicious and were able to take appropriate action.
However, about one in ten internet users, although feeling confident in their ability to judge an
email/text as suspicious, were in practice unable to do this. This was more likely to be the case
among 25-34-year-olds (13%), men (11%) compared to women (6%), and those in ABC1 households
(10%) compared to C2DE households (7%).
15Almost all the participants in the Adults’ Media Lives study were unhappy about the quantity of scam
emails, texts and/or calls they had received in the past year. Many of the scams were considered
indiscriminate and were relatively easy to spot, but others appeared to be more targeted (and
therefore credible). In particular, fake delivery messages purporting to be from DPD, Royal Mail, etc.
(at a time when most people were shopping online more) had caught out several participants.
Participants were not aware of any reliable reference sources for checking whether or not a message
might be a scam. Often, they claimed to rely on being alerted to specific scams via social media. In
some cases, they sought a second opinion from a friend or family member to help them make the
right choice about whether to respond to a message.
A lot of the time emails like that just go into your junk so, unless you’re going through your junk,
you don’t really get to see them… Texts are more of a problem… There are times when I would
show them to [boyfriend] because he’s probably a bit more clued up than me. It’s easy to be
caught out.
Female, 21, Nurse, Belfast
I hear bits and pieces from friends, you see it posted on social media. A friend of ours is a
policeman. If there’s anything he knows about, he’ll tell us. I constantly have texts from my mum…
checking whether [delivery notification] is legitimate… I’ve trained my in-laws and my mum to be
really suspicious, especially if they’re not expecting something.
Female, 44, Fundraising Manager, Cardiff
Knowledge and understanding of the online marketplace
There was a gap between confidence in being able to recognise advertising online and
actually being able to do so
When shown a sample image of a Google search for walking boots, a majority of search engine users
(63%) could identify paid-for results in the search results (i.e., the first four results that appeared on
the example image of a search listing with the word ‘Ad’). However, just 48% understood that this
was the only reason that these results appeared at the top of the list.
This was far smaller than the proportion of search engine users who said they were confident in
recognising advertising online (85%). Among the reasons given by those responding incorrectly, 27%
16of search engine users thought the results appeared at the top of the list because they were the
best/most relevant results, and 28% thought it was because they were the most popular results.
This gap in confidence and ability is clear when looking at the two in five (43%) search engine users
who were confident in their ability to recognise advertising online but who failed to correctly
identify advertising in search results; a similar proportion to those who were confident and also able
(42%). Those aged 16-24 (49%) or 35-44 (49%) and those in C2DE households (46%) were more likely
to claim confidence in recognising advertising but not be able to recognise paid-for results. Those
who were narrow internet users (16%) were more likely than broad internet users (4%) to be not
confident and not able to do this.
Smartphone-only internet users were less likely to be confident in recognising advertising online
compared to internet users who did not rely solely on a smartphone, and in practice they were also
less likely to be able to recognise advertising in search engine results.
Ratings and reviews were not the main considerations when considering what to purchase
Participants were shown a mocked-up image of a search result for a hotel room in Cornwall listing
three different properties. They were asked to look at the image and click or tap on anything that
they would consider in choosing which to book. These responses were then grouped into themes
depending on whether they related to ratings, reviews, price, promotional features or specifically to
the images or details of the hotel and/or the booking itself.
We were interested in looking at the relative importance of ratings and reviews when making
decisions about booking services online. We found that that these do not appear to feature highly in
people’s choices. Only a quarter (24%) of adult internet users would consider any rating or review
features when choosing which of the three options to book. This is comparable to those who would
consider any of the promotional offers (27%). However, the feature that internet users considered
most often were the hotel features or aesthetics.
The incidence of selecting any rating or review features does not vary by age, but it was higher
among women and those in ABC1 households.
17Personal data, privacy and security
A large majority of those who go online consider themselves confident internet users, but
a smaller proportion are confident in managing access to their personal data
The majority (79%) who go online considered themselves to be confident internet users. But this fell
to 59% who said they were confident in knowing how to manage who has access to their personal
data online.
Over half (58%) said they made appropriate checks before registering personal details online. These
checks included being familiar with the company or brand, checking whether the site had the
padlock symbol and whether there was a link to another reputable service such as PayPal. Just over
a third (35%) did not make any of the appropriate checks. They said that they would enter personal
details online if the site was listed by a search engine, if it was the only way to get the service or
product they wanted, or that they registered their details online whenever they were asked to.
Those more likely than average to make inappropriate checks were the younger age groups (16-24s
(43%), 25-34s (41%) and men (40%).
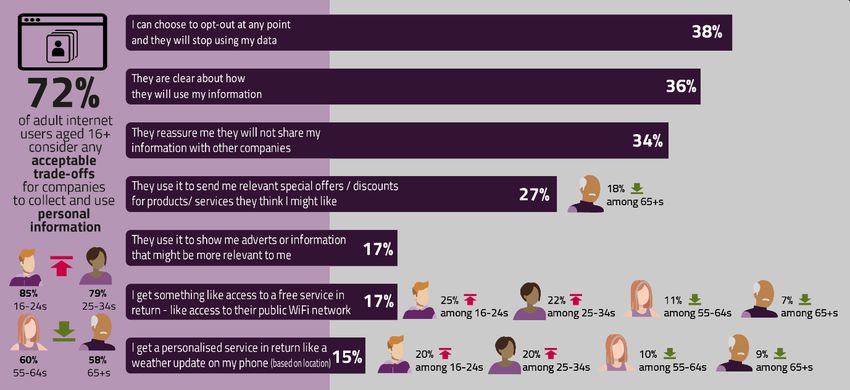
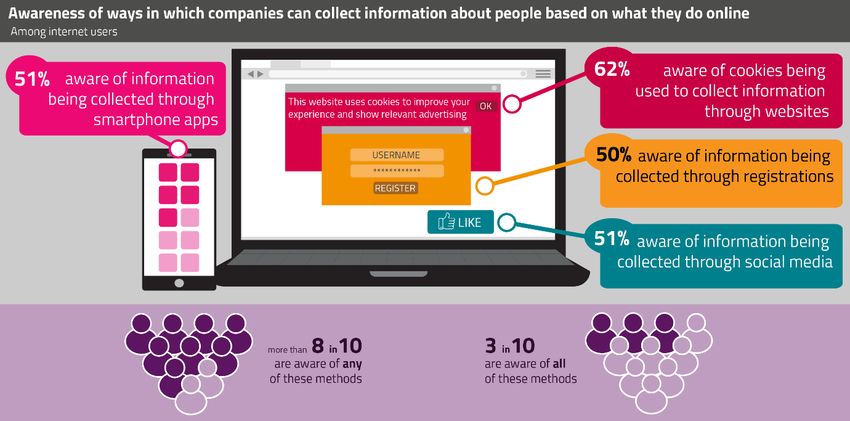
Most internet users were not aware of all the ways in which companies can collect their
personal data online, but were more willing to allow use of their data if they had
appropriate reassurance on its protection and use
Our survey prompted internet users with four ways in which online companies can collect their
personal information and asked which of these they were aware of. 10 In isolation, at least half of
internet users were aware of each of the individual methods, and 85% were aware of at least one of
10
The four ways were: (i) using ‘cookies’ to collect information about the websites people visit or what
products interest them; (ii) Using apps on smartphones to collect data on users’ locations or what products
and services interest them; (iii) Collecting information from social media accounts – i.e. about users’ interests,
‘likes’, location, preferences and so on; (iv) Asking customers to register with a website or app and to opt in/
opt out of receiving further information from them or their partners.
18them. However, only 28% were aware of all four, suggesting that a large proportion of internet users
are not fully equipped to manage their personal data online.
Although 21% of internet users said they were not happy for companies to collect and use their
personal information at all, for many there were some reassurances or trade-offs that made them
more willing to accept data collection.
The most common reasons internet users gave for being happy with data collection and use were
centred on receiving appropriate reassurance about its protection and use: 38% were happy for
companies to collect and use personal information if they could opt out at any point and the
company would stop using their data; 36% were happy if they were clear about how companies used
their information; and 34% were happy if they were reassured that companies would not share their
information with other companies.
A smaller group were more willing to allow their data to be collected and used in exchange for
perceived benefits such as receiving relevant special offers they might like (27%), access to a free
service (17%), showing adverts or information that may be relevant to them (17%) or getting a
personalised service (15%). Adults aged 16-34 were more likely to say the latter.
19The Adults’ Media Lives study showed that attitudes to privacy and personal data had not changed
significantly this year, and as in previous recent waves, most participants said they took some active
steps to protect their privacy (e.g. only giving away the bare minimum of personal data required to
register for a site or service, using multiple email addresses for different purposes), but being more
relaxed in situations where their personal data might be harvested for commercial purposes (e.g.
cookie notices, website terms and conditions).
I have got a Yahoo address, which I use for my junk stuff, and then I've got a Gmail address, which
I use for things that I genuinely need to... like banks., any shopping sites I use regularly. I keep that
address for that.
Female, 44, PA, Woking
Most were resigned to the idea that they would be targeted by contextual advertising whether they
liked it or not. Despite having misgivings about this, they generally viewed it as an unavoidable
trade-off if they chose to use social media platforms, etc.
If I search for a black jumper on Instagram, I'll always see black jumper advertisements and it does
annoy me a bit. I understand I've accepted the terms and conditions but... when it comes to social
media, it's just like you can't stop it. You either use the app or you don't.
Male, 17, Student, Manchester
Most internet users were aware why companies collect this information, although one in
ten did not know.
The majority of internet users (86%) were familiar with a range of reasons why companies collected
personal information 11. Half stated that this was done so that companies can target advertising,
information or other content at their users, four in ten felt it was done so that companies can build
up a profile of their users and what they like/ don’t like (42%), or so that their experience on the
website/app can be personalised (37%).
However, 14% of internet users were not aware why companies collected this information, and this
was higher than average among over-65s (19%), those in DE households (24%) and narrow internet
users (21%).
Also, despite having similar levels of confidence as other internet users in feeling that they could
manage who has access to their personal data online, smartphone-only internet users were not as
well equipped to actually manage this. They were less likely to be aware of each of the ways in which
their personal data can be collected online and were also less aware of the reasons and motivations
why companies wanted their data in the first place.
Most internet users were taking some type of security measure online
The vast majority (94%) of internet users said that they, or someone in their household, took at least
some type of security measure to protect themselves online. The only security measure undertaken
by most internet users was using strong passwords (68%). The next most common measures were
11
Listed options included: target advertising, information or other content at their users, build up a profile of
their users and what they like and don’t like, personalise their experience when using the website/app, sell
users’ information/data to other companies, track their online behaviour over time, tailor prices for products
and services, influence users’ opinions and behaviours.
20downloading the latest software updates onto devices when prompted (50%), and using security
software such as anti-virus or anti-spyware (47%).
Younger internet users aged 16-34 were more likely than average to use fingerprint or facial
recognition technology to access a device or app or to make purchases online (52% for 16-34s vs
43% for all internet users), to say they used a virtual private network (VPN) (29% vs 22%) or to use
software to flag fake news or disinformation (14% vs 10%). However, 16-24-year-olds were less likely
than average to use each of the seven other online safety measures. 12 Broadly speaking, those aged
55 and over were more likely than average to use most of them.
When buying things online, 60% of adult internet users made ‘appropriate’ 13 checks before entering
their payment details, while 33% did not tend to make any legitimate form of evaluation. 14
This suggests that most internet users take steps to minimise risk and harm online. However, a
significant minority remain who are not equipped to manage their online personal and financial data
safely.
Attitudes towards being online
Our surveys sought to gauge UK internet users’ opinions on a range of attitudinal statements
towards being online. These were asked in a broad sense and were not there to test any existing or
potential regulatory frameworks. The findings reflect general consumer attitudes and not necessarily
those of Ofcom or the Online Safety Bill.
12
The other security measures surveyed included: using strong passwords, downloading the latest software
updates, using security software such as an anti-virus or anti-spyware package, deleting cookies, using email
filters or software that can block unwanted or spam emails, using a firewall, and routinely backing-up
information on devices.
13
‘Appropriate’ checks included: checking if the site looks secure (padlock symbol or https), if familiar with the
company or brand, if there is a link to another reputable service like PayPal, if there is a guarantee that details
won’t be shared with anyone else, and if the site is recommended by friends and family.
14
‘Inappropriate’ checks included: checking if the site is listed by a search engine. ‘Not making any checks’
included: entering details if it is the only way to get the desired product or service, or entering details
whenever required.
21Being online has helped most internet users broaden their view of the world or learn a
new skill
A majority (58%) of internet users agreed that the benefits of being online outweigh the risks. On the
other hand, a minority (14%) disagreed and 28% were unsure. Broad internet users were more likely
than average to agree with the statement, while narrow internet users were more likely to disagree.
Some of the positives that internet users associated with being online included it helping to broaden
their understanding or view of the world (68%) and helping them learn a new skill (61%).
Generally, those who were less likely than average to agree that the benefits of being online
outweigh the risks were also less likely to feel that they had broadened their view of the world or
learnt a new skill with the help of the internet. This was the case for narrow internet users and those
aged 65+.
Some internet users were cautious about the long-lasting consequences of what is said
online
Internet users were more likely to agree (46%) than disagree (27%) that they worry about whether
something they say online could cause them problems in the future. Younger internet users were
more likely to agree than average; the majority (55%) of internet users under the age of 45 were
worried about this.
In recent waves, several participants in the Adults’ Media Lives study have reported being more
circumspect about their online presence and what they post online, or have expressed concerns
about the potential impact of digital footprints coming back to hurt people in the future.
If tomorrow you were to become famous but someone had access to your thoughts and feelings
when you were 13, they could probably cancel you quite quickly. A child is too young to
understand that what they say now, what they post now, could be brought up to try and ruin their
livelihood thirty years down the line.
Male, 25, Tutor, London
In my job, it's really strict and I just get really paranoid now. So I've not got my full name on any of
my social medias, I'm not on Facebook anymore and I've changed my Twitter name to a really
cryptic name... I could post something that is completely innocent and everyone in my generation
would find funny, but it would only take one person to be offended by it… I would not want to
work this hard to get this far to be given a warning by the regulator for a stupid TikTok that I put
up.
Female, 27, Trainee Solicitor, Edinburgh (in 2020)
There was growing agreement on the need for online protection
There was a clear view that providers should be responsible for monitoring content posted on their
sites or apps: four in five (81%) internet users agreed with this. A majority (65%) of internet users
also agreed that those online must be protected from seeing inappropriate or offensive content. This
has risen slightly from 61% in 2020. Internet users aged 65+ were more likely than average to agree
with both statements, and women were more likely to agree than men. Conversely, internet users
aged 16-24 were less likely to agree with both statements.
Views on the free speech dimension of online content were less clear-cut. Although, a majority of
people (55%) are now more likely to disagree with the idea that people should be able to say
22whatever they want online, even if hurtful or controversial, up from 47% in 2020. Again, there were
differences in attitude by gender (women were more likely to disagree than men) and by age:
internet users aged 55+ were more likely than average to disagree, and those aged 16-24 and 35-44
less likely.
Views were even more mixed on anonymity online. There was no majority opinion as to whether
people should have the right to hide their identity online in order to express their views
anonymously; 33% of internet users agreed they should and 44% disagreed. However, there was a
slight shift towards the opinion that people should not be able to hide their identity online: the
proportion who thought this rose from 34% to 44%. The proportion who agreed with the statement
and thought that people should be able to hide their identity fell from 38% to 33%.
Gender and age differences persisted on the topic of anonymity; women were less likely to agree
than men, while internet users aged 65+ were less likely than average to agree and those aged 16-24
more likely.
Online communication platforms
Use of online communication platforms is almost ubiquitous among internet users
Almost all (98%) internet users were using at least one type of online communication platform in
2021. This included messaging sites or apps, used by 94% of internet users to send messages or
make video or voice calls, video-sharing platforms, used by 88% to watch videos or clips, and other
social media sites or apps, used by 88% of internet users for things like ‘following’ people or
organisations or sharing photos, opinions, comments, etc.
Online communications platforms also include live-streaming sites or apps, which were slightly less
widely used, but nevertheless, a majority (61%) of internet users were watching or sharing content
via such sites or apps. The use of live-streaming sites or apps varied most by age and was more
popular among younger internet users: 90% of internet users aged 16-24 were watching or sharing
content on live streaming sites or apps, but only 20% of those aged 65+ were doing this.
A minority of internet users were uploading or live streaming their own videos, most
commonly those aged 16-34
Although the majority of internet users were using video-sharing platforms and live-streaming sites
or apps, a smaller proportion were uploading or live-streaming their own videos. Three in ten (30%)
internet users were uploading their own videos onto video-sharing platforms, and this was more
common among 16-34s, at 50%. A smaller minority (16%) of internet users were posting or sharing
live-streamed videos, and again, this was more common among 16-34s, at 28%.
23Among live-streamers, both overall and 16-34s, Instagram was the most commonly used site or app
for uploading and live streaming, followed by YouTube, Facebook and TikTok.
Broad internet users (who were completing more activities online, as defined above) and those in AB
households were more likely than average to upload and live-stream their own videos.
Internet users were using more than six different online communications platforms on
average
Across all of the four uses of online communication platforms described above, YouTube was the site
or app used by the most internet users (80%), followed by Facebook (74%) and WhatsApp (72%).
Instagram was the only other site or app to be used by more than half of internet users (54%) but
there were many other sites or apps being used by a minority of internet users. On average, internet
users were using 6.2 online communications platforms. 15
The biggest users of online communication platforms were younger adults, and in particular 16-24s.
Internet users aged 16-24 were using an average of 8.7 online communication platforms, and they
were more likely than average to use many of the sites or apps. However, Facebook was a notable
exception: 16-24s were less likely than average to use it for any of the four activities (social media,
messaging, video sharing, live streaming). Use of most other sites or apps decreased with age and so
did the average number used, down to 3.0 for internet users aged 65+.
Sites or apps that were particularly skewed towards younger audiences included Instagram (used by
90% of internet users aged 16-24 compared to 54% of all internet users), Snapchat (83% vs 32%) and
TikTok (74% vs 34%).
When social media users were asked what their ‘main’ site or app was (the one they used most
often), the top three sites chosen by 16-24s were Instagram (30%), Snapchat (24%) and TikTok
(21%).
However, only Instagram (18%) appeared in the three most common ‘main’ social media sites or
apps among all social media users, ahead of Twitter (9%) but significantly behind Facebook (51%).
The choice of Facebook as social media users’ main site or app was more common among older
users; more than four in five (83%) social media users aged 65+ said Facebook was their main site or
app.
There was further decline in the perceived appeal and claimed use of Facebook among participants
in the Adults’ Media Lives study (particularly among under-30s), although the majority of
15
Out of 32 that we asked about.
24participants still had an active Facebook account, and it continued to be used by more participants
than any other platform.
I use Snapchat every day, Instagram every day, TikTok every day. Facebook… I check on it every
day, but I don't use it every day.
Male, 17, Student, Manchester
Since 2020, there has been more widespread adoption of TikTok, and accessing of TikTok-style
content through other platforms such as YouTube and Instagram Reels. This type of short-form video
content appeals to users for its instant gratification, and several commented that the TikTok
algorithm was particularly effective at serving up content to their taste. However, the appeal and
use of this type of content varied widely. Among our sample, users were exclusively younger
participants under 30.
You know, as soon as you go on it, you're getting something that's going to distract you, and it just
fills time and a lot of it I find quite funny... The videos that come up on it... they make me laugh.
Female, 28, Solicitor, Edinburgh
I was talking to my Dad the other day and my Dad asked, "Do you speak to your brother?" And I
said "No, but he sends me a TikTok every day". We don't have a lot of time to talk. He works and
I'm at uni, but it's nice that we sort of think about each other to send a TikTok.
Female, 21, Student, Loughborough
Younger social media users were more likely to be actively engaged when using these
sites or apps
Users were interacting with social media sites or apps in a range of different ways. Some were
actively engaging with them: 29% said they often shared, posted or commented on these sites or
apps and 33% said they sometimes did. Others were more passive in their use: 20% of users said
25they usually just ‘liked’ things and 17% said they tended to only read things and rarely liked or
posted anything themselves.
Two in five (39%) social media users aged 16-24 said they often shared, posted or commented on
social media sites or apps, compared to 14% of users aged 65+. In contrast, 34% of social media
users aged 65+ said they tended to only read things on these sites or apps, and rarely liked or posted
anything themselves, compared to only 7% of users aged 16-24.
Half of internet users aged 16-24 had multiple profiles on the same online communication
platform
Overall, one in five (20%) internet users said they had multiple profiles on any online communication
platform. This was driven by younger internet users; 49% of internet users aged 16-24 had more
than one profile the same site or app.
Of those with multiple profiles, the most common site or app where they had multiple profiles was
Instagram (46%). A quarter had more than one profile on YouTube (26%) and a similar proportion on
Facebook (25%).
The most common reason for having more than one profile on the same site or app was having a
separate account dedicated to a hobby such as cooking, reading or photography (43%). Other
common reasons varied by gender. Women were more likely than men to have one account for
close friends and another for a wider circle of friends or contacts (36% vs 26%), whereas men were
more likely than women to have a separate account for business purposes (34% vs 26%).
Younger users of online communication platforms were more likely to feel that there is
pressure to be popular on these sites or apps and were less confident managing who had
access to their posts
Half (48%) of online communication platform users agreed with the statement that there is pressure
to be popular on these sites or apps. Users aged 16-24, who were using the most online
communication platforms and were more likely to be actively engaged when using them, were more
likely than average to agree that there is pressure to be popular (59%).
Despite being more likely to share their own content on social media, online communication
platform users aged 16-24 were also less confident in managing who had access to those posts; 19%
of 16-24s in this group were not confident in using the settings on these sites or apps to control who
sees their photos and videos, compared to 13% of all adult users. Narrow internet users and those
aged 65+ were also more likely than average to be unconfident, but broad internet users were less
likely.
Overall, online communication platforms remain an important part of most users’ lives
Unsurprisingly, given the high level of use, users have many positive associations with online
communication platforms. A majority (76%) agreed with the statement that using these sites or apps
helps them to keep in touch with family or friends. This was largely consistent across age groups
(only16-24s were less likely than average to agree, at 69%), but women were more likely than men
to agree (80% vs 73%). Overall, the proportion in agreement decreased slightly between July (78%)
and October (74%) 2021.
For participants in the Adults’ Media Lives study, WhatsApp and, to a lesser extent, other messaging
apps such as Facebook Messenger were credited with having played an important role in the past
year in mitigating the problems of isolation and loneliness.
26The main one I use to communicate with friends is WhatsApp. We also have a class WhatsApp for
each of the children. That means we can remind each other of things that are going on, where you
need to be, if there’s a meeting. It’s an amazing tool. And I find the video call function on it too is
brilliant.
Female, 44, PA, Woking
I’m on WhatsApp now. My daughters and I have a kitchen group if we’re making a recipe
together. My neighbour is always sending me funny pictures of cats and things like that.
Female, 77, Retired, Edinburgh
There were also numerous examples of social media being intrinsically involved in participants’
major life events: for example, organising a wedding, setting up a business or moving into a new
area.
I probably did use Instagram quite a lot actually for planning the wedding, for things like flowers...
I got them off Instagram and sent the pictures of what I liked to my florist. Same with the dress.
We actually put a Facebook album up for a while as well… We dithered about it because you don't
want to be those people that just post their wedding absolutely everywhere. But we decided that
actually it is quite a nice thing and friends want to see it, I think… Of course you're cautious that
your wedding looks good when you put it out there.
Female, 33, Doctor, London
Gaming
Gaming was a popular activity for many adults, and in particular 16-24s
A majority (60%) of adults were playing games on any electronic device, with incidence higher
among younger adults, peaking at 88% for 16-24s, and decreasing with age. In 2020 there was an
increase in the proportion gaming (62%), as adults sought new forms of entertainment under the
restrictions of the pandemic, but this has remained consistent in 2021 even as restrictions have
eased.
Overall, the most common device used for playing games was a mobile phone (37%). But among 16-
24s the most common device was a games console or player, used by a majority (60%, compared to
30% of all adults), and they were also more likely than average to use a desktop or laptop computer
(43% vs 22%).
Younger gamers were more likely than average to play most types of games. The main exception
was games based around completing puzzles or quizzes, which gamers aged 16-24 were less likely to
play. This type of game was more popular among older gamers; those aged 45+ were more likely
than average to play.
A majority of 16-24s who played games were doing so online with other people
Two-thirds of gamers played online, and this was, again, more common among younger adults, at
81% of gamers aged 16-24. When playing online, 41% of all gamers were playing with or against
someone else. It was more common for gamers to play with or against someone they already knew
(32%), though one in five (21%) were playing with or against people they did not know and had not
met in person.
27A majority (58%) of gamers aged 16-24 were playing games online with or against someone else.
Half (49%) were doing so with people they knew and three in ten (29%) were doing so with people
they didn’t know.
Men were more likely than women to play games and had different device and game
preferences when doing so
Sixty-three per cent of men were playing games compared to 56% of women, and while women
were more likely than men to use a phone (41% vs 33%) or tablet (21% vs 16%) to play games, men
were more likely than women to play on most other devices including games consoles (39% vs 22%)
and computers (29% vs 14%).
Among those who were playing games, women were more likely than men to opt for a game based
around completing puzzles or quizzes (66% vs 39%), while men were more likely than women to play
games that involved competing alone or in a team against other people or teams, or in games where
you follow a story or beat levels/challenges.
Perhaps linked to the types of games being played, men were also more likely to play online (45% vs
34%) and play online with or against someone else (36% vs 22%), including existing contacts as well
as strangers.
Gaming was an important social activity for the young men in the Adults’ Media Lives study. They
primarily described themselves playing console-based games, usually as a social activity with friends
(either online or in person).
I have a PlayStation 4. I like playing FIFA. Luckily I have someone who likes football the way I do –
that’s my brother’s son. Whenever he comes round, we play that.
Male, 40, NHS Support Worker, Liverpool
28You can also read