Harmful Digital Communications in New Zealand - ANNUAL POPULATION SURVEY 2017 Prepared by Dr. Edgar Pacheco and Neil Melhuish - Netsafe
←
→
Page content transcription
If your browser does not render page correctly, please read the page content below

Harmful Digital Communications in New
Zealand

ANNUAL POPULATION SURVEY 2017

Prepared by Dr. Edgar Pacheco and Neil Melhuish

1
HARMFUL DIGITAL COMMUNICATIONS IN NEW ZEALAND: ANNUAL POPULATION SURVEY 2017
Wellington, New Zealand, January 2018
www.netsafe.org.nz
research@netsafe.org.nz
Suggested citation: Netsafe. (2018). Harmful digital communications in New Zealand: Annual Population
Survey 2017. Wellington, NZ: Netsafe. Retrieve from https://www.netsafe.org.nz/annual-population-
survey-2017
ISSN: 2538-0796

                   ATTRIBUTION-NONCOMMERCIAL-SHAREALIKE
                   https://creativecommons.org/licenses/by-nc-sa/4.0/ [English]
                   https://creativecommons.org/licenses/by-nc-sa/4.0/legalcode.mi [Te Reo Māori]

2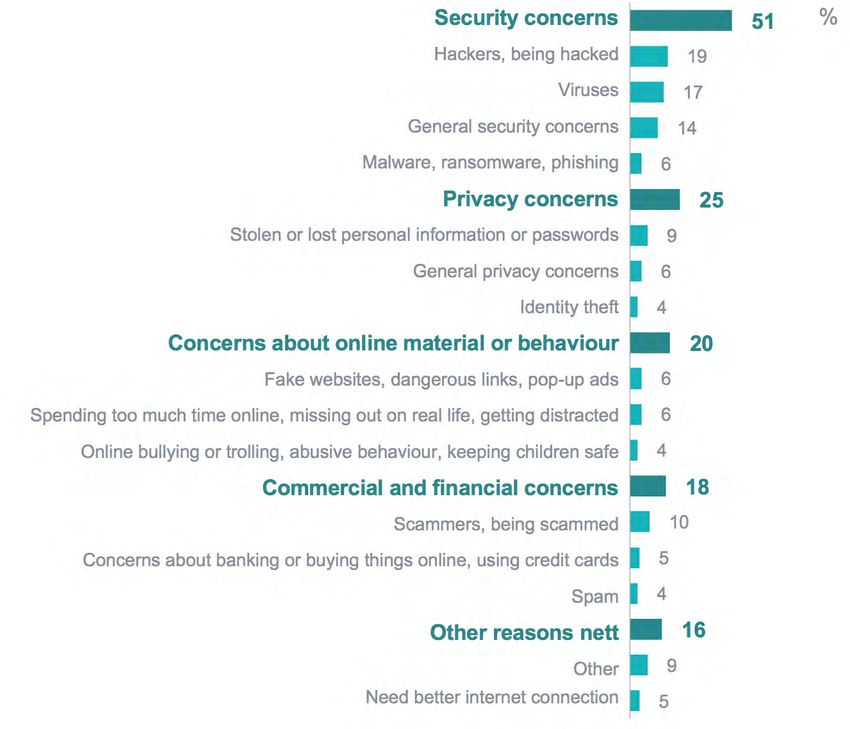
Contents

Foreword                                             4
Executive Summary                                    5
    About the Annual Population Survey               5
    Key findings                                     6
Introduction                                         8
    Research landscape                               8
    Research design                                 11
Survey findings                                     15
    New Zealanders’ digital behaviour               15
    Awareness of the legislation                    29
    Experiences of harmful digital communications   32
    Accessing support services                      38
Conclusion                                          44
References                                          46
Appendix                                            48
    Additional demographic information              48

3
Foreword
In 2015 the NZ Government passed the Harmful Digital Communications Act (the Act) to deter,
prevent and mitigate harm caused by digital communications and to provide victims of harmful
digital communications with a quick and efficient means of redress.

The Harmful Digital Communication Act (the Act) recognises that online abuse and
harassment is not something that can be improved through regulation and enforcement alone.
In addition to the new tools it created for the Police and the courts, the Act established the not
for profit Netsafe as the Approved Agency. That makes Netsafe formally responsible for
attempting to resolve harmful digital communication complaints, for educating New
Zealanders about harmful digital communications, and for the online safety community serving
New Zealanders.

Harmful digital communications are a shared problem requiring a shared solution.
Understanding New Zealanders’ experiences of harmful digital communications enables
everybody from government agencies, online content and service providers, to parents and
teachers to make an informed contribution to improving our digital society.

At the heart of the Act are the communications principles. This approach to addressing online
abuse, harassment and cyberbullying is unique to New Zealand. They define what New
Zealand believes is and isn't acceptable behaviour, and have played a key role in informing
this study.

This study confirms that in general New Zealanders agree with the communications principles.
They particularly value the principles related to some of the most serious online challenges
(such as encouraging someone to commit suicide or sharing intimate images of someone
without their permission).

If it feels like abuse, harassment and trolling are rife online - they are. One third of New
Zealanders experience unwanted communications each year, and one third of them report
those experiences negatively disrupting their lives.

Clearly that is not where New Zealand wants to be as a society. The findings in this study
reinforce the importance of all the components of the Act. They also reflect the importance of
us all working together – as an online safety community - to reduce online harm while
encouraging New Zealanders to take up the opportunities that digital technologies bring.

Martin Cocker
Netsafe CEO

4
Executive Summary
In May 2016 the Governor-General appointed Netsafe as the Approved Agency under the Act
following a recommendation made by the Ministry of Justice (the Ministry). The role of the
Approved Agency under the Act is to assist New Zealand internet users in dealing with harm
and distress caused through any form of digital communication such as text messages,
writing, pictures, audio and video recordings, or other matter that is communicated
electronically (Harmful Digital Communications Act, 2015). To achieve this, Netsafe has
statutory functions to provide online safety advice and education to the public and collaborate
with government agencies and service providers.

About the Annual Population Survey
While new technologies offer a number of benefits and opportunities, their use is
accompanied by challenges and potential risks. This includes the different forms of abuse and
intimidation that the Act seeks to address. As part of its functions as the Approved Agency,
Netsafe has conducted the first in a series of Annual Population Surveys (APS). The objective
of the APS is to gauge attitudes and behaviours and to start monitoring national trends
regarding potentially harmful digital communications in Aotearoa-New Zealand.

This report presents the main findings of the 2017 APS. The APS is the first nationally
representative study that looks at adult New Zealanders and digital communications in the
context of the Act. Key aspects of the Act - such as the communication principles - and key
internet safety concepts have informed the development of the research instrument and the
analysis of its findings.

The study was planned and administered by Netsafe between February and September 2017.
An online survey was conducted with a representative sample of 1,018 adult New Zealanders
(aged 18+) between 30 May and 30 June 2017. Data collection was conducted by Colmar
Brunton. The maximum margin of error for the whole population is ±3.1% at the 95%
confidence level.

The study provides insights regarding New Zealanders’ access to and use of digital
technologies. It also explores people’s level of awareness of the Act. A key focus of the study
is to measure participants’ experiences of digital communications, including perceptions and
experiences of harm and distress in the last 12 months. Finally, the study presents relevant
insights regarding New Zealanders’ personal responses, and access to services and
resources to deal with unwanted digital communications as well as potential harm and
distress.

As research on adult New Zealanders and their experiences with digital communications is
limited, the APS provides first-hand research evidence on this subject to government
agencies, online content and service providers, law enforcement, the research community,
and the general public. However, considering the evolving nature of new technologies and
how people engage with digital tools, new online challenges and risks are likely to emerge.
Thus, the study of the nature and impact of digital communications, including potential harm
and distress, will remain a relevant but challenging area of research, analysis, and policy
intervention.

5
Key findings

NEW ZEALANDERS’ DIGITAL BEHAVIOUR
1.   New Zealanders are highly connected. A large majority connect online using smartphones
     and over 65% use 3 or more devices to access the internet. Also, 1 in 5 spend more than 6
     hours a day online on average.
2. New Zealanders have an appetite for more information about keeping safe online. Most
   would consider taking further action to protect themselves and others online. Yet, 1 in 5
   lack knowledge about how to keep safe online.

3. When asked about what the risks of going online are, security (e.g. hackers, viruses,
     malware) is New Zealanders’ primary concern followed by privacy (e.g. loss of or stolen
     personal information) and concerns about online material or behaviour (e.g. online bullying
     or trolling, fake websites).
4. New Zealanders tend to think the most effective way to keep safe online is to use
   protective software and to update software automatically. While 7 in 10 have taken such
   action in the last year, those who haven’t done so commonly do not know what actions to
   take, or believe they have already done everything they can to protect themselves and
   others.

AWARENESS OF THE LEGISLATION
5. The majority of New Zealanders are aware of aspects of the legislation and its provisions
   around digital communications, particularly in relation to the courts’ ability to order the
   removal of harmful content.
6. However, the lesser known aspects of legislation are the existence of the ten legal
   principles of online communication.
7. When introduced to the ten principles for communicating online, New Zealanders believe
   that the three most important are: not to encourage someone to harm themselves, not to
   share intimate images of someone without their permission, and not to share indecent or
   obscene content.

EXPERIENCES OF HARMFUL DIGITAL COMMUNICATIONS
8. Almost a third of New Zealanders have experienced at least one type of unwanted digital
   communication in the past year. However, this includes a broad range of online
   experiences, from less serious (such as receiving spam) to more serious incidents (such as
   being stalked or threatened online), not all of which are covered by the Act.
9. Nearly 1 in 10 (9%) of New Zealanders experienced an unwanted digital communication
   that had a negative impact on their daily activities. The two most common negative
   consequences were being unable to participate online as usual and being unable to sleep
   or eat properly.
10. Most experiences of unwanted digital communications occurred through an email (41%)
    followed by a post in one’s social media page (27%).

6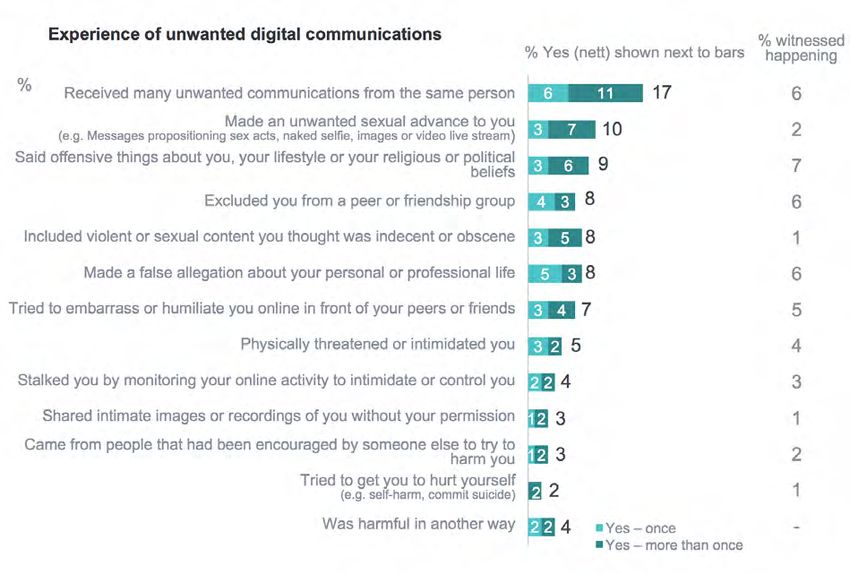
11. Just over a third (36%) of those who experienced an unwanted digital communication said
    that they were approached by a stranger.
12. About a fifth (21%) of those who experienced an unwanted digital communication said that
    the experience was also part of a situation happening offline.
13. The most common emotional reactions among those who received an unwanted digital
    communication were feeling angry, frustrated, and distress.
14. The greatest impact people experience is caused by digital communications that
    encourage someone to hurt themselves or involve the sharing of intimate images without
    permission. These types of communications have a greater negative impact on a person’s
    ability to do daily activities and take more of an emotional toll on those who receive them.

ACCESSING SUPPORT SERVICES
15. Most people experiencing unwanted digital communications do not contact any support
    service. Those who sought support in the last year tended to contact an internet service
    provider or platform to request the removal of content, block the person responsible or to
    make others aware of the issue. Half of those who sought help say the support was
    effective.
16. When asked to consider the support they may seek if they experience an unwanted digital
    communication in future, the police were most frequently considered as a primary source
    of support (in particular if intimate images are shared online without permission).
17. Internet service providers tend to be considered helpful in removing content, while
    telecommunications support is thought to be more useful when being stalked online. Most
    people say they would not seek any help if they were to be excluded by a peer group.

7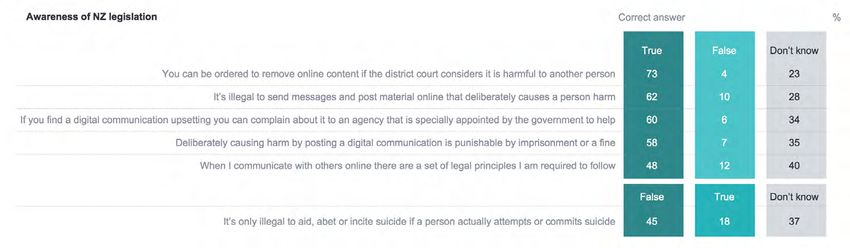
Introduction
This section of the APS is divided into two parts. The first is the research landscape. This
presents a summary of relevant literature regarding adult New Zealanders and digital
technologies, including access, use, issues, and online risks. The purpose is to provide a
context for interpreting the APS results and findings. The second part is the research design,
describing the methodology applied in the study.

Research landscape
This section outlines relevant studies conducted in New Zealand and overseas and
summarises past and recent trends related to the APS subject matter. It provides
complementary and up-to-date contextual information about research on online challenges
and risks among adult New Zealanders.

Digital technologies are ubiquitous with their adoption having rapidly spread among New
Zealanders.

Since the inception of these tools several academic and industry-based studies have explored
aspects such as technology use, access, connectivity and literacy. The latest Household Use
of Information and Communication Technology survey (Statistics New Zealand, 2013), for
example, reveals that 4 out of 5 New Zealand homes have access to the internet and that 40%
of households use more than one device to connect online. A comparative study by the World
Internet Project New Zealand (WIPNZ) also shows that internet use has steadily grown from
82% to 90% between 2007 and 2015 (Smith, Bell, Miller, & Crothers, 2016). Similarly, use of
wireless-enabled devices such as mobile phones and tablets has dramatically increased from
8% to 87% in the same period. In short, New Zealanders are quick adopters of new
technologies.

There are indications that the ‘digital divide’ has narrowed, but inequalities persist.

To some extent, the digital divide – which mainly refers to the access to digital technologies –
seems to be decreasing; however there are still issues related to household income and
ethnicity that prevent some New Zealanders from accessing the internet (Smith et al., 2016). In
addition, apart from access to technology, the complex nature of the digital divide also
includes aspects such as capability and participation (Starkey, Sylvester, & Johnstone, 2017)
that require further attention, especially in regard to their impact on disadvantaged groups in
New Zealand society.

New Zealanders’ use of digital technologies is displacing traditional communication channels.

Similarly, for New Zealanders new technologies are an important means of information and
communication. The WIPNZ also demonstrates, for example, that the internet has displaced
traditional forms of entertainment media such as newspapers and television, particularly
among younger age groups. Social networking sites are playing a critical role as a
communication medium with instant messaging replacing text as the main means of daily
digital communication (Smith et al., 2016).

8
Digital technology provides not only benefits but also challenges.

Digital technologies offer a range of opportunities for social, cultural, civic and economic
advancement. While a large majority of the population seems to embrace the benefits of new
technologies, many people must deal with experiences that have a negative impact on their
everyday life activities, safety and wellbeing. Terms such as ‘cyberbullying’ and ‘revenge porn’
have been coined to describe online behaviours and practices intended to harass and cause
harm. The range of these kinds of behaviours can include – but are not limited to – sending
threatening messages, spreading damaging or degrading rumours, and publishing intimate
photographs or videos without permission. New Zealand legislation is addressing these issues
through the Act which focuses on the “serious emotional distress” caused via electronic
means (Harmful Digital Communications Act, 2015). Some argue that the inception of the
internet and related technologies has caused the emergence of these forms of aggressive
and/or harmful behaviours (Slonje & Smith, 2008). Others assert that what technology does,
instead, is to mirror, magnify, and make more visible the good, bad, and ugly of everyday life
(Boyd, 2014).

Children and young people are the focus of most national and international research into the
impact of harmful digital communications.

The current body of knowledge about technology-mediated challenges and harm – via email,
pictures, videos, and other electronic means – has mainly centred on children and young
people (Livingstone, Haddon, Görzig, & Ólafsson, 2011; Powell & Henry, 2014; Slonje, Smith, &
Frisén, 2013). A similar trend has been evident in New Zealand among academics and
government agencies, especially in the context of school settings (Fenaughty & Harré, 2013;
Jose, Kljakovic, Scheib, & Notter, 2012; Marsh, McGee, Nada-Raja, & Williams, 2010; Ministry
for Women, 2017; Netsafe, 2017; Office of Film and Literature Classification, 2017; Raskauskas,
2009). While there are valid reasons to do research focused on children and young people,
researchers and practitioners have paid less attention to adults’ experiences with online
challenges through digital technologies.

There is a paucity of research into adults’ experience of harmful digital communications.
Where it exists, it typically focuses on a specific context, such as the workplace.

Only a few relevant projects based on representative samples of adults have been conducted
in the United States (Pew Research Center, 2014, 2017; Smith & Duggan, 2018) and Australia
(Powell & Henry, 2014). Indeed, research on adults has been more context specific, for
instance, cyberbullying in the workplace (Snyman & Loh, 2015), and more recently from a
gender perspective, in particular on women’s experiences with image-based sexual abuse,
also known as ‘revenge porn’ (Bates, 2017; Henry, Powell, & Flynn, 2017).

In New Zealand, Netsafe believes that the research on adults is still insufficient. Among the
few was a study requested by the Law Commission in 2012. The study surveyed a
representative sample of 750 New Zealanders aged 18-70 about their experiences of “harmful
speech on the internet” – the term was used as an umbrella to describe situations such as
cyberbullying and harassment, harm to reputation or invasion of privacy (Law Commission,
2012, p. 33). The findings revealed that 1 in 10 adults experienced harmful speech on the
internet. The results also showed that rates were higher among young people aged 18-29

9
years old (22%), Māori and Pacific people (19%), and those not in paid employment (17%) (Law
Commission, 2012). The findings of the study were pivotal for the development of the Harmful
Digital Communications Act 2015.

In the Aotearoa-NZ context there has been recent work on young adults’ experiences of
cyberbullying…

Recent studies have measured people’s experiences of aggressive and abusive online
behaviour. However, they have been aimed at specific aspects or have applied different
methodologies, providing a useful but still partial look at the phenomenon. For instance, the
New Zealand Attitudes and Values Study conducted by the University of Auckland (Steiner-
Fox et al., 2016) has reported on the state of cyberbullying. Participants were asked whether
someone has ever used the internet, a mobile phone or a digital camera to hurt, intimidate or
embarrass them. The study found that 11.5% of the respondents reported having been
cyberbullied. The findings also showed that cyberbullying was more prominent among young
adults, especially among those aged 18 or 19 years old (46%) and that 3 in 5 women in the
same age group have experienced cyberbullying: the highest rate among all groups (Steiner-
Fox et al., 2016).

…and research that explores women’s experiences of online challenges.

Similarly, Norton by Symantec, the cybersecurity company, has reported on New Zealand
women’s experiences with online harassment. The company found that online harassment
ranged from unwanted contact, trolling, character assassination, and cyberbullying to sexual
harassment and threats of physical violence, rape and death (Symantec, 2016). Its study found
that 52% of women aged 18 years old or over have experienced some form of online
harassment. The rate increased among young women under 30 years old with 72% of
respondents in this age group having dealt with online harassment. The study adds that
“harassment is frequently of a sexual nature. 1 in 10 women have experienced graphic sexual
harassment, rising to nearly 1 in 5 (18%) for women under 30.” (Symantec, 2016, para. 8). In
addition, respondents indicated that they were harassed online mainly because of their
physical appearance (19%), weight (16%) and gender (10%). Note that the report did not
describe how the study was conducted.

There is a nascent, but developing, body of research on adults’ experiences of online
challenges, to which the findings of the APS 2017 contribute.

In summary, while these studies make relevant contributions, measurement of the implications
of technology-mediated harm and distress in relation to disability and ethnicity, for instance,
remains neglected. There is a need to assess the current scope of digital harm in the context
of the Harmful Digital Communications Act 2015. The APS will contribute by providing updated
data every year from 2017, the baseline year for observing national trends.

10
Research design
The APS mainly relied on quantitative data collected through an online survey. The planning,
design, implementation, and analysis of the survey findings were conducted from February to
September 2017. Further details about the research methodology are provided in the
following sub-sections.

OBJECTIVES

The general objective of the APS was to measure, describe and understand the attitudes,
behaviours and experiences of adult New Zealanders when using new technologies and
dealing with harm and distress caused by digital communications.

The specific objectives of the APS were:

     1. To measure and explain people’s digital behaviour aimed at addressing online harm
        and distress in the last twelve months;
     2. To understand the extent of people’s awareness of their rights and options under the
        Act;
     3. To understand the extent of people’s awareness and use of available services; and
     4. To gauge the extent of people’s perceived personal experiences of harm and distress
        through digital communications.

SURVEY TOOL

The APS project primarily collected quantitative data through an online survey. Conducting
such a survey was an appropriate approach considering the high level of internet penetration
in New Zealand and the embeddedness of a range of digital tools and devices in the everyday
activities of NZ users (Crothers, Smith, Urale, & Bell, 2016). In addition, data collected from an
online survey can be managed easily which facilitates analysis and reporting of findings. Data
were collected from a representative sample of the New Zealand population, aged 18 and
over. Netsafe designed the survey questionnaire considering feedback and suggestions from
the Ministry and Colmar Brunton. The questionnaire included dichotomous, multiple choice,
and semantic differential questions to measure people’s experiences in the last twelve
months. The 36-question online survey was conducted from May 30 to June 30, 2017.

The APS also included the collection of some qualitative data. The reason for gathering this
was to uncover new issues and insights based on the perceptions and views of the
respondents.

11
SURVEY POPULATION AND DISTRIBUTION
A total of 1,018 New Zealanders participated in the online survey. The demographic details
provided by the participants included information such as age, gender, ethnicity and region.
Māori and Pacific sub-populations were deliberately ‘boosted’ beyond what would be
achieved in a random sample to ensure representation. The maximum margin of error for the
whole population is ±3.1% at the 95% confidence level and assuming a response rate of 50%.
A detailed description of the demographic profile of the APS can be found below.
Demographic information regarding disability is presented in the Appendix section.
To which of the following
age groups do you
belong?
Which of the following
ethnic groups do you
identify with?
What is your gender?
Base: All respondents (1,018)
12In which one of the following regions do you live?
Base: All respondents (1,018)
ETHICS
In carrying out the APS project, Netsafe adhered to the ethical principles that underpin
integrity and quality in social research. Ethics were given high consideration at all stages of
the development of the project. Considering the nature of the study topic, namely digital
communications and experiences of harm and distress, Netsafe sought to minimise
disturbance to the survey participants. In this respect, the survey questions were designed to
avoid harm. Informed consent from the participants was obtained at the beginning of the
online survey. The participants received information about the purpose of the APS project, the
name of the institutions behind the study, and an explanation of how the data they provided
will be protected and used. Netsafe also ensured that Colmar Brunton, the market research
company in charge of delivering the online survey, had in place protocols to respect and
safeguard the rights and safety of the participants. Furthermore, contact information for
support services, such as Netsafe’s helpline, were also provided to the survey respondents.
13LIMITATIONS
The following limitations have been identified:
1. The limitation of surveys in general is that they are used to collect data at a single
point of time. Hence, they present a snapshot of a particular reality. As this is the first
survey regarding people’s experiences of harmful digital communications, it will be
difficult to identify and/or compare trends regarding digital communications until more
than one survey is conducted.
2. Although the online survey collected qualitative data, it is necessary to be aware that
surveys in general cannot fully capture the meanings and perceptions of respondents.
To cope with this limitation, the qualitative questions in the survey were designed in a
way that was easy to understand for the respondents, so they felt encouraged to share
their opinions. The use of semantic differential questions in the online survey also
helped to minimise this limitation.
3. Identifying specific challenges for “vulnerable” internet users is limited by the
complexity of identifying individuals.
14Survey findings
This section describes the key findings from the APS survey. It is divided into four parts. The
first presents findings about adult New Zealanders’ digital behaviour in terms of the access to
and use of new technologies. The second depicts findings regarding the level of participants’
awareness of related New Zealand legislation, namely the Act. The subsequent part reports
on participants’ experiences of digital communications, including perceptions of harm and
distress. The final sub-section describes participants’ individual responses as well as access to
services and resources to deal with the impact of digital communications.
New Zealanders’ digital behaviour
FOCAL POINTS
• Digital technologies people use in their daily lives, how they use them and their
perceived level of competence
• People’s biggest concerns and perceived risks about going online
• Actions people have taken, and plan to take, to protect themselves or others online
USE OF DIGITAL TECHNOLOGIES
New Zealanders are highly connected. A large majority connect online using smartphones
and over 65% use 3 or more devices to access the internet. Also, 1 in 5 spend more than 6
hours a day online.
Q1. In the past week, which of the following digital devices have you personally used to
connect online?
Base: All respondents (1,018)
15Q2. If you couldn’t use digital devices for a month, how would that affect you?
Base: All respondents (1,018)
Q3. On an average day, how much time do you spend online?
Base: All respondents excluding those who did not answer (967)
16ONLINE ACTIVITY AND CONTENT CREATION
New Zealanders most commonly go online to shop or manage financial matters, or to keep
track of current events. The most enjoyment had online stems from entertainment activities
such as music, videos or games, and socialising with friends and family. In terms of creating
original content online, a vast majority do this in the context of communicating directly with
others via email, text or other message, which also feature as the most enjoyable types of
content creation.
Q4. In the last week, which of the following activities have you done using digital devices?
And of the following activities, which do you most enjoy?
Base: All respondents (1,018)
17Q5 Which of the following activities have you done in the past week? And which of these
activities do you do most enjoy?
Base: All respondents (1,018)
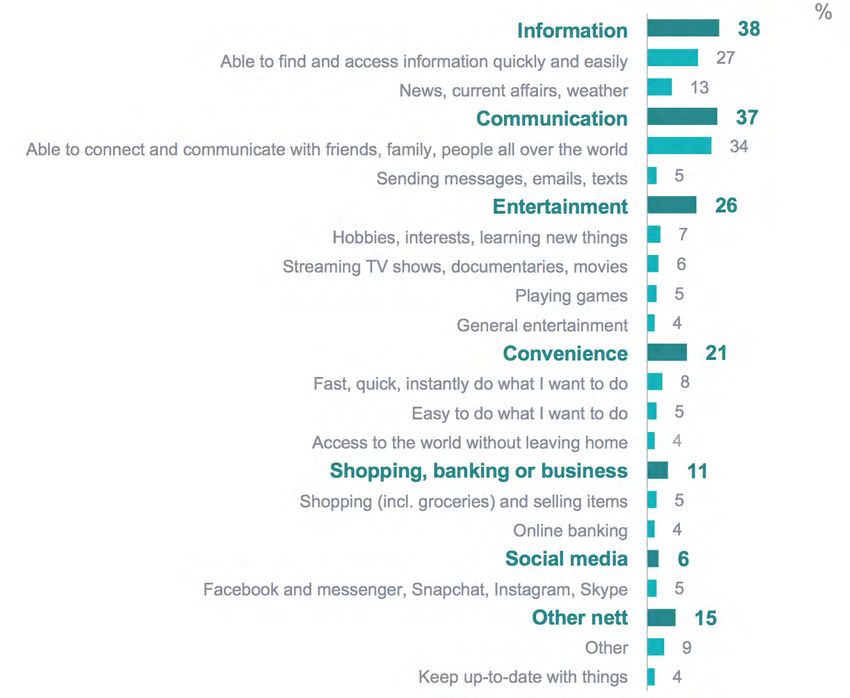
MOST ENJOYABLE ASPECTS OF GOING ONLINE
For over a third of New Zealanders, the most enjoyable aspects of going online relate to
access to information and ease of communication.
“Keeping in touch with family and friends on social media.”
Female, 50 – 59 years, NZ European
“Escapism – being able to switch my brain off and watch some enjoyable music, comedy or
history videos.”
Male, 40 – 49 years, NZ European
“I just like being able to search anything I like. If I am unsure about something I can
Google, if I’m not sure what to cook for dinner I can look online.”
Female, 18 – 29 years, NZ European
“Finding different viewpoints on all controversial news matters.”
Female, 30 – 39 years, Māori
“Researching things of interest and playing Sudoku and other online puzzle games.”
Female, 40 – 49 years, Pacific
18Q6. Thinking now about all of the activities you do online, please describe what you most
enjoy about going online1.
Base: All respondents (1,018)
1 Categories in bold show general themes, with more detailed description below. Categories mentioned by less
than 4% are not shown.
19BIGGEST CONCERNS AND PERCEIVED RISKS ABOUT GOING ONLINE For a slight majority of New Zealanders (51%), the biggest risk when going online relates to security issues such as hackers, viruses and malware. Privacy concerns are also prevalent among a quarter of those surveyed. “Blurred lines between trustworthy and damaging websites and/or news channels.” Female, 50 – 59 years, NZ European/Māori “Due to the anonymity online, people don't treat others with respect and try to shut down, debate and bully those who they disagree with.” Male, 18 – 29 years, NZ European “Security in online purchasing, privacy in websites and tracking my use of them.” Female, 40 – 49 years, Pacific “Safety, security, privacy – that my personal information is being hacked or shared without my permission.” Female, 30 – 39 years, Māori “Viruses and cyber attacks.” Male, 40 – 49 years, Asian 20
Q7. In general, apart from the speed of your internet connection, what do you consider to be
the main challenges or risks of going online?2

                                                                                    Base: All respondents (1,018)

2The definitions of these general themes can be overlapping. Categories mentioned by less than 4% are not
shown.

21
DIGITAL COMPETENCY
While more than 7 in 10 New Zealanders say they rarely require assistance when using
technology, 1 in 5 know little or nothing about keeping safe online. More than 4 in 5 contribute
positively and respectfully online and know how to search the internet to find what they want.
Q8. Which of the following best describes your experience when using digital devices?
Base: All respondents (1,018)
Q9. How would you rate your personal knowledge about keeping safe and secure online?
Base: All respondents (1,018)
22Q10. On a scale of 1 – 5, with 1 being strongly disagree and 5 being strongly agree, how would
you rate the following statements…
Base: All respondents (1,018)
Males and those aged under 40 are less likely to require assistance when using technology
and rate their personal knowledge of online safety more highly than others. Those aged over
70 tend to have more difficulty with technical competencies such as searching online, filtering
appropriate content, and managing online challenges such as privacy and security.
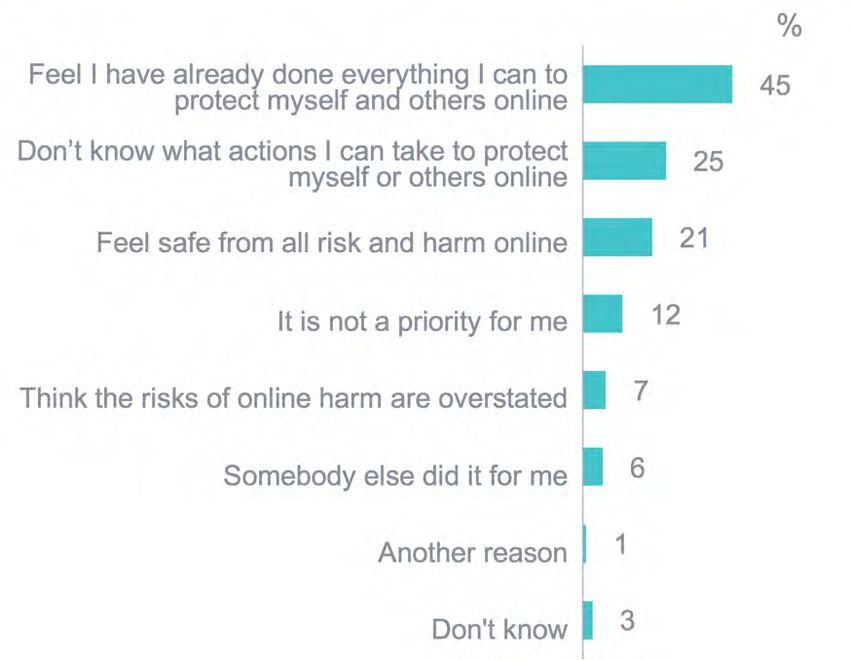
23ACTION TAKEN TO PROTECT SELF OR OTHERS ONLINE
7 in 10 New Zealanders have taken action in the past year to protect themselves or others
online, most commonly because they were concerned about online security issues or wanted
to avoid approaches from others. Those who haven’t taken recent action tend to either
believe they have done everything they can to protect themselves, or do not know what
actions to take. Those under 30 are less likely to have taken protective action.
Q11. In the last 12 months, have you taken any action(s) to protect yourself or others from
potential risks or harm online?
Base: All respondents (1,018)
Q11.a And which of the following describe(s) your reasons for taking action(s)?
Base: Respondents who have taken action to protect self or others online in last 12 months (705)
24Q11.b And which of the following describe(s) your reasons for not taking action to protect
yourself and others online?
Base: Respondents who have not taken action to protect self or others online in last 12 months (218)
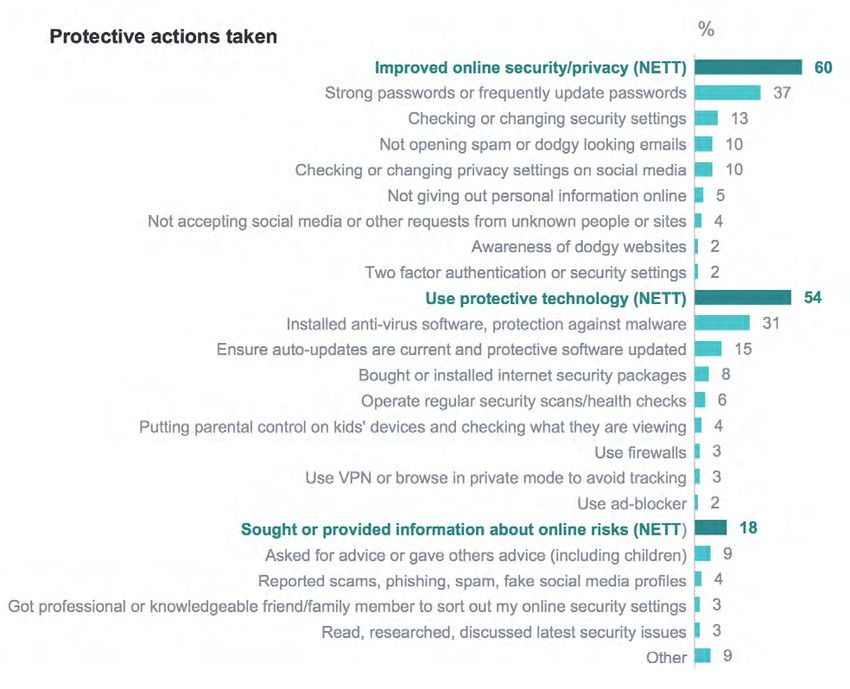
25Q12 Please describe any action(s) you have taken in the last 12 months to protect yourself and
others from potential risks or harm online.
Base: Respondents who have taken action to protect self or others online in last 12 months (705)
A small majority of New Zealanders have improved their online security or privacy settings, or
have used protective technology to protect themselves and others. Three quarters of those
who have taken protective actions believe their actions were effective.
People believe their actions to have been more effective at protecting them online when they
have bought or installed protective software, or if protective software automatically updates.
26Q12.a Overall how effective do you think these actions were?
People are more likely to
consider actions effective when
they have bought or installed
protective software, or if they
have ensured their protective
software is automatically
updated.
Base: Respondents who have taken action to protect self or others online in last 12 months (705)
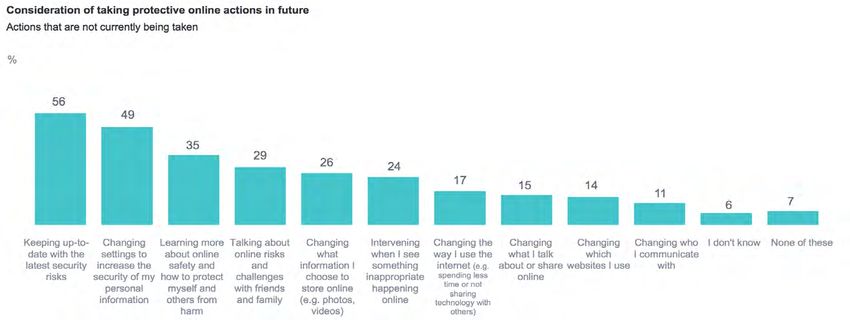
27CONSIDERATION OF FUTURE PROTECTIVE ACTIONS
Almost 9 in 10 New Zealanders would consider taking more action to protect themselves and others online in future. More than a third would
consider keeping up-to-date with security risks, improving privacy settings or learning more about online safety to keep themselves and
others safe online.
Those under 40 are more likely to consider changing the information they share online or the way they use the internet or technology, while
those over 40 tend to prefer keeping informed about security risks and learning more about online safety.
Q13. Now thinking ahead to the next 12 months, which of the following precautions would you consider taking to protect yourself and others
from potential online risk or harm?
Base: All respondents (1,018)
28Awareness of the legislation
FOCAL POINTS
• People’s awareness of aspects of the Harmful Digital Communications Act 2015
• The principles that people believe are most important when communicating online
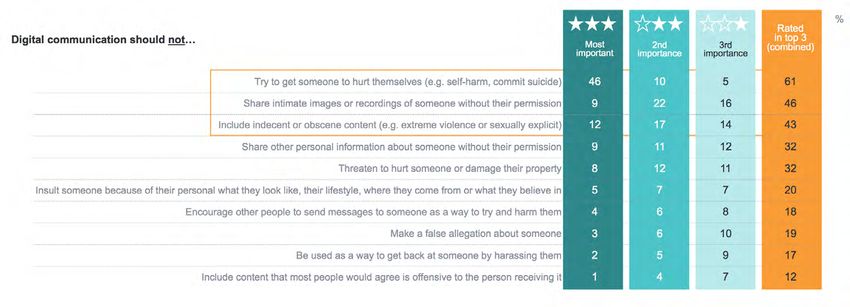
MOST IMPORTANT PRINCIPLES WHEN COMMUNICATING ONLINE
New Zealanders believe that the three most important principles for communicating online
are: not to encourage someone to harm themselves, not to share intimate images of someone
without their permission, and to avoid sharing indecent or obscene content.
Those over 60 place the most importance on communications not containing indecent or
offensive content or false information about someone, while those under 30 tend to place
greater importance on communications not being a threat to a physical safety (such as by
threatening someone or encouraging self-harm).
29Q14. Below is a list of ten statements about what digital communication should NOT be or include. Please select the three statements you consider
to be most important.
Base: All respondents (1,018)
30AWARENESS OF LEGISLATION
The majority of New Zealanders are aware of aspects of the legislation around digital communications, particularly in relation to the courts’ ability
to order the removal of harmful content. The lesser known aspects of legislation are the existence of legal principles in online communication and
that it’s illegal to incite someone to suicide regardless of whether they take action.
Those under 30 have greater knowledge that a district court can order the removal of harmful online content and that there are legal principles to
follow when communicating online.
Q15. Now thinking about your rights and responsibilities under current New Zealand legislation, please indicate whether you think the following is
true or false.
Base: All respondents (1,018)
31Experiences of harmful digital communications
FOCAL POINTS
• Prevalence of unwanted digital communications, including those that cause harm
• Relationship between sender and receiver of unwanted digital communications
• Channel(s) that unwanted digital communications were received through
• Whether people’s online experiences are part of a wider issue happening offline
• Emotional and behavioural impacts of the experience
NEW ZEALANDERS’ EXPERIENCE OF UNWANTED DIGITAL COMMUNICATIONS
Almost a third of New Zealanders have experienced at least one type of unwanted digital
communication in the past year, with around 1 in 6 people having experienced more than one
type. However, the survey measures a broad range of online experiences, not all of which is
covered by the Harmful Digital Communications Act.
Q16. In the last 12 months, have you personally received an unwanted digital communication
(e.g. email, text, photo, video, or online comment) that…
Base: All respondents (1,018)
32Only 1 in 10 (9%) experienced an unwanted digital communication which had a negative
impact on their ability to perform daily activities. For those who haven’t personally
experienced an unwanted digital communication, 1 in 10 have witnessed an incident of this
happening to someone close to them.
Those over 60 are less likely to have experienced unwanted digital communications, but 12%
of those who haven’t personally experienced unwanted communications have witnessed such
an incident happening to someone close to them.
Q17. And in the last 12 months, have you seen or heard about an unwanted digital
communication (e.g. email, text, photo, video, or online comment) about someone you know
(friend, family or colleague)?
Base: All respondents (1,018)
33PROXIMITY TO SENDER OF UNWANTED DIGITAL COMMUNICATION
Half of unwanted digital communications are sent by a stranger or someone unknown to the
receiver, while only 1 in 5 unwanted communications come from someone the receiver knows
well.
Those under 30 are more likely to be sent unwanted digital communications by an
acquaintance, while those aged between 30 and 40 tend to have been sent such
communications by a friend. Pacific people are particularly likely to know the sender very well.
Q18. Who was the person that sent this communication?
Base: Respondents at least one incident of unwanted digital communications in the last year (337)
34Q18.a And how well do you know the person that sent this communication?
Base: All respondents (1,018)
CHANNELS FOR UNWANTED COMMUNICATIONS AND CONNECTION TO OFFLINE EVENTS
Unwanted digital communications are most commonly sent by email, followed by posts on
social media. These communications tend to be confined to online interactions with about 1 in
5 connected to a wider issue that was happening offline.
Q19. Where did this experience of harmful digital communication occur?
Base: Respondents experiencing at least one incident of unwanted digital communications in the last year (337)
35Q20. And was this experience part of a wider issue that was happening offline? By offline we
mean in a physical environment, such as through face-to-face interactions.
Base: Respondents experiencing at least one incident of unwanted digital communications in the last year (337)
IMPACT OF UNWANTED DIGITAL COMMUNICATIONS
In a third of cases unwanted digital communications did not have a negative emotional impact.
Further, 7 in 10 cases did not negatively affect a person’s ability to do everyday activities.
Those under 30 more commonly describe their emotional reaction as feeling insecure, lonely
or excluded, while males more frequently say they were not affected.
Q21. Which of the following describes your emotional reaction to this experience?
Base: Respondents experiencing at least
one incident of unwanted digital communications in the last year (337)
36Q22. As a result of this experience, what was the impact on daily life?
71% were not negatively
affected by the unwanted
digital communication.
Base: Respondents experiencing at least one incident of unwanted digital communications in the last year (337)
The most impact was experienced from receiving communications that:
• tried to get you to hurt yourself (21% experienced no negative impact);
• shared intimate images or recordings of you without your permission (26%); or
• came from people that had been encouraged by someone else to try to harm you
(27%).
The least impact was experienced by communications that:
• were just one of many unwanted communications received from the same person
(67% experienced no negative impact);
• included violent or sexual content that was indecent or obscure (65%);
• made an unwanted sexual advance (63%); or
• said offensive things about you, your lifestyle or personal beliefs (55%).
37Accessing support services
FOCUS OF INQUIRY
1. The types of responses that people have to receiving unwanted digital communications
2. How effective their responses were in mitigating the impact of the situation
3. Which support services did people access and how effective they were
4. The support services that people may consider using in future
RELATIONSHIP BETWEEN RESPONSES TO UNWANTED DIGITAL COMMUNICATIONS AND
PERCEIVED EFFECTIVENESS
The most common response to receiving an unwanted digital communication is to either
ignore the situation or to block the person responsible. Of those who did not ignore the
situation, 6 in 10 considered their response to have effectively changed the situation.
Q23. How did you respond to this experience in order to change the situation?
Base: Respondents experiencing at least one incident of unwanted digital communications in the last year (337)
38Q24. And, overall, how effective was your response(s) at changing the situation?
Responses tended to be perceived
as ineffective because it is hard to
change others’ online behaviour or
the content was still visible to others.
Base: Respondents experiencing an unwanted digital communication and did not ignore the situation (224).
“Facebook's community standards are very loose - very little that is detrimental to people
is taken seriously."
Female, 18 – 29 years, NZ European/Pacific, Reported the person responsible to the website
or online service
“I didn't want to go to the level of changing emails or phone numbers to avoid being
contacted."
Male, 18 – 29 years, NZ European, Withdrew from the site, social media, or online forum
“Kept getting emails of a similar nature from different email addresses."
Female, 40 – 49 years, Māori, Unfriended or blocked the person responsible
“Can't change people or stop them from finding alternative ways to harm you."
Male, 40 – 49 years, Asian, Changed username or deleted profile and unfriended or blocked
the person responsible
"To an extent the people who write these emails believe what they are writing to be true."
Male, 50 – 59 years, NZ European, Confronted the person online and reported the problem to
law enforcement
39USE OF SUPPORT SERVICES
Most of those who have experienced unwanted digital communications do not involve support
services (82% did not contact a support service). Those who have sought support in the last
year tend to have contacted an internet service provider or platform to remove the content,
block the person responsible or make others aware of the issue.
Q25 Did you contact any of the following services in order to help you? Which of the following
did you rely on as your main source of help or support?
Base: Respondents experiencing at least one incident of unwanted digital communications in the last year (337)
* 14% also sought help from family, friends, mental health services and general computer
support services.
Q26. Please describe your reasons for choosing to contact the support service.
40Base: Respondents who had used a support service to help them (62)
Q27 And how helpful was the support you received? In your own words, could you explain
why the support you received was not helpful?
Base: Respondents who
had used a support service to
help them (62)
41"They said the comment did not go against their policy." Female, 18 – 29 years, NZ European. Sought help from an Internet service provider/platform after someone said offensive things about them, their lifestyle or religious or political beliefs “The response was that the content was already removed. No response about them contacting the person responsible." Female, 30 – 39 years, NZ European. Sought help from an Internet service provider/platform after seeing violent or sexual content that was indecent or obscene “They did not seem to know what could be done." Female, 60 – 69 years, Māori. Sought help from a lawyer after someone “maligned their reputation” “He gets talked to by police and then retaliates." Female, 60 – 69 years, NZ European. Sought help from police due to being excluded from a peer or friendship group "No feedback or action was taken even though evidence was provided." Male, 40 – 49 years, NZ European. Sought help from an Internet service provider/platform after someone made a false allegation about their personal or professional life FUTURE CONSIDERATION (FOR THOSE WHO HAVE NOT EXPERIENCED UNWANTED COMMUNICATIONS) Those who had not experienced unwanted digital communications were asked who they would turn to for help if they received an unwanted online message in the future. The police are considered the primary source of support for dealing with unwanted digital communications, with more than a quarter considering the police to be the first port of call. The police are considered the primary source of support when dealing with intimate images being shared online without permission. Internet service providers are considered most helpful in removing online content, while telecommunications support is thought to be more useful when being stalked online. Most people say they would not seek any help when excluded by a peer group. 42
Q28 Imagine that you received an unwanted online message. Who would you turn to for help?
And who would you turn to for help first?

 Base: All respondents, excluding those personally experiencing each type of unwanted digital communications in
                                                                                              the last year (1,011)

43
Conclusion This report has presented the main findings of a nationally representative study about the experiences, attitudes, and behaviours of New Zealand adults regarding new technologies and digital communications. The study is the first conducted in the context of the Harmful Digital Communications Act 2015 and aims at gauging trends in the subsequent years. Similar to prior research (Smith et al., 2016), the findings confirm that adult New Zealanders are embracing digital technologies, particularly mobile tools, to support a range of everyday activities such as shopping, learning, entertaining and socialising. Similarly, New Zealanders regard themselves as confident users of technology. As they mainly connect online through smartphones and laptops, New Zealanders are actively participating in what Rainie and Wellman (2012) call the mobile revolution. However, there is still a need to provide them with resources and services to manage online challenges and potential risks. The findings show that most New Zealanders think that the best way to be safe online is through protective software, which suggests that other forms of non-technical behavioural change might still need to be encouraged. An interesting finding is that the majority of New Zealanders are aware of some aspects of the legislation around digital communications such as the courts’ ability to order the removal of harmful content and the illegality of posting online content that deliberately causes someone harm. This reported level of awareness regarding New Zealand legislation is promising. Also, while most New Zealanders were not familiar with the specifics of the communication principles in the Act, their views of what behaviour is important online is generally well aligned with them. For example, they particularly agreed that digital communication should not encourage someone to harm themselves, share intimate images of someone without their permission, or include indecent or obscene content. While the study did not explore in detail the drivers of these results, the findings do provide us with clues to explain them. For instance, adult New Zealanders’ interest in knowing about online safety (e.g. 70% of participants have taken actions to avoid online risks and harm). In addition, outside of this report factors such as media attention to individual cases of harmful and risky experiences online might have played a role. The most important findings regard the impact of digital communications, which are diverse and complex. The study explored experiences with unwanted digital communications: an umbrella term encompassing a range of digital communications that are unsolicited and may or may not cause harm or distress. They include a broad range of experiences such as receiving spam, excluding someone from an online group, or being threated or intimidated. The findings reveal that nearly a third of respondents have experienced at least one type of unwanted digital communication in the last 12 months. The study also found that 9% of adult New Zealanders said they were negatively affected by unwanted digital communications to the extent of being unable to perform daily activities such as participating online as usual and sleeping or eating properly, reflecting the seriousness of some of the events reported. In addition, those negatively affected by digital communications were mainly unable to participate online in the way they usually did and were unable to eat or sleep properly. The findings also show that most New Zealanders experience a range of emotional reactions 44
when faced with unwanted digital communications which include being angry, frustrated,
distressed, or embarrassed, among others. Thus, while public attention has focused on young
people, it seems easy to forget that adults can also be affected by digital communications,
sometimes with devastating outcomes. The APS provides researchers, policy makers, and the
general public with up-to-date insights to understand the impact of unwanted digital
communications on adult New Zealanders.

As New Zealand legislation regarding digital communications is unique, it is not possible to
establish comparisons with international research particularly because of the different
methodological approaches and definitions used to study people’s experiences with
unwanted and harmful online behaviours. Another reason that makes it difficult to compare
findings is that research has focused on specific aspects such as cyberbullying and/or online
harassment. In addition, people’s experiences of digital communications, and personal
understanding of what counts as harmful or distressing in the online environment, can differ
from one person to another. Recent international research (Smith & Duggan, 2018) supports
this point, finding that people are divided over certain behaviours constituting online
harassment while agreeing about others.

45
References
Bates, S. (2017). Revenge porn and mental health. Feminist Criminology, 12(1), 22–42.
    https://doi.org/10.1177/1557085116654565

Boyd, D. (2014). It’s complicated: The social lives of networked teens. New Haven: Yale
    University Press.

Crothers, C., Smith, P., Urale, P. W. B., & Bell, A. (2016). World Internet Project New Zealand.
     The internet in New Zealand in 2015. Retrieved from
     http://icdc.aut.ac.nz/__data/assets/pdf_file/0003/635835/WIPNZ-Report-060515.pdf

Fenaughty, J., & Harré, N. (2013). Factors associated with distressing electronic harassment
    and cyberbullying. Computers in Human Behavior, 29(3), 803–811. Retrieved from
    http://linkinghub.elsevier.com/retrieve/pii/S0747563212003135

Harmful Digital Communications Act (2015). Retrieved from
    http://www.legislation.govt.nz/act/public/2015/0063/latest/whole.html

Henry, N., Powell, A., & Flynn, A. (2017). Not just “Revenge Pornography”: Australians’
    experiences of image-based abuse: A summary report. Retrieved May 30, 2017, from
    https://www.rmit.edu.au/content/dam/rmit/documents/college-of-design-and-social-
    context/schools/global-urban-and-social-studies/revenge_porn_report_2017.pdf

Jose, P. E., Kljakovic, M., Scheib, E., & Notter, O. (2012). The joint development of traditional
    bullying and victimization with cyber bullying and victimization in adolescence. Journal of
    Research on Adolescence, 22(2), 301–309. https://doi.org/10.1111/j.1532-
    7795.2011.00764.x

Law Commission. (2012). Harmful digital communications: The adequacy of the current
    sanctions and remedies. Wellington. Retrieved from
    http://www.lawcom.govt.nz/sites/default/files/projectAvailableFormats/NZLC MB3.pdf

Livingstone, S., Haddon, L., Görzig, A., & Ólafsson, K. (2011). Risks and safety on the internet:
     The perspective of European children: Full findings and policy implications from the EU
     Kids Online survey of 9-16 year olds and their parents in 25 countries. Retrieved
     September 5, 2017, from http://eprints.lse.ac.uk/33731/

Marsh, L., McGee, R., Nada-Raja, S., & Williams, S. (2010). Brief report: Text bullying and
    traditional bullying among New Zealand secondary school students. Journal of
    Adolescence, 33(1), 237–240. https://doi.org/10.1016/j.adolescence.2009.06.001
Ministry for Women. (2017). Insights into digital harm: The online lives of New Zealand girls and
     boys. Ministry for Women. Wellington, New Zealand. Retrieved from
     http://women.govt.nz/documents/insights-digital-harm-online-lives-new-zealand-girls-and-
     boys

Netsafe. (2017). Teens and “sexting” in New Zealand: Prevalence and attitudes. Wellington,
    New zealand. Retrieved from https://www.netsafe.org.nz/wp-
    content/uploads/2017/12/SEXTING-NZ-Report-Dec-7-2017.pdf

Office of Film and Literature Classification. (2017). Young New Zealanders viewing sexual
     violence. Office of Film and Literature Classification. Wellington, New Zealand. Retrieved
     from https://www.classificationoffice.govt.nz/assets/PDFs/report-yp-sv-stage-3-2017.pdf

46
Pew Research Center. (2014). Online Harrassment. Retrieved March 20, 2017, from
http://www.pewinternet.org/2014/10/22/online-harassment/
Pew Research Center. (2017). Online Harassment 2017. Retrieved August 28, 2017, from
http://www.pewinternet.org/2017/07/11/online-harassment-2017/
Powell, A., & Henry, N. (2014). Digital harassment and abuse of adult Australians. Retrieved
April 5, 2017, from https://research.techandme.com.au/wp-
content/uploads/REPORT_AustraliansExperiencesofDigitalHarassmentandAbuse.pdf
Rainie, L., & Wellman, B. (2012). Networked: The new social operating system. Cambridge,
Massachusetts: MIT Press.
Raskauskas, J. (2009). Text-bullying: Associations with traditional bullying and depression
among New Zealand adolescents. Journal of School Violence, 9(1), 74–97. Retrieved from
http://www.tandfonline.com/doi/abs/10.1080/15388220903185605
Slonje, R., & Smith, P. K. (2008). Cyberbullying: Another main type of bullying? Scandinavian
Journal of Psychology, 49(2), 147–154. https://doi.org/10.1111/j.1467-9450.2007.00611.x
Slonje, R., Smith, P. K., & Frisén, A. (2013). The nature of cyberbullying, and strategies for
prevention. Computers in Human Behavior, 29(1), 26–32.
https://doi.org/10.1016/J.CHB.2012.05.024
Smith, A., & Duggan, M. (2018). Online harassment: What Americans consider crossing the line.
Retrieved January 8, 2018, from http://www.pewinternet.org/2018/01/04/crossing-the-line-
what-counts-as-online-harassment/
Smith, P., Bell, A., Miller, M., & Crothers, C. (2016). Internet trends in New Zealand 2007-2015.
Retrieved September 1, 2017, from
https://workresearch.aut.ac.nz/__data/assets/pdf_file/0004/71329/WIPNZtrends-07-
15.pdf
Snyman, R., & Loh, J. (2015). Cyberbullying at work: The mediating role of optimism between
cyberbullying and job outcomes. Computers in Human Behavior, 53, 161–168. Retrieved
from http://www.sciencedirect.com/science/article/pii/S0747563215300108
Starkey, L., Sylvester, A., & Johnstone, D. (2017). Negotiating digital divides: Perspectives from
the New Zealand schooling System. Journal of Research on Technology in Education,
49(1–2), 31–42. https://doi.org/10.1080/15391523.2017.1292161
Statistics New Zealand. (2013). Household use of information and communication technology:
2012. Retrieved September 4, 2017, from
http://archive.stats.govt.nz/browse_for_stats/industry_sectors/information_technology_a
nd_communications/HouseholdUseofICT_HOTP2012.aspx
Steiner-Fox, H. W., Dutt, S. J., Christiansen, S. J., Newton, H. J., Matika, C. M., Lindsay, C., …
Stronge, S. (2016). Rates of cyberbullying among women and men in New Zealand in
2015. Retrieved February 21, 2017, from
https://cdn.auckland.ac.nz/assets/psych/about/our-research/nzavs/Feedback
Reports/NZAVS-Policy-Brief-Rate-of-Cyber-Bullying.pdf
Symantec. (2016). Norton study shows online harassment at epidemic proportions for young
New Zealand women. Retrieved February 21, 2017, from
https://www.symantec.com/en/au/about/newsroom/press-
releases/2016/symantec_0720_01
47You can also read