Demographic and psychographic drivers of public acceptance of novel invasive pest control technologies
←
→
Page content transcription
If your browser does not render page correctly, please read the page content below
Copyright © 2021 by the author(s). Published here under license by the Resilience Alliance.
Eppink, F., P. Walsh, and E. MacDonald. 2021. Demographic and psychographic drivers of public acceptance of novel invasive pest
control technologies. Ecology and Society 26(1):31. https://doi.org/10.5751/ES-12301-260131

Research

Demographic and psychographic drivers of public acceptance of novel
invasive pest control technologies
Florian Eppink 1, Patrick J. Walsh 2 and Edith MacDonald 3

ABSTRACT. Invasive mammals are a primary threat to New Zealand’s endemic species. In remote areas, aerial delivery of poison is
the preferred method of pest management, although it faces some public backlash. Novel pest control technologies are currently being
investigated as alternatives but may face similar concerns. To investigate potential social and demographic determinants of public
perceptions of new methods for pest control, we conducted a national choice experiment, focused on several novel technologies: gene
drives, Trojan females, and species-specific poisons. We found that preferences strongly depend on the type of technology, with Trojan
female technology strictly preferred to the other two. Although several characteristics affected preferences in predictable ways—
education, trust in science, and liberal political leaning increased acceptance—the same did not hold with preferences for aerial delivery.
Our results are useful for targeting future engagement campaigns and leveraging existing efforts.
Key Words: choice experiment; genetic editing; invasive species; mixed logit; pest control

INTRODUCTION                                                              dogs, and stoats (Murphy et al. 2007). Ideally, a new toxin targets
New Zealand has some of the most unique endemic species in the            only the desired pest. The wasp toxin Vespex is lethal to wasps
world and the highest proportion of species at risk of extinction         but safe for birds, mammals, and honey bees (Edwards et al. 2018).
(MfE 2019). There are 168 native bird species in New Zealand,
with the kiwi (Apteryx spp.) being the most famous of the                 Genetics-based pest control technologies involve the
approximately 100 endemic species. Four out of five bird species          modification, replacement, or deletion of genetic material
are threatened by invasive pests (PCE 2017). Large swathes of             through an artificial process (Royal Society 2017). Gene drives
New Zealand are inaccessible, where spreading poison by hand              are one approach to achieving this at scale. These rely on releasing
is not possible. The safest and most cost-effective way to control        large numbers of edited organisms that have a high chance of
invasive pests is aerial delivery of the poison sodium fluoroacetate,     propagating their man-made genetic deficiencies (Webber et al.
or “1080” (ERMA 2007, PCE 2011, 2013). However, this method               2015, Courtier-Orgogozo et al. 2017). Examples of such
of invasive pest control cannot be scaled up sufficiently to mitigate     deficiencies are a lethal allele (Schliekelman and Gould 2000) or
the enormous pressure from invasive species on New Zealand’s              a skew in offspring sex ratios (Buchman et al. 2018). A variant
biodiversity, indicating a need to develop novel pest control             that is also being explored are Trojan females, where female
technologies (Russell et al. 2015, Eason et al. 2017). We present         organisms are genetically altered such that their male offspring
a study on public acceptance of novel technologies.                       have reduced fertility (Wolff et al. 2017).
Many new species have been introduced to New Zealand’s                    Novel technologies are often met with public apprehension (e.g.,
ecosystem. Certain non-native species such as feral pigs, various         Akin et al. 2017). An important concern identified among the
deer species, the Himalayan tahr, and Chamois adversely affect            New Zealand public is that technology is advancing faster than
native biodiversity but are valued as quarry. Other invasive species      our ability to anticipate the risks of its use (Wilkinson et al. 2000,
are unambiguously seen as pests. Wasp densities can be so high            Wilkinson and Fitzgerald 2014). Kirk et al. (2019) found that
that wasps compete with indigenous birds and insects for                  discussions with New Zealand focus groups were dominated by
honeydew and similar foods (e.g., MacIntyre and Hellstrom                 perceived risks despite awareness of the potential benefits of novel
2015). Both ship (Rattus rattus) and Norway (R. norvegicus) rats          pest control technologies.
are competitors (seeds, fruits) and predators (eggs, chicks) of
                                                                          The introduction of novel technologies needs to be handled
indigenous birds, lizards, insects, and snails (Innes 1990). Stoats
                                                                          carefully to allay potential public resistance (Goldson et al. 2015)
(Mustela erminea) are one of the largest threats to New Zealand’s
                                                                          and overcome ideological interpretation or dismissal of scientific
native bird populations. They switch to native birds when
                                                                          information (e.g., Ho et al. 2008, Bain et al. 2012, Milfont et al.
mammalian prey (mice and rats) become scarce in periodic
                                                                          2015). Otherwise, the public may withhold its social license for
population cycles (Jones et al. 2011).
                                                                          the use of novel pest control technologies (Wilkinson et al. 2000,
Technologies promising larger scale and enduring pest                     Duckworth et al. 2006, Dearden et al. 2017; P. Gluckman 2017,
suppression are on the horizon. For instance, new toxins are being        unpublished manuscript, https://www.pmcsa.org.nz/wp-content/
developed to control invasive species such as teleost fishes              uploads/Discussion-of-Social-Licence.pdf), which may delay
(Sorensen and Stacey 2004), wasps (Edwards et al. 2017), and              cost-effective pest suppression.
mammals such as feral pigs (Cowled et al. 2008), feral cats, wild

1
 Economic & Environmental Research, 2Manaaki Whenua Landcare Research, 3New Zealand National Science Challenge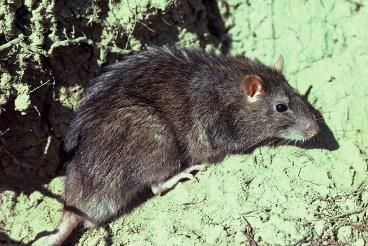
Ecology and Society 26(1): 31
                                                                                                         https://www.ecologyandsociety.org/vol26/iss1/art31/

Table 1. Description of demographic and psychometric variables.

Category              1                2                3                       4                         5                   6                    7
Age                 18-29             30-39           40-49                   50-59                      60-69               70+                   -
% of sample          14.1              16.3            16.8                    18.8                       19.3               14.7
Gender             Female             Male           Diverse                    -                          -                  -                    -
% of sample          55.1              44.6             0.3
Education           None           High school       Tertiary         Bachelor’s or higher                 -                  -                    -
% of sample           7.9               29             33.9                    29.2
Science         Strongly trust        Trust       Somewhat trust    Neither trust nor distrust     Somewhat distrust       Distrust        Strongly distrust
% of sample          1.17              3.15           10.04                   27.37                     35.26               19.03                3.99
Politics       Extremely liberal     Liberal     Somewhat liberal      Neither liberal nor       Somewhat conservative   Conservative   Extremely conservative
                                                                          conservative
% of sample         2.38              8.27            16.54                   43.68                      20.82               5.95                 2.37
Religion      No guidance at all       2                3            A moderate amount of                  5                   6        A great deal of guidance
                                                                            guidance
% of sample         43.37             14.67            7.39                   13.92                      6.61                5.15                8.89

This study presents the results of a national choice experiment on                  the indigenous inhabitants of New Zealand, were also
novel technologies to control wasps, rats, and stoats. It is one                    underrepresented but this was not unusual (e.g., Fink et al. 2011,
element of a larger survey[1] aimed at understanding the public’s                   Kypri et al. 2016).
perceptions of and attitudes toward pest control in the context of
                                                                                    Much of the larger survey asked respondents to self-report on
environmental conservation. The choice experiment focused on
                                                                                    various values and behaviors, henceforth referred to as
sociodemographic influences on preferences for specific aspects
                                                                                    “psychometrics.” The psychometric indicators used in this study
of novel pest control technologies, under the hypothesis that they
                                                                                    were expressed on a 7-point Likert scale. This balances response
are parallel to preferences for other novel science issues like
                                                                                    variability, accuracy, and respondents’ ability to easily identify
climate change. The results can be used to develop targeted
                                                                                    their position on a scale (e.g., Simms et al. 2019).
information campaigns as novel pest control technologies
approach operational readiness. Because New Zealand is a critical                   A subset of the psychometric indicators, shown in Table 1, was
hot spot for threatened endemic species and shares many                             used in the choice models: respondents’ belief in the
characteristics with other developed countries, it serves as an ideal               trustworthiness of scientists, their political leaning, and the degree
setting to investigate these issues.                                                of religious guidance in their daily lives. This selection was
                                                                                    inspired by studies by Ho et al. (2008), Bain et al. (2012), and
METHODS                                                                             Milfont et al. (2015), as well as a keynote address on novel pest
Respondent panel and survey development                                             control by New Zealand’s Chief Science Advisor, who pointed to
The choice experiment was administered to a representative                          trust in the involved actors, world views, and cultural values as
sample of 8200 respondents across New Zealand, representing                         important determinants of acquiring a social license for
the largest survey and choice experiment on the social acceptance                   technologies (P. Gluckman 2017, unpublished manuscript).
of novel pest control technologies in New Zealand to date. All                      Choice experiment and econometric analysis
respondents were members of the consumer panel of a leading                         Choice experiments help understand public preferences by asking
market research firm that has significant experience with social                    respondents to choose between different options (in this case,
research for the public sector. Using a reputable vendor of                         policies) with varying attributes. By evaluating bundles of
respondents rather than recruiting from crowdsourced online                         attributes for each choice, respondents make trade-offs and so
panels addressed concerns from an ongoing debate about the                          reveal their preferences, which can be analyzed using econometric
response quality of the latter (e.g., Smith et al. 2016, Hauser et                  choice models. In this study, each respondent was shown the same
al. 2019). Respondents in this study were awarded points in a                       sequence of nine choice tasks. Each choice task asked them to
national loyalty program. The points were redeemable for a range                    choose between two alternatives that showed a level of each
of commercially available goods and services upon completion of                     attribute of novel pest control technologies (illustrated in Tables
the survey. Offering such incentives is a common method among                       2 and 3). The presentation of the choice experiment is shown fully
commercial vendors for attracting and retaining panel members                       in Appendix 2.
with no discernable impact on response quality or survey outcome
(e.g., Göritz 2004, Spreen et al. 2019).                                            The alternatives in the choice tasks were identified only as “A”
                                                                                    and “B.” In each choice task, respondents were also offered an
Respondents provided demographic indicators, such as age,                           opt-out phrased as “I do not have a preference” (see Table 3). The
gender, and education, shown in Table 1. Comparison with the                        opt-out was selected in all nine choice tasks by 12.9% of
2013 Census (see Appendix I), which was the reference for the                       respondents. After verifying that the signs, magnitude, and
sample design, suggests the respondents were approximately                          significance of the estimated main parameters were largely
representative of the population of New Zealand. People aged 60                     unaffected, we removed this group from the sample. Their removal
and above were overrepresented, as were women and respondents                       noticeably improved model fit.
with tertiary or higher education. The Districts Canterbury,
Greater Wellington, and Waikato were underrepresented. Māori,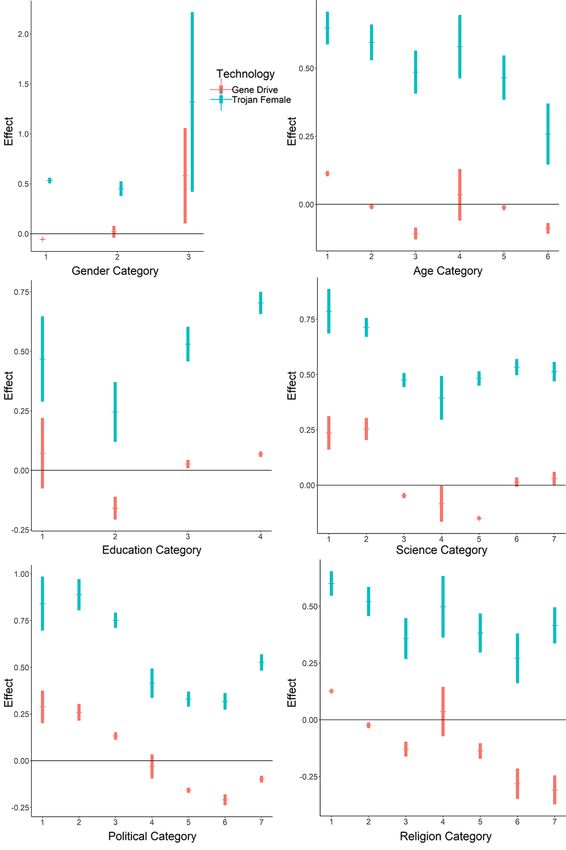
Ecology and Society 26(1): 31
                                                                                               https://www.ecologyandsociety.org/vol26/iss1/art31/

                                                                            likely to be selected compared to the reference level of the
Table 2. Attributes and levels in the choice experiment.                    attribute.
                                                                            Estimation of the multinomial logit (MNL) model developed by
Attribute          Levels
                                                                            McFadden (1974) assumes that everyone shares identical
Novel technology   New Poison, Gene Drive, Trojan Female                    preferences for attributes. Extending this simple model, Revelt
Target animal      Wasps, Rats, Stoats
Delivery method    Ground, Aerial                                           and Train (1998) presented the mixed logit (MIXL) model, which
Effect             Infertility, Death                                       allowed the diverse preferences of individuals to be estimated.
                                                                            Furthermore, the MIXL model enabled investigation of how
                                                                            individual preferences varied with individual characteristics,
                                                                            including demographics and psychometrics.
                                                                            Our analysis started with an MNL model of only the attributes
Table 3. Example of a choice task.
                                                                            of the pest control methods. We added model complexity in a
                                                                            stepwise fashion, starting with an MNL model with interactions
                              Option 1      Option 2      I do not have a
                                                                            between target species and pest control technologies and their
                                                             preference
                                                                            possible effects. This first extension aimed to determine whether
The new pest control         New Toxin      New Toxin
technique
                                                                            the New Zealand public perceived a pest control technology or
The animal the new              Rats         Wasps                          its effect differently for different target species, and whether the
technique would control                                                     model fit improved by including these interactions. We then
How the technique will      On the ground On the ground                     estimated a basic MIXL model and a MIXL model with the most
be delivered                                                                general error specification, as recommended by Hess and Rose
What happens to the           Infertility    Death
animal who interacts
                                                                            (2012). We assumed individual preferences to have a normal
with the new method                                                         distribution. This second extension aimed to determine whether
                                                                            estimating individual preferences improved model fit, and
                                                                            whether a more general specification of the MIXL model would
As the number of attributes and levels grows, experimental design           further improve the results. Finally, we included respondents’
quickly becomes challenging. It is more practical to use “efficient”        demographic and psychometric variables to identify any relation
choice experiment design procedures (Rose and Bliemer 2009).                to public preferences. This third extension was exploratory and
Typically, multiple candidate experimental designs are created,             aimed to find potentially effective avenues for targeted
which can be evaluated on several measures of efficiency, of which          communication.
so-called D-efficiency is commonly used. The experimental design
for the choice experiment in this study was created by the                  To assess whether more complex models also better explained
marketing research firm using Lighthouse Studio (version 9).                respondents’ choices, we employed a range of indicators. The Log
Multiple designs with high scores for D-efficiency were combined            Likelihood (LL) statistic is used to compare models, signaling
to display each level an approximately equal number of times.               improved model fit as the statistic moves toward 0. McFadden’s
                                                                            pseudo-R² is an approximation for choice models of R² in
Estimation of the choice model is derived from utility theory.              statistical analysis, where a value of 0.2-0.4 indicates adequate
McFadden (1974) posited that the utility function of an individual          model performance (McFadden 1974). The Akaike Information
consists of a deterministic and a random component:                         Criterion (AIC) and the Bayesian Information Criterion (BIC)
                                                                            are evaluation indicators that use the log likelihood and apply a
                                                                            penalty for adding explanatory variables to prevent overfitting.
        Uqit = βXqit + εqit                                 (1)
                                                                            Smaller values for AIC and BIC indicate better models. We used
                                                                            R (R Core Team 2018) and the gmnl package (Sarrias and Daziano
where Uqit is utility experienced by person q from alternative i on         2017) for model estimation and calculation of performance
occasion t, β is a vector of utility weights, and Xqit is the vector of     indicators.
attributes in alternative i observed by person q. Presented with a
choice, individuals are more likely to select one alternative over          We estimated four models to identify a preferred model
the other based on (a) the strength of their preferences for the            specification. Models 1 and 2 are MNL models (assuming
attributes inherent to the choice, (b) the attribute levels present in      homogenous preferences across all respondents) and the latter
each alternative in the choice, and (c) a random component εqit.            includes interactions to assess whether the target species affects
                                                                            public preferences for pest control technologies or their effects.
Choice models are developed by estimating β, the vector of utility          Models 3 and 4 are MIXL models that incorporate varying
weights, which indicate how each attribute and level contribute             preferences at the individual level. Model 4 uses a more general
to the likelihood of an alternative being selected, given the levels        estimation procedure than Model 3.
of all other attributes. Categorical attributes, which we use
exclusively in our model, must have a reference level for which no          To determine if and how public preferences were affected by
coefficient is estimated. This ensures the model is identified.             respondents’ demographic and psychometric characteristics, we
However, the likelihood of an alternative being selected is not             extended Model 4 to include their age, gender, education, belief
affected by the choice of reference level, which can therefore be           in the trustworthiness of scientists (henceforth “Science” for
set arbitrarily. The estimated utility weights of categorical               brevity), political leaning (“Politics”), and the degree of religious
attribute levels indicate whether an alternative was more or less           guidance in daily life (“Religion”). Respectively, these extensions
                                                                            are Models 5 to 10.
Ecology and Society 26(1): 31
https://www.ecologyandsociety.org/vol26/iss1/art31/
RESULTS demographic and psychometric characteristics. Figure 1 shows
the estimated preferences of the demographic and psychometric
Model results without demographic or psychometric variables groups (as shown in Table 1) for GD and TF compared to the
The MIXL Models 3 and 4 performed significantly better than reference technology NT. The graphs show the average preference
the MNL models on all model evaluation criteria (see Table 4). of each group with 95% confidence intervals. A positive effect
The LL was reduced from -64,505 to -54,295 (Model 3) and indicates preference for that technology over NT, while a negative
-53,015 (Model 4). McFadden’s pseudo-R² increased from 0.045 effect indicates that NT is preferred.
to 0.242 (Model 3) and 0.26 (Model 4). The AIC and BIC
decreased from over 125,000 to around 108,000 (Model 3) and
106,000 (Model 4). The improvements of Model 4 over Model 3 Fig. 1. Group-wise preference for Gene Drive and Trojan
indicated that the more general MIXL model produced the best Female over New Toxin. Group average with 95% confidence
fit (Likelihood Ratio test: p = 0, d.f. = 21) for the choice model interval. GD shown in red, TF in blue.
and was used to study the effect of demographic and psychometric
variables.
The estimated coefficients suggested the following preference
ordering for technologies: (1) Trojan Female (TF), (2) New Toxin
(NT), and (3) Gene Drive (GD). The relative preference for TF
was consistent across all models, while the relative preferences for
NT (the omitted reference level) and GD had inconsistent signs
and statistical significance.
Public preferences for target pest species were clear: positive and
significant coefficients indicated that rats and stoats were
preferred targets over wasps (the reference level). Across all
estimated models, the coefficient for rats indicated relatively
strong and stable preferences for this species as a target.
Ground-based delivery of novel pest technology was preferred to
aerial delivery (the reference level) with large, positive, and
significant coefficients across all models. As an outcome of novel
pest control technologies, death was preferred over infertility (the
omitted category) across all models. In all models, the estimated
coefficient for the opt-out (selecting neither alternative) option
was negative and significant.
Comparing Models 1 and 2 shows that including the interaction
between target species and pest control technology or its effects
did not improve the choice model. The Log Likelihood (LL) and
BIC worsened while the other evaluation criteria used did not
change. The estimated coefficients for the interaction effects were
nonsignificant except for the interaction between Gene Drive
(GD) and both rats and stoats. This possibly signaled that the
perceived threat of abundant rats and stoats alleviated the concern
about GD in general, which is discussed further below.
Demographic and psychometric variables and preferences for
novel pest control technologies
The estimated coefficients and model evaluation scores of Models
5–10 are comparable to Model 4, with a range of LL
improvements from 34 points for Model 10 (LR test p = 0.03, d. The inclusion of gender, in the top-left pane of Figure 1, suggested
f. = 42) to 142 points for Model 8 (LR test p = 0, d.f. = 42). The that females (1) and men (2) appeared to have only minor
AIC scores improve to various degrees but Models 5–10 tend to differences in preferences for novel pest control technologies.
score lower than Model 4 on the BIC because of the higher Gender diverse (3) respondents showed a stronger preference for
number of variables. The standard deviation of the random GD and TF over NT but the error margin of this result was high,
parameters in Models 5–10 tended to be lower than in Model 4. reflecting the small number of respondents that identified as
Including the demographic and psychometric characteristics of gender diverse.
respondents indeed explained a degree of preference variability. Shown in the top-right pane of Figure 1, there is a roughly negative
Considering the similarity of the results, Models 5–10 are not relationship between age and preferences for GD and TF over
discussed in detail here but shown in Appendix 3. NT. TF was consistently favored over NT, though this preference
The purpose of estimating Models 5–10 was to gain insights on became weaker among older respondents. In contrast, preferences
the relationship between preferences and respondents’ for GD over NT were strictly positive only for the youngest groupEcology and Society 26(1): 31
https://www.ecologyandsociety.org/vol26/iss1/art31/
Table 4. Estimated choice models without demographics and psychometrics. Coefficients are log odds ratios with standard errors shown
in parentheses. All variables are dummy-coded. Random parameters are assumed to have the normal distribution.†‡
MNL MIXL
Model 1 Model 2 Model 3 Model 4
Main effects Interaction Main effects Correlated
errors
Main effects
Gene Drive -0.0152 -0.0613 ** -0.0569 *** -0.0203
(0.014) (0.024) (0.019) (0.021)
Trojan Female 0.3312 *** 0.3307 *** 0.4453 *** 0.5035 ***
(0.018) (0.030) (0.025) (0.026)
Rat 0.2278 *** 0.2100 *** 0.3364 *** 0.3404 ***
(0.015) (0.031) (0.020) (0.021)
Stoat 0.1039 *** 0.0849 *** 0.1559 *** 0.1446 ***
(0.015) (0.031) (0.020) (0.022)
Ground 0.7581 *** 0.7494 *** 1.1788 *** 1.2889 ***
(0.013) (0.014) (0.021) (0.022)
Death 0.1227 *** 0.1486 *** 0.1499 *** 0.1506 ***
(0.012) (0.023) (0.017) (0.018)
Neither (Opt-out) -0.3294 *** -0.3483 *** -1.1456 *** -0.9550 ***
(0.018) (0.027) (0.031) (0.034)
Interaction terms
Gene Drive x Rat - 0.0663 * - -
(0.036)
Gene Drive x Stoat - 0.0906 ** - -
(0.037)
Trojan Female x Rat - -0.0268 - -
(0.046)
Trojan Female x Stoat - 0.0096 - -
(0.046)
Death x Rat - -0.0222 - -
(0.032)
Death x Stoat - -0.0490 - -
(0.032)
Standard deviation of random parameters
Gene Drive - 1.1430 *** 1.5369 ***
(0.027) (0.036)
Trojan Female - - 1.2330 *** 0.8360 ***
(0.041) (0.044)
Rat - - 0.2574 *** 0.7863 ***
(0.048) (0.040)
Stoat - - 0.3656 *** -0.1714 ***
(0.044) (0.045)
Ground - - 1.4340 *** 1.4829 ***
(0.025) (0.032)
Death - - 1.3233 *** 1.0686 ***
(0.027) (0.036)
Neither 2.3455 *** 2.2466 ***
(0.031) (0.031)
Observations 64,224 64,224 64,224 64,224
Log Likelihood -62,505 -64,499 -54,295 -53,015
2
McFadden pseudo-R 0.045 0.045 0.242 0.260
AIC 125,024 125,025 108,619 106,100
BIC 125,088 125,142 108,746 106,418
†
Coefficients are log odds ratios; Standard errors shown in parentheses; *** p < 0.01; ** p < 0.05; * p < 0.1.
‡
All variables are dummy-coded. Random parameters are assumed to have the normal distribution.
of respondents. Other age groups tended to prefer NT, though diplomas (2) had the lowest preference for GD and TF over NT.
respondents between 50–49 (category 4) showed a small positive Tertiary (3) and academic (4) education increased support for GD
average effect, with the confidence interval overlapping with zero. and TF. The preferences for GD and TF of respondents without
a high school diploma (1) were slightly stronger than high school
The effect of education levels on preferences is shown in the graduates but with a larger margin of error.
middle-left pane of Figure 1. Respondents with high schoolEcology and Society 26(1): 31
https://www.ecologyandsociety.org/vol26/iss1/art31/
The middle-right pane of Figure 1 suggests that, as respondents’ targets over wasps. This result may reflect that the New Zealand
trust in scientists diminished, preferences for GD and TF over public has long been informed about rats, which have negative
NT became less strong. Preferences for TF over NT were impacts outside of biodiversity conservation, and stoats.
consistently positive for all Science groups but not for GD. The However, high densities of wasps are mostly found in the
respondents that expressed some or no (dis)trust (3–5) in scientists honeydew beech forests at the top of New Zealand’s South Island.
were less supportive than even those that reported a strong distrust As such, our result may not reflect the preference of New
of scientists. Zealanders living near these forests for target species. A general
question about the perceived threat of each pest (Appendix 4)
The preferences of the political and religious groups are shown
indicates most people do not see wasps as much of a serious threat
in the bottom-left and right panes of Figure 1, respectively. Both
as rats or stoats. This suggests that public acceptance of novel
groups exhibited weakening preferences for GD and TF as
pest control technologies could be facilitated by widely
respondents indicated they were more conservative and more
emphasizing the environmental impacts of pest species in a
religious, although TF was consistently preferred over NT.
sustained campaign.
Preferences for GD were split down political lines, with
respondents who self-reported as being politically liberal Ground-based delivery of novel pest control technologies was
preferring GD whereas those with conservative political preferred to aerial delivery. This aligned with ongoing distrust of
tendencies preferred NT. A similar relationship appeared for the aerial delivery of the poison 1080 in New Zealand (e.g., Green
religious groups, although respondents that reported a moderate and Rohan 2012), although we found politics and age do affect
amount of religious guidance in their daily lives (4) displayed a preferences. Further research would be needed to identify, for
positive preference with a larger error margin. instance, whether a rural-urban divide exists or if respondents’
own experiences with aerial 1080 operations affect their
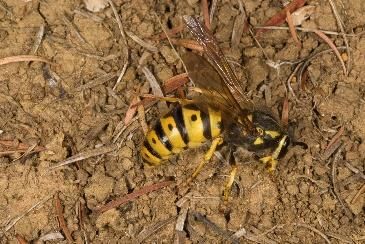
We also identified interactions of demographics with preferences
preferences. Future communication campaigns for novel pest
for ground and air delivery of pest control. The graph on the left
control technologies could emphasize how the perceived risks of
of Figure 2 shows political interactions. Groups 2–7 show a
these technologies would be mitigated.
declining preference for ground as they become more conservative
and less liberal. However, extreme liberals have a much lower Respondents preferred death to infertility. This result may have
preference for ground than all other groups besides extreme been particular to New Zealand, which has historically relied on
conservatives. The graph on the right shows the impact of age on exterminating pest species. Even peri-urban parks with valued
preferences for ground-based delivery. Middle-aged respondents biodiversity typically have signs warning visitors about various
had the strongest preference for ground delivery, while older and poisons used to kill pests. These experiences may have caused the
younger groups had much weaker preferences. respondents to see death as a more effective outcome of pest
control technology, or at least desensitized them. Further research
Fig. 2. Group-wise preference for ground-based deployment could confirm whether the New Zealand public actively dislikes
with 95% confidence interval. infertility as an effect of pest control technology or whether it
simply is comfortable with eradicating pests. Moreover, similar
studies in other countries could confirm whether the welfare of
pest species more widely is a minor issue for pest control
campaigns.
Across all 10 estimated models, we found that preferences for
novel technology are strongly dependent on the technology itself,
so that it is not just the novelty that drives people’s preferences.
Although Gene Drive and Trojan Female are both novel
technologies, our results indicate that people had a consistent
preference for the Trojan Female approach over a New (species-
specific) Toxin, while preferences for Gene Drive and New Toxin
were less clear. Respondents were informed that Gene Drive
involved the release of large numbers of modified organisms,
whereas Trojan Female required a small number. We speculate
that respondents expressed the perceived risk of “swarms” of
DISCUSSION
modified fauna released into New Zealand’s unique and sensitive
The estimated choice models provided information about the
environment in their choices. This concern has been repeatedly
preferences of the New Zealand public for novel pest control
identified among New Zealanders (Wilkinson et al. 2000,
technologies, their characteristics, and a few demographic and
Wilkinson and Fitzgerald 2014, Kirk et al. 2019).
psychometric variables that correlated with public preferences.
These insights could inform communication campaigns when Our models also investigated how preferences might be affected
novel technologies become available in the near and medium term by respondents’ demographic and psychometric traits. People
but also highlighted aspects of pest control that could be useful who had more trust in scientists, were more politically liberal,
in the present. were more secular, or had attained a higher level of education,
had a comparatively high acceptance of genetic pest control
Our models indicated that the target of novel pest control
technology over new toxins. These results suggested that
technology matters. Stoats and particularly rats were favored
acceptance of these technologies may have been value driven.Ecology and Society 26(1): 31
https://www.ecologyandsociety.org/vol26/iss1/art31/
Such prominence of values in accepting science-based facts and of pest control methods, would acceptance be equally high if a
technologies has also been identified in discussions about climate technology promises reduced fertility? Is there a number of
change (e.g., Bain et al. 2012, Milfont et al. 2015) and stem cell genetically modified organisms released into the environment
research (Ho et al. 2008). Groups representing the middle of these beyond which the public expresses a nonlinear change in
traits had more diverse preferences than the more extreme groups, acceptance of the technology? Using larger, more targeted
suggesting that “the middle” could be a productive target for samples across demographic and psychometric traits could
communication campaigns to introduce genetic pest control improve our understanding of their impact on preferences and
technologies. acceptance of novel pest control technologies.
Discussing pest control specifically, Russell and Blackburn (2017) __________
note that values can confound scientific discussions and that [1]
For additional information about the overall project and the
public debates should accommodate facts as well as perceived
Bioheritage National Science Challenge, see http://www.
pros and cons. Our results appear to bear this conclusion out as
bioheritage.nz/
groups representing the extremes of age, trust in scientists, and
religiosity scales appeared to have well-defined preferences
compared to those in the middle. Responses to this article can be read online at:
https://www.ecologyandsociety.org/issues/responses.
CONCLUSION
In this article we present the results of a large, national-level choice php/12301
experiment in New Zealand about preferences for novel pest
control technologies. In a choice experiment, respondents
evaluate bundles of different technologies and their attributes,
enabling analysis of the trade-offs between attributes in Data Availability:
respondents’ choices. This allows for a more detailed look into
their preferences than asking respondents about these attributes The full survey and the data about public opinions and beliefs
separately and sequentially. The results provide information for supporting the study are available from the New Zealand’s
communication campaigns about new and future pest control Biological Heritage National Science Challenge data repository.
technologies. Survey link: https://data.bioheritage.nz/dataset/survey-data-attitudes-
novel-pest-control Public opinion data link: https://data.
The survey focused on three novel technologies for pest control: bioheritage.nz/dataset/public-opinion-pest-control-methods The data
Gene Drives, Trojan Females, and a New (species-specific) Toxin. from the choice experiment will be provided upon request to the
We used several econometric models to analyze the responses, corresponding author and will be added to the repository in the near
including multinomial logit models and mixed logit models. The future.
models also included demographic (age, gender, education) and
psychometric (trust in scientists, political leaning, religiosity)
variables of the respondents. LITERATURE CITED
Akin, H., K. M. Rose, D. A. Scheufele, M. Simis-Wilkinson, D.
Our results provide several insights for communication campaigns
Brossard, M. A. Xenos, and E. A. Corley. 2017. Mapping the
about the use of novel pest control technologies as they become
landscape of public attitudes on synthetic biology. BioScience 67
operational. First, the respondents strongly preferred novel
(3):290-300. https://doi.org/10.1093/biosci/biw171
technology over opting out of a choice. This signaled a general
openness to pest control technologies even in the face of perceived Bain, P. G., M. J. Hornsey, R. Bongiorno, and C. Jeffries. 2012.
risks. Second, the comparative indifference to wasps suggested Promoting pro-environmental action in climate change deniers.
that the public acceptance of novel pest control technology could Nature Climate Change 2(8):600-603. https://doi.org/10.1038/
benefit from widespread and sustained messaging of the negative nclimate1532
impacts of the target species. Third, any new technology relying
Buchman, A., J. M. Marshall, D. Ostrovski, T. Yang, and O. S.
on aerial delivery may face public resistance simply because of
Akbari. 2018. Synthetically engineered Medea gene drive system
the legacy of the 1080 debate. Fourth, widespread acceptance of
in the worldwide crop pest Drosophila suzukii. Proceedings of the
novel genetic pest control technologies may hinge on effective
National Academy of Sciences 115(18):4725-4730. https://doi.
communication with “the middle,” who as a group are
org/10.1073/pnas.1713139115
comparatively undecided about their views of these technologies.
Finally, because it will take time for technologies to become Courtier-Orgogozo, V., B. Morizot, and C. Boëte. 2017.
operational, it will be important to recognize that preferences may Agricultural pest control with CRISPR-based gene drive: time
shift as people grow older and change. Early communication for public debate. EMBO Reports 18(6):878-880. https://doi.
targeting younger adults might help entrench positive views of org/10.15252/embr.201744205
future technologies that persist when the technology becomes
Cowled, B. D., P. Elsworth, and S. J. Lapidge. 2008. Additional
operational and these adults are older.
toxins for feral pig (Sus scrofa) control: identifying and testing
Further research can provide more insight into how Achilles’ heels. Wildlife Research 35(7):651-662. https://doi.
communication campaigns might be finessed for effective org/10.1071/WR07072
messaging leading to acceptance of novel pest control
Dearden, P. K., N. J. Gemmell, O. R. Mercier, P. J. Lester, M. J.
technologies. For instance, with death being a preferred outcome
Scott, R. D. Newcomb, T. R. Buckley, J. M. E. Jacobs, S. G.Ecology and Society 26(1): 31
https://www.ecologyandsociety.org/vol26/iss1/art31/
Goldson, and D. R. Penman. 2017. The potential for the use of Ho, S. S., D. Brossard, and D. A. Scheufele. 2008. Effects of value
gene drives for pest control in New Zealand: a perspective. Journal predispositions, mass media use, and knowledge on public
of the Royal Society of New Zealand 48(4):225-244. https://doi. attitudes toward embryonic stem cell research. International
org/10.1080/03036758.2017.1385030 Journal of Public Opinion Research 20(2):171-192. https://doi.
org/10.1093/ijpor/edn017
Duckworth, J. A., A. E. Byrom, P. Fisher, and C. Horn. 2006. Pest
control: does the answer lie in new biotechnologies? Pages 421-434 Innes, J. G. 1990. Ship rat. Pages 206-225 in C. M. King, editor.
in R. B. Allen and W. G. Lee, editors. Biological invasions in New The handbook of New Zealand mammals. Oxford University Press,
Zealand. Springer, Berlin, Germany. https://doi.org/10.1007/3-5 Auckland, New Zealand.
40-30023-6_27
Jones, C., R. Pech, G. Forrester, C. M. King, and E. C. Murphy.
Eason, C. T., L. Shapiro, S. Ogilvie, C. King, and M. Clout. 2017. 2011. Functional responses of an invasive top predator Mustela
Trends in the development of mammalian pest control technology erminea to invasive meso-predators Rattus rattus and Mus
in New Zealand. New Zealand Journal of Zoology 44(4):267-304. musculus, in New Zealand forests. Wildlife Research 38
https://doi.org/10.1080/03014223.2017.1337645 (2):131-140. https://doi.org/10.1071/WR10137
Edwards, E., R. Toft, N. Joice, and I. Westbrooke. 2017. The Kirk, N., R. Kannemeyer, A. Greenaway, E. MacDonald, and D.
efficacy of Vespex® wasp bait to control Vespula species Stronge. 2019. Understanding attitudes on new technologies to
(Hymenoptera: Vespidae) in New Zealand. International Journal manage invasive species. Pacific Conservation Biology 26(1):35-44.
of Pest Management 63(3):266-272. https://doi.org/10.1080/096 https://doi.org/10.1071/PC18080
70874.2017.1308581
Kypri, K., B. Maclennan, and J. L. Connor. 2016. Effects of small
Edwards, E. D., E. F. Woolly, R. M. McLellan, and R. A. Keyzers. incentives on survey response fractions: randomised comparisons
2018. Non-detection of honeybee hive contamination following in national alcohol surveys conducted in New Zealand. European
Vespula wasp baiting with protein containing fipronil. PLoS ONE Journal of Public Health 26(3):430-432. https://doi.org/10.1093/
13(10):e0206385. https://doi.org/10.1371/journal.pone.0206385 eurpub/ckw035
Environmental Risk Management Authority (ERMA). 2007. MacIntyre, P., and J. Hellstrom. 2015. An evaluation of the costs
Reassessment of sodium fluoroacetate (1080) and formulated of pest wasps (Vespula species) in New Zealand. Department of
substances containing 1080 (a vertebrate toxin) by a committee of Conservation and Ministry for Primary Industries, Wellington,
the Environmental Risk Management Authority. ERMA, New Zealand.
Wellington, New Zealand.
McFadden, D. 1974. Conditional logit analysis of qualitative
Fink, J. W., S.-J. Paine, P. H. Gander, R. B. Harris, and G. Purdie. choice behavior. Pages 105-142 in P. Zarembka, editor. Frontiers
2011. Changing response rates from Māori and non-Māori in in econometrics. Academic, Cambridge, Massachusetts, USA.
national sleep health surveys. The New Zealand Medical Journal
Milfont, T. L., P. Milojev, L. M. Greaves, and C. G. Sibley. 2015.
124(1328):52-63.
Socio-structural and psychological foundations of climate change
Goldson, S. L., G. W. Bourdôt, E. G. Brockerhoff, A. E. Byrom, beliefs. New Zealand Journal of Psychology 44(1):17-30.
M. N. Clout, M. S. McGlone, W. A. Nelson, A. J. Popay, D. M.
Ministry for the Environment (MfE). 2019. Environment Aotearoa
Suckling, and M. D. Templeton. 2015. New Zealand pest
2019. Summary. MfE, Wellington, New Zealand.
management: current and future challenges. Journal of the Royal
Society of New Zealand 45(1):31-58. https://doi.org/10.1080/03 Murphy, E. C., C. T. Eason, S. Hix, and D. B. MacMorran. 2007.
036758.2014.1000343 Developing a new toxin for potential control of feral cats, stoats,
and wild dogs in New Zealand. USDA/APHIS/WS, National
Göritz, A. S. 2004. The impact of material incentives on response
Wildlife Research Center, Fort Collins, Colorado, USA.
quantity, response quality, sample composition, survey outcome
and cost in online access panels. International Journal of Market Parliamentary Commissioner for the Environment (PCE). 2011.
Research 46(3):327-345. https://doi.org/10.1177/147078530404600307 Evaluating the use of 1080: predators, poisons, and silent forests.
PCE, Wellington, New Zealand.
Green, W., and M. Rohan. 2012. Opposition to aerial 1080
Parliamentary Commissioner for the Environment (PCE). 2013.
poisoning for control of invasive mammals in New Zealand: risk
Evaluating the use of 1080: predators, poisons, and silent forests.
perceptions and agency responses. Journal of the Royal Society of
Update report. PCE, Wellington, New Zealand.
New Zealand 42(3):185-213. https://doi.org/10.1080/03036758.2011.556130
Parliamentary Commissioner for the Environment (PCE). 2017.
Hauser, D., G. Paolacci, and J. J. Chandler. 2019. Common Taonga of an island nation: saving New Zealand’s birds. PCE,
concerns with MTurk as a participant pool: evidence and Wellington, New Zealand.
solutions. Chapter 17 in F. R. Kardes, P. M. Herr, N. Schwarz,
R Core Team. 2018. R: A language and environment for statistical
editors. Handbook of research methods in consumer psychology.
computing. Vienna, Austria.
Routledge, New York, New York, USA. https://doi.
org/10.4324/9781351137713-17 Revelt, D., and K. Train. 1998. Mixed logit with repeated choices:
households’ choices of appliance efficiency level. Review of
Hess, S., and J. M. Rose. 2012. Can scale and coefficient
Economics and Statistics 80(4):647-657. https://doi.
heterogeneity be separated in random coefficients models?
org/10.1162/003465398557735
Transportation 39(6):1225-1239. https://doi.org/10.1007/s11116-012-9394-9Ecology and Society 26(1): 31
https://www.ecologyandsociety.org/vol26/iss1/art31/
Rose, J. M., and M. C. J. Bliemer. 2009. Constructing efficient Wolff, J. N., N. J. Gemmell, D. M. Tompkins, and D. K. Dowling.
stated choice experimental designs. Transport Reviews 29 2017. Introduction of a male-harming mitochondrial haplotype
(5):587-617. https://doi.org/10.1080/01441640902827623 via ‘Trojan Females’ achieves population suppression in fruit flies.
eLife 6:e23551. https://doi.org/10.7554/elife.23551
Royal Society. 2017. The use of gene editing to create gene drives
for pest control in New Zealand. Royal Society New Zealand Te
Aparangi - Gene Editing Panel, Wellington, New Zealand.
Russell, J. C., and T. M. Blackburn. 2017. The rise of invasive
species denialism. Trends in Ecology & Evolution 32(1):3-6. https://
doi.org/10.1016/j.tree.2016.10.012
Russell, J. C., J. G. Innes, P. H. Brown, and A. E. Byrom. 2015.
Predator-free New Zealand: conservation country. BioScience 65
(5):520-525. https://doi.org/10.1093/biosci/biv012
Sarrias, M., and R. Daziano. 2017. Multinomial logit models with
continuous and discrete individual heterogeneity in R: The gmnl
package. Journal of Statistical Software 79(2):1-46. https://doi.
org/10.18637/jss.v079.i02
Schliekelman, P., and F. Gould. 2000. Pest control by the
introduction of a conditional lethal trait on multiple loci:
potential, limitations, and optimal strategies. Journal of Economic
Entomology 93(6):1543-1565. https://doi.org/10.1603/0022-0493-93.6.1543
Simms, L. J., K. Zelazny, T. Williams, and L. Bernstein. 2019.
Does the number of response options matter? Psychometric
perspectives using personality questionnaire data. Psychological
Assessment 31(4):557-566. https://doi.org/10.1037/pas0000648
Smith, S. M., C. A. Roster, L. L. Golden, and G. S. Albaum. 2016.
A multi-group analysis of online survey respondent data quality:
comparing a regular USA consumer panel to MTurk samples.
Journal of Business Research 69(8):3139-3148. https://doi.
org/10.1016/j.jbusres.2015.12.002
Sorensen, P. W., and N. E. Stacey. 2004. Brief review of fish
pheromones and discussion of their possible uses in the control
of non‐indigenous teleost fishes. New Zealand Journal of Marine
and Freshwater Research 38(3):399-417. https://doi.
org/10.1080/00288330.2004.9517248
Spreen, T. L., L. A. House, and Z. Gao. 2019. The impact of
varying financial incentives on data quality in web panel surveys.
Journal of Survey Statistics and Methodology 8(5):832-850.
https://doi.org/10.1093/jssam/smz030
Webber, B. L., S. Raghu, and O. R. Edwards. 2015. Opinion: Is
CRISPR-based gene drive a biocontrol silver bullet or global
conservation threat? Proceedings of the National Academy of
Sciences 112(34):10565-10567. https://doi.org/10.1073/pnas.1514258112
Wilkinson, R., and G. Fitzgerald. 2014. Social acceptability of
the Trojan Female technique for biological control of pests. State
of Victoria Department of Environment and Primary Industries,
Melbourne, Australia.
Wilkinson, R., G. Fitzgerald, and D. Chittenden. 2000. Public
and interest group perceptions of possum fertility controls: a
summary of the focus groups. Pages 101-121 in J. Boland, editor.
Caught in the headlights: New Zealanders’ reflections on possums,
control options and genetic engineering. Parliamentary
Commissioner for the Environment, Wellington, New Zealand.APPENDIX 1: Comparison of sample composition and 2013 Census data
Survey 2013 Survey 2013
Sample Census Sample Census
(%) (%) (%) (%)
Gender Household income (NZ$)
Male 44.6 47.9 None 2.9 0.5
Female 55.1 52.1 $1 - $5,000 1.3 0.8
Diverse 0.3 n.a. $5,001 - $10,000 1.1 1.0
$10,001 - $15,000 2.2 1.7
Nationality $15,001 - $20,000 3.5 2.9
a
New Zealand European 74.7 72.5 $20,001 - $25,000 6.1 3.2
Maori 5.6a 11.2 $25,001 - $30,000 5.6 4.2
Other 11.9a 16.3 $30,001 - $35,000 5.7 4.6
$35,001 - $40,000 5.8 3.5
Education $40,001 - $50,000 9.2 7.2
None 8.0 20.9 $50,001 - $60,000 9.0 7.5
High school 29.0 40.0 $60,001 - $70,000 9.0 7.3
Tertiary 33.9 19.0 $70,001 - $100,000 17.7 20.2
Bachelor's or higher 29.2 20.0 $100,001 - $150,000 13.4 19.1
$150,001 or more 6.4 16.0
Age
18-19 1.7 8.8b Residency
20-24 4.9 8.6 Auckland 12.2 33.6
25-29 7.5 7.6 Bay of Plenty 6.0 6.3
30-34 7.9 7.6 Canterbury 6.1 12.7
35-39 8.4 7.9 Gisborne 3.9 1.1
40-44 7.9 9.1 Hawke's Bay 6.1 3.6
45-49 8.9 8.9 Manawatu-Whanganui 6.1 5.2
50-54 8.9 8.9 Marlborough 6.1 1.0
55-59 9.9 7.7 Nelson 6.2 1.1
60-64 8.7 6.9 Northland 6.1 3.7
65-69 10.5 5.8 Otago 6.1 4.7
70+ 14.7 12.2 Southland 6.1 2.2
Taranaki 6.1 2.6
Tasman 6.0 1.1
Waikato 6.1 9.6
Wellington 6.1 11.0
West Coast 4.5 0.7
a
In the sample, 7.8% of respondents entered multiple nationalities. We excluded these respondents from this table as
we do not know their primary nationality.
b
In the Census, this age group extends down to 15 years.APPENDIX 2: Presentation of the choice experiment
Rats Stoats Wasps
Please read the descriptions of three new techniques below.
Name: New Toxin
What is it: A new toxin that is species specific (eg it only kills rats) and does not kill other animals. This
would be an alternative to 1080.
Name: Trojan Female
What is it: Breeding female animals (eg rats) that naturally produce infertile male offspring.
How is it delivered: The Trojan Females are bred in the lab in small numbers and then released into the
environment.
How can it eradicate pests: Over time the male offspring in the environment becomes less fertile and the
pest population size falls significantly. There is no risk to other species.
Name: Gene Drive
What is it: An animal’s DNA is edited in the lab.
How is it delivered: Large numbers of the animals are bred in a lab and released into the environment to
breed with wild animals.
How can it eradicate pests: By infertility or death -
• Infertility – the animals bred in the lab can only produce male offspring. When they breed with
wild animals the number of females fall. With fewer females to breed with, the entire population
size falls over time.
• Death – the animals bred in the lab pass on a gene to their offspring, which means the offspring
die when they eat a certain type of bait. Over time the offspring will die and the population falls.
In the following questions, you will be asked choose between two different options. The set of
circumstances for each option will vary. They will include:
The new pest control technique • New Toxin,
• Trojan female
• Gene Drive
The animal the new technique would control • Rats,
• Wasps
• Stoats
How the technique will be delivered • On the ground
• From the air
What happens to the animal who interacts with • Infertility
the new method • DeathAPPENDIX 3: Model results with demographic and psychometric variables. Coefficients are log odds ratios with standard errors shown
in parentheses; *** p < 0.01; ** p < 0.05; * p < 0.1; All variables are dummy-coded; Random parameters are normally distributed
MIXL
Model 5 Model 6 Model 7 Model 8 Model 9 Model 10
Age Gender Education Science Political Religion
Main effects
Gene Drive 0.0349 0.0187 0.0719 -0.0842 ** -0.0310 0.0357
(0.048) (0.030) (0.075) (0.042) (0.033) (0.056)
Trojan Female 0.5791 *** 0.4511 *** 0.4678 *** 0.3947 *** 0.4145 *** 0.4975 ***
(0.059) (0.037) (0.092) (0.050) (0.040) (0.069)
Rat 0.2930 *** 0.3924 *** 0.2881 *** 0.2664 *** 0.3132 *** 0.3697 ***
(0.048) (0.031) (0.074) (0.041) (0.033) (0.056)
Stoat 0.0837 * 0.2579 *** 0.1139 0.0401 0.0926 *** 0.2437 ***
(0.049) (0.031) (0.078) (0.043) (0.033) (0.057)
Ground 1.5148 *** 0.9937 *** 1.4277 *** 1.3615 *** 1.3588 *** 1.2071 ***
(0.048) (0.030) (0.073) (0.041) (0.033) (0.054)
Death 0.2657 *** 0.2697 *** 0.2197 *** 0.2536 *** 0.1259 *** 0.1541 ***
(0.042) (0.026) (0.066) (0.036) (0.028) (0.049)
Neither -0.7236 *** -1.2365 *** -0.4214 *** -0.5519 *** -0.7395 *** -0.6562 ***
(0.063) (0.045) (0.094) (0.054) (0.045) (0.070)
Standard deviation of random parameters
Gene Drive 1.5595 *** 1.5398 *** 1.5273 *** 1.5437 *** 1.5259 *** 1.5193 ***
(0.036) (0.036) (0.036) (0.036) (0.036) (0.036)
Trojan Female 0.5811 *** 0.6996 *** 0.5360 *** 0.6961 *** 0.8642 *** 0.8678 ***
(0.035) (0.039) (0.034) (0.039) (0.044) (0.044)
Rat 0.7625 *** 0.7916 *** 0.7722 *** 0.7610 *** 0.7918 *** 0.7917 ***
(0.038) (0.039) (0.039) (0.041) (0.039) (0.039)
Stoat -0.0627 -0.1502 *** -0.0151 -0.2625 *** -0.0002 -0.0441
(0.056) (0.047) (0.056) (0.051) (0.029) (0.023)
Ground 1.4844 *** 1.4637 *** 1.4798 *** 1.4899 *** 1.0522 *** 0.9403 ***
(0.031) (0.032) (0.032) (0.032) (0.027) (0.028)
Death -0.0738 0.7192 *** -0.0934 * 1.0139 *** -0.9507 -0.8878
(0.055) (0.045) (0.055) (0.034) (0.030) (0.030)
Neither 2.3442 *** 2.3232 *** 2.3345 *** 2.2859 *** 0.4599 *** 1.1097 ***
(0.030) (0.030) (0.030) (0.030) (0.043) (0.042)
Observations 64,224 64,224 64,224 64,224 64,224 64,224
Log Likelihood -52,861 -52,919 -52,971 -52,929 -52,901 -52,950
McFadden pseudo-R2 0.262 0.261 0.260 0.261 0.261 0.261
AIC 105,863 105,937 106,055 106,011 105,956 106,055
BIC 106,498 106,381 106,563 106,710 106,654 106,753APPENDIX 4: General survey question on the perceived threat of pests
60
50
Percent of Respondents
40
30
20
10
0
1 - No Threat 2 3 4 5- Serious Threat
Rats Stoats WaspsYou can also read