Agent-Based Simulation to Measure the Effectiveness of Citizen Sensing Applications-The Case of Missing Children
←
→
Page content transcription
If your browser does not render page correctly, please read the page content below

applied
              sciences
Article
Agent-Based Simulation to Measure the Effectiveness of Citizen
Sensing Applications—The Case of Missing Children
Ariadni Michalitsi-Psarrou * , Iason Lazaros Papageorgiou, Christos Ntanos                                and John Psarras

                                          School of Electrical & Computer Engineering, National Technical University of Athens, Iroon Polytechniou 9,
                                          15780 Zografou, Greece; iasonlazpap@gmail.com (I.L.P.); cntanos@epu.ntua.gr (C.N.); john@epu.ntua.gr (J.P.)
                                          * Correspondence: amichal@epu.ntua.gr

                                          Abstract: Citizen sensing applications need to have a number of users defined that ensures their
                                          effectiveness. This is not a straightforward task because neither the relationship between the size of
                                          the userbase or its effectiveness is easily quantified, nor is it clear which threshold for the number
                                          of users would make the application ‘effective’. This paper presents an approach for estimating
                                          the number of users needed for location-based crowdsourcing applications to work successfully,
                                          depending on the use case, the circumstances, and the criteria of success. It circumvents various
                                          issues, ethical or practical, in performing real-world controlled experiments and tackles this challenge
                                          by developing an agent-based modelling and simulation framework. This framework is tested on
                                          a specific scenario, that of missing children and the search for them. The search is performed with
                                          the contribution of citizens being made aware of the disappearance through a mobile application.
                                The result produces an easily reconfigurable testbed for the effectiveness of citizen sensing mobile

                                          applications, allowing the study of the marginal utility of new users of the application. The resulting
Citation: Michalitsi-Psarrou, A.;         framework aims to be the digital twin of a real urban scenario, and it has been designed to be easily
Papageorgiou, I.L.; Ntanos, C.;           adapted and support decisions on the feasibility, evaluation, and targeting of the deployment of
Psarras, J. Agent-Based Simulation to
                                          spatial crowdsourcing applications.
Measure the Effectiveness of Citizen
Sensing Applications—The Case of
                                          Keywords: agent-based modelling; human mobility; simulation; urban mobility; citizen sensing;
Missing Children. Appl. Sci. 2021, 11,
                                          spatial crowdsourcing
6530. https://doi.org/10.3390/
app11146530

Academic Editors: Vicent Botti and
Vicente Julian                            1. Introduction
                                                The involvement of citizens in solving real-life problems is not a new idea. Crowd-
Received: 9 June 2021                     sourcing is an example of this, where an activity is outsourced to the public [1], commonly
Accepted: 14 July 2021                    via the internet. The terminology varies for these applications, depending on where the fo-
Published: 15 July 2021                   cus lies. Hence, they can be found as ‘citizen sensing’ or ‘human-centric sensing’ when the
                                          focus is on the participants and their communities [2,3]. ‘Urban sensing’ is a term proposed
Publisher’s Note: MDPI stays neutral      when focusing on people’s interaction with their surroundings, such as buildings, other
with regard to jurisdictional claims in   people, and vehicles [4,5]. Spatial crowdsourcing focuses on location-specific sensing tasks,
published maps and institutional affil-   in the sense that the participants should physically be at a specific location to contribute [6].
iations.
                                          Participatory versus opportunistic sensing emphasises the active or implicit engagement
                                          of users, respectively [7].
                                                Correspondingly, the term ‘social sensing’ is used to describe the geospatial data gen-
                                          erated per individual and the related analyses methods. In social sensing, each individual
Copyright: © 2021 by the authors.         acts as a sensor, bearing rich information about spatial interactions [8]. On such applica-
Licensee MDPI, Basel, Switzerland.        tions, data collection is strengthened by the human factor by exploiting their mobility, their
This article is an open access article    intelligence, and their flexibility to make complex measurements and deductions, which
distributed under the terms and           could not be possible without them physically being there [9].
conditions of the Creative Commons
                                                The availability and growing adoption rates of web-enabled and location-aware mo-
Attribution (CC BY) license (https://
                                          bile devices have boosted the use of these applications that profit from the collection of
creativecommons.org/licenses/by/
                                          low-cost, value-added information [10]. The data generated from these devices may then
4.0/).

Appl. Sci. 2021, 11, 6530. https://doi.org/10.3390/app11146530                                                https://www.mdpi.com/journal/applsci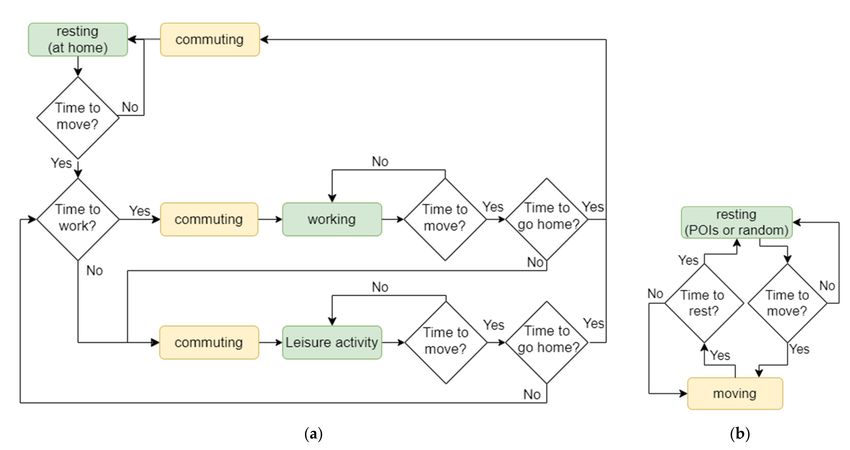
Appl. Sci. 2021, 11, 6530                                                                                             2 of 22

                            be used for various purposes, such as modelling interactions, recording local conditions,
                            measuring community statistics, stimulating collective awareness, and identifying hidden
                            connections among social and physical phenomena [11]. Therefore, social sensing applica-
                            tions have played a critical role in very diverse application domains, such as environmental
                            protection, urban environment and transportation monitoring, public health surveillance,
                            crisis awareness, disaster recovery, and behavioural epidemiology [9,12–15].
                                  In general, citizen sensing apps are horizontal, real-time, open, accessible to anyone,
                            geo-aware—since local information is more probable to be accurate—and they allow infor-
                            mation sharing [15]. In this context, several research challenges regarding citizen sensing
                            applications emerge, such as trust, privacy and data accuracy. Some of the most predomi-
                            nant issues encountered are ‘noise’ in the data, information overload, bias (propagation of
                            the most famous idea), and misinformation. In that sense, several researchers have been
                            working on those challenges [9]. For instance, in [16], users’ contributions are validated by
                            dividing them spatially, temporally, and contextually since an actual event will probably
                            be documented more.
                                  Apart from these critical and widely identified challenges, every discussion on citizen
                            sensing applications should start with the crucial challenge of recruitment. This is especially
                            true for urban sensing or spatial crowdsourcing. In these cases, the coverage of an area, both
                            in time and space, by human sensors for their involvement in data collection and decision
                            making is a key metric [7]. Having human sensors provide high-quality data at scattered
                            locations does not necessarily lead to success. Therefore, the question is whether there
                            exists a minimum number of users, also known as ‘critical mass’, ensuring the promised
                            experience and objectives. The quantification of this number is neither a straightforward
                            task nor one that produces a concrete number. This paper aims to present a novel approach
                            for estimating the critical mass of users in a citizen sensing application for most cases
                            where it is difficult, unrealistic, or even unethical to run observational studies or controlled
                            experiments on identical settings by only changing the number of users participating.
                                  We focus our solution on a specific problem, the missing children issue, where a
                            mobile application for the general public is developed to involve citizens and volunteers
                            in missing children investigations [17]. The application broadcasts mobile alerts, sharing
                            public information about an active case to all users that have the application installed
                            on their mobile phones. The alerts are activated to those users that are located within a
                            predefined area. The users have then the chance to share any information they have by
                            observing their surroundings.

                            2. Background Knowledge
                                 This section introduces the three pillars on which the current work has been built.
                            In particular, this paper aims to study the critical mass of users needed on spatial crowd-
                            sourcing initiatives, where the mobility of citizens, which act as ‘human sensors’ sensing
                            their environment and sharing information, is exploited. The solution to this research ques-
                            tion is given through the development of a simulation framework based on agent-based
                            modelling. Therefore, Section 2.1 examines how the issue of critical mass on collective
                            actions has been studied before, while Section 2.2 introduces the vivid research field of
                            human mobility to showcase that human mobility has already been exploited in many
                            application settings and can be adequately simulated in a city-level. Finally, Section 2.3
                            presents agent-based modelling as a novel modelling approach for simulating complex
                            systems such as that of a city-scale human mobility simulation.

                            2.1. Critical Mass on Collective Actions
                                 Critical mass has been used as a concept for a long time in social sciences, although
                            the term was adopted later. It was initially met as ‘critical density’ in the 1970s by Thomas
                            Schelling in his book Micromotives and Macrobehavior [18] and strengthened by Mark Gra-
                            novetter [19], describing the actions and attitudes of a large set of people and events.
Appl. Sci. 2021, 11, 6530                                                                                            3 of 22

                            Critical mass is applied in many contexts, such as technology, physics, politics, group
                            dynamics, and public opinion.
                                 Critical mass is also frequently met in collective actions [20,21]. Certain products
                            presuppose users’ existence and interaction, referring to the data needed to detect people’s
                            properties and characteristics [22]. Social networks inherently belong to this category, as
                            also, in this context, citizen sensing applications. There is currently little work in the aca-
                            demic literature regarding the critical mass of participants in social, human-centric sensing
                            applications, possibly due to the significant divergence among the different applications
                            and their purpose. In [23], the authors focus on finding the critical set of people by exam-
                            ining both their speak rates—examining how talkative personalities they are—and their
                            interdependencies. People are evaluated and selected based on their expected contributions’
                            data quality, credibility, and trustworthiness. The topic of source selection in participatory
                            sensing has already created a fair amount of interest in the scientific community [23–25].
                                 In [5], the authors acknowledge the necessity of a critical mass of users for a com-
                            mercially successful citizen sensing application in people’s everyday lives. According to
                            them, the sensors’ mobility characteristics are vital for the success of the sensing applica-
                            tion. They also identify an area’s coverage by a mobile sensors’ network as a critical issue
                            strongly related to the sensors’ mobility characteristics. Their network of human-centric
                            mobile sensors is compared in [4] to a static one to determine the space covered in each
                            case. The sensors’ probability to meet, or else ‘sense’, in space and time, the object of
                            interest is also explored. They ran a simulation to validate their approach, concluding that
                            mobile sensors can cover sensing areas over time, approximating static sensors’ coverage
                            with substantially fewer sensors. In this paper, citizens are also used as mobile sensors
                            to cover an area effectively and find the missing child quickly. We also assume that the
                            sensors’ mobility characteristics significantly affect this effort. An appropriately config-
                            ured simulation environment is used to identify the critical mass of participants in such a
                            crowdsensing initiative.

                            2.2. Human Mobility
                                  Over the last few years, the predominance of the internet and subsequent smartphone
                            technology and positioning methods, such as GPS and WiFi, has enabled human mobility
                            data collection. Therefore, academic research and professionals’ interest in analysing these
                            data have been stimulated to understand the main laws that drive people’s motion and
                            mine patterns within them to boost the development of location-based applications and
                            services [26].
                                  The study of human mobility became an even ‘hotter’ topic in 2020 due to the COVID-
                            19 pandemic. Many researchers examined the virus’s spread based on people’s mobility and
                            social interactions and the impact of social distancing policies and other control measures
                            for the virus containment in mobility [27–29]. More research datasets have emerged to
                            facilitate this goal. Key players, such as Google, have supported scientific research in the
                            battle against COVID-19 by providing the aggregated, anonymised mobility insights they
                            use in their products, such as Google Maps, to the public [30].
                                  Human mobility has long been used to study epidemics [31–35], long before the
                            COVID-19 crisis. Analysing and understanding human mobility, however, is vital in many
                            other application domains. Large-scale transportation, mainly served by air and sea, is
                            also studied to better understand global connectivity and migration patterns [36]. On the
                            other side of large-scale mobility, many researchers have attempted to understand the
                            empirical patterns governing pedestrian movement and study emergency evacuation of
                            transport systems, buildings, and public spaces, especially in cases where crowding exists
                            (e.g., religious commemorations, sports events, and festivals) [37]. Applications in that
                            respect may involve many different fields, such as urban planning [38] and simulation [39],
                            public transportation planning [40], and traffic forecasting [41,42].
                                  Over the years, the results of this analysis have shown that human mobility on
                            a macroscale, such as migration, exhibits structural patterns deriving from geographic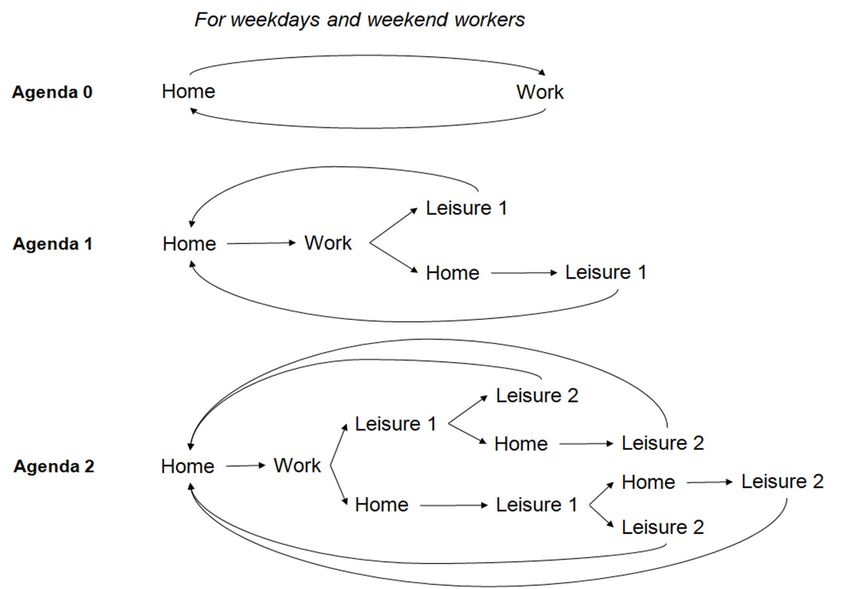
Appl. Sci. 2021, 11, 6530                                                                                           4 of 22

                            and socioeconomic factors and constraints. At an individual’s level, human mobility
                            also exhibits strong periodic behaviour while influenced by many factors [43]. Former
                            studies had suggested that human mobility follows the random walk model [26,44] to
                            compromise the many obscure factors that stimulate human mobility. However, such
                            abstractions usually fail to reproduce realistic models since social and many other influences
                            differentiate people from random walkers [45]. Certain studies have focused on the
                            role the area of residence plays [46,47], deducing several related parameters, including
                            environmental factors and the effect of population size, the morphology, and the street
                            network’s topological structure [43,48] on the travel distances and mobility patterns. For
                            example, Kang et al. [48] have examined the extent to which two urban morphological
                            features, size and compactness, influence intra-urban human mobility. They concluded
                            that individuals’ human travel exponents differ based on the city’s morphology, despite all
                            following the exponential law.
                                  Several different empirical data types have been used to study both individual and
                            aggregate mobility and help adjust and validate models and their parameters, stemming
                            from census data [49,50], Call Detail Records (CDRs) [51,52], taxicabs exploiting tracking
                            and positioning methods [53], and smartphones using social media, such as Foursquare [54],
                            Twitter [55], Gowalla [43], or their GPS receivers [56]. Analysis and exploitation of the
                            raw mobility data are achieved by using interdisciplinary approaches. Techniques and
                            algorithms of machine learning, data mining, and statistical analysis are used for the
                            deciphering of human movement, the extraction of patterns, and the detection of events
                            affecting this movement [26].
                                  Humans are moving daily to earn their living and carry out their social and leisure
                            activities. The former displays highly periodic behaviour, and the latter introduces a
                            random aspect in individuals’ daily trips. According to work by (Cho, Myers, Leskovec,
                            2011) [43], the three main elements that drive and characterise human mobility are (a)
                            geographic movement, i.e., where we move, (b) temporal dynamics, i.e., how often we
                            move, and (c) social network, i.e., how social relationships affect the movement of an
                            individual. In [57], the authors analysed mobile phone data of 50,000 people over 3 months,
                            concluding a 93% potential predictability in individuals’ mobility. On the effect of social
                            relationships, Ref. [43] have shown that social connections can decipher around 10%–30%
                            of all human motion, while periodic behaviour around 50%–70%. To build their Periodic
                            Mobility Model, they assumed that most human movement is periodic, revolving around
                            a limited number of locations. They defined, for simplicity, two ‘latent states’, as they
                            called them, ‘home’ and ‘work’, expecting that an individual, based on the time of the
                            day, will either be in one of these two states or commuting in between them. The patterns
                            extracted from this daily behaviour outline the regularities and recurrence that characterise
                            human lives.

                            2.3. Agent-Based Modelling and Simulation
                                 Human mobility analysis comes hand in hand with the necessity to generate realistic
                            spatiotemporal trajectories of people’s mobility. Concerning the generation of realistic
                            models of human mobility, simulation, specifically agent-based modelling, is probably
                            the most-used in the literature [58]. Agent-based modelling (ABM) is a novel modelling
                            approach when complex systems of independent, interacting agents need to be modelled.
                            ABM can support, through the simulation of an environment’s participants’ actions and
                            interactions, understanding how one’s decisions may affect the whole system. The COVID-
                            19 crisis is also the result of interacting agents. Therefore, apart from studying human
                            mobility, research engineers have extensively used agent-based modelling to understand
                            the COVID-19 crisis and its implications, predict its future outcomes [59–62], and make
                            decisions for measures to be taken, such as social distancing interventions [63], reducing
                            transmission in facilities [64], and comparing different policies [65].
                                 Agents have behaviours and interact with other agents, changing the agents’ be-
                            haviour, which influences other agents’ behaviour in continuous interaction. By this
Appl. Sci. 2021, 11, 6530                                                                                             5 of 22

                             bottom-up modelling approach, where each agent and each interaction are programmed ex-
                            plicitly in the system through rules, new behaviours, patterns, and structures may emerge
                             that were not introduced into the models but ensued from the agents’ interaction [66]. An
                             example of a city simulation where ABM can be used for a what-if analysis to unravel
                             new phenomena and test scenarios is the simulation of urban mobility changes after con-
                             structing new infrastructures or when alarming events happen, such as terrorist attacks
                             and epidemics [31,67]. In another example, the authors in [68] develop an agent-based
                             data-driven model for urban traffic signal timing, while in [69], the authors use agent-based
                             modelling to model and study future urban land-use scenarios.
                                   ABM can also be used to model interactions with the environment, apart from among
                             individuals. An agent can be anything from a human being to a road or a building in the
                            ABM universe. This adaptability that ABM offers justifies its increasing use as a powerful
                             technique for decision making in entirely diverse areas. The abundance of special-purpose
                             agent tools further proves the significance and wide adoption of ABM by many researchers.
                            These are developed to address the specific requirements for modelling agents, such as
                             Netlogo, StarLogo, Repast, Swarm, Mason, and Anylogic [70,71], allowing scientists to
                             focus on the modelling rather than the visualisation of model progress and outcomes. ABM
                             frameworks have also been built in the most popular software programming languages,
                             such as the Mesa framework in Python [72] and the JABM framework in Java [73].
                                   Space and time are fundamental components of ABM and the base for many modern
                            ABM applications. The range of combined ABM and GIS applications at different temporal
                             and spatial scales is indicative of the usefulness of their functional interconnection. In [74],
                             the author briefly reviews the many and diverse application fields of ABM using GIS,
                             ranging from disease modelling to migration and border security studies. As Andrew
                             Crooks states, ‘agent-based simulations serve as artificial laboratories where we can test
                             ideas and hypotheses about phenomena that are not easy to explore in the ‘real world” [74]
                            (p. 71). He mentions the example of pedestrian modelling of an evacuation, where the
                             building cannot, based on logic and ethics, be set on fire to test how people will respond to
                             this. In this work, the investigation for a missing child is examined through the involvement
                             of citizens. This is also a case where it would be impossible and even unethical to actually
                             test different scenarios with unknown results since this would mean testing it directly
                             on individuals already in dire distress. Therefore, as with all simulation systems, ABM
                            provides a way to create an artificial world to test numerous scenarios without running
                             randomised controlled experiments or setting case–control observational studies. The
                             former would be expensive, hazardous, and even immoral. The latter would require the
                             system tested to already be in place and a much broader dataset than the ones fortunately
                             available for missing children’s cases.
                                   ABM is commonly used to solve optimisation problems. In classical optimisation
                             approaches, optimisation algorithms are developed as step-by-step processes [75,76]. These
                             algorithms may be either exact if they detect the optimal solution or heuristic if they end up
                            with an acceptable solution that is not necessarily optimal. Lately, agent-based approaches,
                             including ABMs, have been utilised to solve complex optimisation problems when the
                             classical approaches are not applicable [76]. They design the solution either through a
                            ‘functional’ or a ‘physical’ scheme. In the first case, the agents are represented as functions
                            with no physical dimension. In the second case, which is also the approach of this paper,
                             agents symbolise physical entities, such as citizens and vehicles [77].

                            3. The ChildRescue Simulation Framework
                            3.1. Methodology
                                 The difficulty of running real-world controlled experiments to identify the number of
                            users needed in a geographical area to have a successful application is further toughened
                            here due to the subject’s highly sensitive nature. These experiments would need to be
                            completed during a missing child incident and at the child’s expense. Through simulation,
Appl. Sci. 2021, 11, 6530 6 of 22
the ethical and practical concerns are withdrawn. Different scenarios can run in identical
settings for the independent variable, i.e., the number of users of the citizen sensing app.
Current investigations for missing children are supported by missing children re-
sponse organisations that operate the 116 000 European Hotline for Missing Children,
manage the Amber Alert system, and on several occasions exploit their network of certified
volunteers and in-field search and rescue teams. They are confronting over a quarter-
million cases of missing children every year in the EU alone [78] and around 8 million
globally [79]. This is the baseline of our experiment, representing the current situation.
In the context of the EU-funded research project ChildRescue, a citizen sensing mobile
application has been developed that alerts its users when they are close to a missing child’s
incident or other critical locations for the child [80]. The application is already being used
in real-life cases and downloaded by more than 20,000 citizens in Greece and Belgium.
However, the question raised is how many of these users are needed in an examined
geographic area to find a child considered lost there, faster than with the current means, i.e.,
the baseline, which would enable the claim that the application outperforms the existing
systems. To answer this question, we have built a simulation framework that is easily
reconfigurable to adapt well to the urban environment in question and its citizens’ mobility
characteristics. We ran simulations in selected geographic areas to identify the users’
critical mass, namely the users’ threshold from which point on the application is effective
for the specific location in question. The mobility characteristics of these locations must
be identified beforehand through appropriate analysis. The insights are translated into
specific metrics that are easily fed into the system by the users themselves.
The simulation platform has been built in the GAMA platform, programmed using
the GAma Modelling Language (GAML), an agent-oriented programming language [81].
GAMA was selected because its meta-model is designed to facilitate the complex represen-
tation of the environment and the creation of multi-level models. It enables the modelling
and simulation of spatially explicit agent-based systems through the integration of GIS
data. According to the developed framework, a geographic area to be examined should
be selected. The geodata of this area are inserted in the system as an OSM file, extracted
either directly from Open Street Map or other platforms giving this opportunity (e.g.,
Extract.BBBike [82]). Therefore, actual data about roads, intersections, and buildings of
a certain area are used to develop the simulation environment. The geographic area is
modelled through building agents, road agents, and additional geographical information,
which is part of the simulation’s motion graph. This graph supports the movement of the
agents within the simulation. On the created simulated space, citizens, hereby ‘people
agents’, live and work, while at the same time a child is missing.
In GAMA, different types of agents exist with their own behaviour and skills, sup-
ported by functions. Our model has the static agents responsible for developing the virtual
geographic environment and the mobile agents, consisting of two species: the people and
the missing child. The people agents are citizens who move around the city to commute to
work, go back home orperform their daily leisure activities. Both species have movement
skills, meaning that the movement of agents is simulated along a graph. An interactive
visualisation environment in GAMA provides monitoring capabilities to the user.
The people agents’ number is the independent variable, editable by the user, to
represent the mobile application users in the area in question. Every people agent has a
specific apartment of a building as a home and another as a workplace, as in the periodic
mobility model of [43]. It is assumed that both buildings are located within the map and
are randomly distributed. Each people agent has a daily agenda, different for each day of
the week. This agenda involves working, resting and performing leisure activities (e.g.,
shopping, visiting a friend, going to a restaurant). For the weekdays, as also depicted in
Figure 1a, all people agents are assumed to commute to work and perform their leisure
activities depending on their agenda, ranging from none to two leisure activities per day,
based on the insights for the citizens’ daily mobility networks of [83–85]. Thus, at the
start of each day and if the day is a working day, each people agent is assigned one of theshopping, visiting a friend, going to a restaurant). For the weekdays, as also depicted in
Figure 1a, all people agents are assumed to commute to work and perform their leisur
Appl. Sci. 2021, 11, 6530 activities depending on their agenda, ranging from none to two leisure activities 7 of 22 per day
based on the insights for the citizens’ daily mobility networks of [83–85]. Thus, at the star
of each day and if the day is a working day, each people agent is assigned one of the thre
agendas
three depicted
agendas in Figure
depicted in Figure 1a.1a.The
Theagents
agentsmay:
may: (a) commuteonly
(a) commute onlytoto work
work and and
go go back
homehome
back (agenda 0), (b)
(agenda 0), have oneone
(b) have leisure activity
leisure during
activity during the day,
the day,either
eitherdirectly
directly after
after work o
work
after or afterhome
going going home first (agenda
first (agenda 1), or1),(c)
or have
(c) have
twotwo leisureactivities
leisure activitiesthat
that they
they may
may choos
choose
to perform right after work, one after the other, or go back home before the
to perform right after work, one after the other, or go back home before thefirst
first and/o
and/or before the second (agenda 2).
before the second (agenda 2).
(a)
(b)
Figure1.1. The
Figure The different
differentimplemented
implementeddaily
daily agendas
agendas forfor
thethe people
people agents
agents in the
in the simulation
simulation for for (a)
weekdays, including the weekend workers who have similar behaviour to the one they
(a) weekdays, including the weekend workers who have similar behaviour to the one they have on have on
weekdays and (b) weekends for all people agents that do not work on weekends.
weekdays and (b) weekends for all people agents that do not work on weekends.
For
Forthe
theweekends,
weekends, only 10%10%
only of the
of people agents
the people are assumed
agents to be working.
are assumed These Thes
to be working.
have the same options for their daily agendas as during the weekdays, shown in Figure 1a.
have the same options for their daily agendas as during the weekdays, shown in Figur
The rest are resting at home or experiencing more prolonged leisure activities, with a
1a. The rest are resting at home or experiencing more prolonged leisure activities, with a
maximum of two different leisure activities, as this scenario covers the great majority of
maximum
cases of different
[83]. The two different leisureoptions
implemented activities, asdaily
for the this agendas
scenarioofcovers the agents
the people great majority
for o
cases [83]. The different implemented options for the daily agendas of the
the weekends are depicted in Figure 1b. During weekends, the agent may choose either to people agent
for the
stay weekends
home are depicted
without going in Figure
anywhere 1b.agenda
(weekend During0),weekends, the agent
have one leisure may
activity choose eithe
during
the day and return home (weekend agenda 1), or have two leisure activities that may beAppl. Sci. 2021, 11, 6530 8 of 22
completed one after the other or mediated by a return to home (weekend agenda 2). All
different agendas in Figure 1 aim to be as close to reality as possible and represent and
simulate the reasons why a person moves during a day.
People agents move at specific times of the day, different for each person, but within
regular working and leisure hours, adjustable during the experiment. They move either on
foot or by using means of transport, simulated by giving different speeds to their movement.
Every individual’s movement has an origin and a destination, following the shortest route
within the road network. The framework supports two different modes for the decision
on the mobility status of the people agents. The default one is for the agent to walk if the
distance to be covered is short (i.e., less than 1 km) and to drive otherwise. The second
mode allows the user to run experiments by giving percentages of people agents who move
by ‘walking’ and those ‘driving’. This mode is appropriate when demographic data for the
area in question are available. The people agents’ behaviour can also be represented by
their different states and the functions implemented in the system to shift between them,
as depicted in Figure 2a. The agents have three static states: working, resting at home, and
performing leisure activities. They also implement functions to define the conditions and
the timing for these shifts to occur. The day for all people agents starts from the ‘home’
state; then, they commute to ‘work’ according to a schedule based on their agendas. They
may also go directly to a ‘leisure activity’ if it is a weekend (Figure 1b). When at ‘work’ or
the location of the ‘leisure activity’, other functions define the terms for their transition to a
new state.
The missing child, on the other hand, moves with a user-adjustable speed depending
on age. The location, date, and time that the child was last seen are also parameters of
the system initiated by the simulator. The simulator can also enter one or more Points
of Interest (POIs) for the child, such as playgrounds, schools, and friends’ houses. The
missing child then moves either to one of these POIs or a randomly selected location on
the map, using a stochastic model, the values of which can be modified by the simulator
for each experiment, based on the expected validity of the information they have for
the child. It is also assumed that the child will rest for a random period inserted by the
simulator, based on the child’s age and the data, in each ‘shelter’ destination, before going
to a new destination, as depicted in Figure 2b. These parameters have been co-decided
with three missing children response organisations—the Smile of the Child in Greece,
Child Focus in Belgium, and the Hellenic Red Cross—along with MCE, being the umbrella
organisation of all EU missing children response organisations [86]. These organisations
actively participated in validating and testing the developed mobile application and are
now its first users. The missing child’s parameters in the simulation define the child’s
disappearance’s initial conditions and expected behaviour based on these organisations’
and operators’ experiences and expertise.
The interaction among the citizens and the missing child is represented by another
function, according to which at each simulation cycle, the people agents are looking for
whether the missing child is somewhere near them. Even if a citizen comes in easy reach of
the child in the simulation, the child is not necessarily considered as found. The citizens
may be distracted or may fail to recognise the child from the public pictures distributed
through the mobile app, as the academic literature suggests [87,88]. However, we consider
this value of destruction less intense than the current situation since the child’s picture will
be just a click away on their mobile rather than the once-seen picture on an Amber alert.Appl. Sci. 2021, 11, 6530 9 of 22
Figure 2. Behaviour and states of: (a) the people agents and (b) the missing child.
The transportation means used by the citizen and the missing child at the meeting
time also play a crucial role. They outline the velocity of the citizen and the missing child at
their encountering and, consequently, its duration. A probabilistic model of discovery for
the missing child has been developed to implement this behaviour in the system, according
to which there is a different adjustable probability for the citizens to identify the missing
child based on whether they are driving, walking, or resting. Whether the agents are
inside or outside a building at the meeting time is also considered in our probabilistic
discovery model.
In total, 29 parameters are used to calibrate the maps, the missing child’s movement,
mobility, and probabilities of identifying the child according to the circumstances of the en-
counter. Apart from the default simulation execution mode, where the simulator supervises
the experiment by watching the agents move across the map, a batch experiments’ mode
has also been implemented. Batch experiments are consecutive experiments performed for
multiple iterations until a user-defined condition is met. These experiments aim to test one
specific parameter and how its value affects the results. Therefore, in each iteration, only
this parameter’s value changes. In our case, we aim to explore the impact of the application
users’ number on the time it takes to find the missing child. In this context, two types of
batch experiments have been developed. In both types, only the number of the people
agents changes. In the first type, the simulation ends after a selected period to examine the
number of times the child was close to other people agents and the number of times these
agents identified the child. In the second one, the simulation ends when a people agent
identifies the child for the first time.
3.2. Forming the Baseline
To form the baseline of our experiment, the current situation for the missing children
issue was captured based on the information provided by the participating organisations
mentioned before. Fourteen bilateral meetings and interviews took place, and past resolved
cases were collected to set up the experiments’ baseline on both their expertise and the
data. A dataset of 121 past cases was provided, including a unique case ID for each
record and other information about the child and the disappearance conditions, such
as gender, age, location last seen, date and time of disappearance, and date and timeAppl. Sci. 2021, 11, 6530 10 of 22
found. The dataset on which this analysis was based may seem small. However, it
well represents the cases that the organisations that provided them have handled in the
last 10 years. For the categorisation of the cases, all three organisations have adopted
MCE’s categorisation system, according to which there are five types of missing children
cases, (a) runaways, implying voluntary leave; (b) third-person abductions; (c) parental
abductions; (d) missing unaccompanied migrant minors; and (e) lost, injured, or otherwise
missing children [89]. Each type demonstrates different characteristics studied a lot by
the organisations’ social workers and, therefore, different prospects for their successful
resolution, as depicted in Table 1 providing summary statistics for the resolved cases of
the dataset per missing type. The past cases analysis also showed a statistically significant
relation ( p-value = 3.796 × 10⁻¹ ) among the missing type and the child’s age group when
excluding the ‘lost, injured, or otherwise missing’ category that incorporates all cases
with unknown circumstances of disappearance. The Chi-square test of independence was
conducted, ensuring that no more than 20% of the cells have an expected frequency lower
than five. The Bonferroni-adjusted method was then used as a post hoc test to identify
the age groups and missing types responsible for creating a significant relationship. A
dependence among runaways and adolescence (age 10 onwards), on the one hand, and
parental abductions and early childhood, on the other hand, was identified. Through
statistical significance tests, a correlation among the missing type and gender also emerged,
indicating that more females than males tend to run away and that there is a higher
proportion of male unaccompanied migrant minors.
Table 1. Summary statistics (in days) for the resolution of cases per case type from the dataset of
missing children’s past cases.
Case Type Median Mean Min Max Std
Lost, injured, or otherwise Missing 1.35 2.89 0.45 12.58 3.64
Missing children in migration 62 175 0.396 988 295.9
Parental abduction 13.5 40.54 1.187 152 63.4
Runaway 2.92 20.01 0.25 367.7 56.7
In rough numbers, most of the dataset’s disappearances are runaways (52%), which
conforms with MCE’s annual reports [90]. It is followed by missing unaccompanied
migrant minors (31%), a case type not well represented in the official reports. Of the
23 surveyed organisations in 2019, only 47.6% reported that they work on missing children
in migration, and only five organisations could provide more detailed information on the
time it took before the missing minors were recovered [90] (p. 6). Cases of children in
migration take the longest to be solved, if solved at all, as also indicated by Table 1. Thus,
it is not the most representative case to work on.
It can be seen in Table 1 that there is significant variation in the data, which renders
the determination of a baseline value for the resolution of cases challenging. Each child is
unique, and so is each missing child case. Despite their differences, though, there are also
commonalities, especially for cases of the same type. Therefore, for the simulation, we have
assumed the case of a missing adolescent running away from home. The ‘runaway’ missing
type has been selected as it is the most representative category and the most dependent on
the missing child’s behaviour rather than external factors (e.g., abductor). It also displays
the minimum variance (s = 56.7), with the exception of the ‘Lost, injured, or otherwise
Missing’ type, which denotes unknown reasons and conditions of disappearance and is
underrepresented both in the dataset (n = 14) and all cases in Europe (1.3%) [90].
The baseline value was set in agreement with the participating organisations, which
would consider the mobile application to be serving its goal if the missing child was to be
found in less time than the median value of the examined case type, ‘Runaways’ (2.92 days).
In parallel, confirming the known perception that the first 48 h are crucial for increased
odds for the child to be found safe and sound, they highlighted that a case’s resolution
below that would be the most preferable. Considering this the baseline of our experiment,Appl. Sci. 2021, 11, 6530 11 of 22
we aim to show that an intensified, location-based citizen engagement may significantly
reduce the time needed to find missing children.
4. Experimental Evaluation
4.1. The Data
Empirical data from mobile phones were collected to analyse mobility in Athens,
Greece’s capital city, encompassing spatiotemporal information for citizens at an aggregate
level. Telecom provider-collected data were analysed to study human mobility. The
dataset originates from one of Greece’s top three largest mobile operators, with more
than 4.4 million active subscribers, translated into around 15–25% of mobile telephony
subscribers in Greece. It contains users’ volume information for 39 cell sites in the Athens
centre for every 3 hours for 1week (6 September 2019–12 September 2019). The provider
selected the 3-hour timeframe because the connection with a mobile device is observed and
updated every time the device initiates an activity (e.g., phone call, SMS) or every 3 hours if
the device is idle. Therefore, information about the devices’ connection with cell towers is
logged at least every 3 hours, even if they are in ‘standby’ mode, not displaying an activity.
Figure 3 shows the 39 cell sites’ locations and the total number of connected users per
hour and weekday for all the participating cell towers. Athens centre being a commercial
district, its dataset allowed examining the effects of commuting to workplaces and leisure
activities, such as shopping. The datasets also enabled the approximation of the citizens’
number commuting there and the identification of users’ density maps and, consequently,
patterns for the centre of Athens. The derived maps show the mobile phone users’ distri-
butions, indicating the total population distribution. Linear regression models have been
proposed to extract total population numbers and distribution [91].
Figure 3. Cont.Appl. Sci. 2021, 11, 6530 12 of 22
Figure 3. (a) The location of the 39 cell sites participating in the analysis. Blue markers show the
exact location of a cell site, while green circles represent marker clusters with a number showing the
number of cell sites in the vicinity of the circle’s location. Marker clusters group markers at varying
zoom levels. (b) The mobile phone users’ number per hour and weekday.
4.2. Results
The previous analysis was used to study the mobility in Athens and adapt the model
accordingly. For example, the time to start work was based on the insights from the
data, setting the minimum value at 03:00 and the maximum at 09:00. Other parameters
of the simulation framework were fed with statistical information from governmental
and European Commission reports. For instance, the percentage of people walking in
the simulation was set to 42%, following the percentage of citizens who most often use
walking as their mode of transport in Athens, based on the 2016 State of European cities
report [92]. The maximum driving speed was adapted to the maximum driving speed in
the Athens centre, which is 50 km/h. Realistic default values were also used for some
parameters to apply to all simulations, such as the minimum driving speed, which was set
to 10 km/h, and the minimum and maximum walking speed for people agents, set to 3
and 6 km/h, respectively [93]. Some random value selections had to be made, such as the
starting position for the missing child and the POIs to search for.
In general, all simulation parameters can be easily adapted to the specificities of a
particular city or neighbourhood when there are data available or statistics for the people’s
mobility there (e.g., car use, traffic hours). They can also take values from probability dis-
tributions when, based on the available data, the empirical distributions for the simulation
parameters fit well on specific distributions (e.g., gauss, gamma), having the least Sum of
Square Error (SSE) among the examined distributions.
In the simulation, we explore two different indicators, how much time has passed for
the missing child to be found by one of the people agents, i.e., citizens of the simulated
city, and the number of times the missing child was found in 2 days to explore the im-
pact that the number of mobile application users, denoted as nb_people in the simulation
framework, have over the simulations’ result. The nb_people is the independent variable
that we aim to explore to investigate the critical mass of application users. The 2 days’
timeframe was selected since this was decided to be the threshold below which a missing
child should be found with the new mobile application, as indicated and explained in
Section 3.2. The simulation step is set at one second, as a quite small step that can enable
realistic representation of the motion of both people agents and the missing child, not
affecting the accuracy of the results. The aim is to run many simulations using the same
conditions and analyse the impact of the number of engaged citizens on the time needed
for the missing child to be found. In addition, different values for the probabilities ofAppl. Sci. 2021, 11, 6530 13 of 22
the probabilistic discovery model, discussed in Section 3.1, are explored to examine the
impact of stochasticity on the simulation results. We launch ten (10) simulations for each
experiment examining a different number of people agents and display the indicators’
mean and standard deviation values, keeping the seed values constant for the random
number generators among the experiments. The variable nb_people took values from 50 to
2200 with a step of 20 to examine a great range of people agents’ numbers in the simulation.
The batch experiments were conducted twice, one for each indicator explored. For each
batch experiment, each different nb_people value ran 10 times, as mentioned above, leading
to 2160 simulations.
For each experiment of an increment of 20 users added, the number of iterations was
set to 10. The variation in the results using this amount of simulations is small enough and
straightforward so as to produce a clear curve, as shown in Figure 4b. More simulations
are not expected to alter in any significant way the shape of the curve, which is what the
aim of the experiment is.
Figure 4a provides a screenshot from the simulation framework during an experiment
where there are 600 users at the simulated centre of Athens and the missing child. The
experiments conducted for the Athens centre highlighted how this simulation framework
could be used to examine the necessary adoption rates of such a citizen sensing mobile
application per area to be successful. The results for the first indicator, days for the child to
be found, are shown in Figure 4b,c. A horizontal dashed line at days equal to 2 has been
added to show the baseline value of the experiment. It can be seen in Figure 4b that the
median values of the days for the missing child to be found for the different number of
users create a curve resembling a hyperbola. Indeed, fitting the data through nonlinear
regression to different curves, the best fit, by using nonlinear least-squares minimisation,
was found to be:
a
f ( x ) = , where a = 466.18 (1)
x
The optimal value for parameter a was determined so that the sum of the squared
residuals (SSR) of f ( x ) − ydata is minimised, namely, the minimum of:
108
SSR = ∑ ( f ( x i ) − y i )2 , (2)
i =1
where yi is the ith value of the sample, f ( xi ) is the predicted value of yi , and xi is the
ith value of the independent variable (i.e., nb_people). The fitted curve over the original
data is also depicted in Figure 4b. The resulting fitted curve can then be used in decision-
making as it can be considered a utility function that quantifies the marginal utility of
the users for the citizen sensing application in question. In other words, a diminishing
marginal utility [94]—which is a concept also used lately in a broader sense than its original
economics scope [95,96]—can be observed in Figure 4b as its first users yield more utility
than the subsequent ones, with a continuous decline for more users. Therefore, the decision-
makers—the missing children organisations in that case—will be able to determine the
expected benefit from the acquisition of new users of the mobile application to adapt their
marketing strategies and compare this solution over their other approaches for engaging
the public.
According to the data, the median value for the ‘days to be found’ falls below the
baseline for the first time at nb_people = 210. After 500 users, a horizontalisation of the curve
appears, approaching a horizontal asymptote. Therefore, while the critical mass cannot
be an exact number, it can be claimed that around 500 users of the mobile application are
needed in the examined geographical area to outperform the current situation and have
significantly better results. Less than 500 users mean that the area is not yet sufficiently cov-
ered, and, thus, each new user offers significance to the investigation. More than 500 users
would increase the effectiveness, but with diminishing returns per new user. An ANOVA
test also concurred that until they reach 500, more users would make a significant difference.
In particular, the differences between the results for the time needed to find the child withAppl. Sci. 2021, 11, 6530 14 of 22
nb_people = 50 and with nb_people = 550 are statistically significant (p-value = 0.0016), while
for nb_people = 550 and nb_people = 1050, they are not (p-value = 0.394).
Figure 4. Cont.Appl. Sci. 2021, 11, 6530 15 of 22
Figure 4. (a) Screenshot from the simulation for the Athens centre with the missing child (red dot) and
600 users (blue dots) (b), (c), (d) Results of simulation runs: (b) median value for the days needed
for the missing child to be found, removing outliers using a z-score with a ±3 standard deviations
threshold. (c) Simulation results using boxplots for nb_people mod 50 = 0. (d) Median value for the
number of times the missing child is found in a 2-day simulation for different numbers of users.
The simulated area is the centre of the city of Athens, Greece and is around 2.5 km2 .
Overall, the average population density for the entire city is 7381 people/km2 [97], while for
its centre, it reaches more than 25,000 people/km2 . This is also close to the estimation from
the mobile operator’s data (µ = 27,340 people/km2 considering a 24.5% market share for
the operator [98]). A total of 500 users of the application represent 0.8% of the 62,500 people
considered to be living in the area (2.5 × 25, 000), down to 0.7% of the 68,350 people, if
using the mobile operator’s density estimation. This means that for the characteristics of
the centre of Athens, the user density required for effective investigations should be more
than around 200 users/km2 , representing a little less than 0.7–0.8% of the population for
that area.
This estimation cannot be accurately extended to the entire city, for example, by
calculating the average population density of the entire city, because this will lead to
unfounded generalisations. The morphology and street layout greatly affect the citizens’
movement and, thus, the circumstances and chances for a missing child to be found. Other
parameters, such as if the area is a commercial or residential one, need also to be taken
into consideration, and affect human mobility. Nevertheless, it can still be used for crude
estimates and ballpark figures in the absence of more accurate information.
Figure 4c reveals much variation in the data for each number of users examined,
though reduced as we test for more users. This is expected since there is more uncertainty,
because a successful encounter of the missing child is less likely to happen at any given
moment. This variation is reduced the more agents are added to the experiment, as is the
average time until an encounter with the missing child takes place. Using ten (10) test runs
for each scenario reduces this uncertainty in the results, but at the same time, emphasises
the fact that this greater upwards variation for low numbers of users translates into even
more pronounced risks for the safety of the missing child. In other words, there are two
categories of outcomes for missing children: they are either found in good health or not. A
larger upwards variation in the time needed to locate each missing child will inevitably
lead to fewer children ending up being found in good health. More users aware of the
disappearance reduce the uncertainty and make the discovery not only timelier but also
more predictable.
Figure 4c also confirms our initial assumption that the critical mass of users cannot be
a precise number. Nevertheless, for the selected area of the centre of Athens, we found that
if the Amber Alert system was not in place, we would need at least 233 moving users to
achieve the same result of less than 48 h until a missing runaway is located. In a scenarioAppl. Sci. 2021, 11, 6530 16 of 22
such as this, where multiple unpredictable parameters affect the turn of events, the aim
is to reduce the uncertainty as much as possible or needed, to maximise the utility of the
application. In the end, the resulting estimation of more than 200 users/km2 for the centre
of this city cannot be decoupled from the reduction of the variance achieved in larger
numbers of users when considering real cases of missing children. The real-world situation
confirms that the variation that the simulation results illustrate aligns with the data from
actual cases. As shown in Table 1, presenting data for the resolution of past cases, even
cases of the same type are resolved at very different times, even though the same search
and rescue mechanisms are activated. In other words, if most children are found within a
couple of hours, that one which will be found a couple of days later will face greater risks.
Reducing this variance with more users in the citizen sensing application, i.e., reducing this
uncertainty, also reduces the number of deviant cases, and hence those extreme situations
where luck, or lack thereof, may cost a life.
The second indicator, depicted in Figure 4d, shows the number of times a child has
been located if the simulation does not end when they are found the first time, and the
experiment runs for 2 simulation days. The interpretation of the graph is that the more
users are aware of the disappearance, the more times they will recognise the child in the
street during a period of 2 days. The variance of the number of times the child is located is
increased as the users are increased at a lower rate than its ratio, showing again that the
unpredictability in locating the missing children is reduced. A significant result is also the
large number of cases where with a small number of users, the child is never encountered
by a user in these critical first 2 days. Nevertheless, when considering the cases where
the child is encountered more than once, a scenario where this is applicable is the case
where agents fail to recognise the child, as seen before [87], and multiple sightings may be
required for a positive identification to take place.
5. Discussion
In this paper, we have built a stochastic, bottom-up simulation framework for citizen
sensing crowdsourcing applications, together with a proof of concept on the investigation
of missing children. It shows that the effectiveness of such applications is a function of
the number of users they have, which in turn can be approximated and studied. This can
be completed if the simulation model is scalable, allowing for heterogeneity in individual
characteristics (e.g., agendas, working hours, travel speed, missing child’s movement).
This framework relies on geographical and aggregated demographic data. Since the
simulations aim to approximate, rather than predict, cases of investigations for missing
children, demographic aggregates are enough for the required granularity of the test runs.
As the real cases are random events in a fluid, but probabilistically predictable environment,
so are the simulated ones. This leads us to conclude that the simulations do not need to
replicate the real world, but rather provide statistical results that are comparable with
it. Further refinement of the model is easily achievable, with the use of more data on
human mobility in an area, and of course, allow the simulations to run for other locations,
but for the scenario investigated in this paper, more data will not significantly alter the
statistical results of the simulations. In the end, the goal of this framework is to provide a
decision support tool for organisations that need to predict the effectiveness of the collective
awareness mobile tools they provide to form a strategy for reaching the market penetration
they need to have.
Agent-based modelling and simulation have been primarily used in many applications
to analyse the relation of different variables and their mutual influences in a spatiotemporal
context. They intended to unfold valuable insights for the spatial dynamics developed
when simulating a complex system such as that of the natural world by simulating people’s
bottom-up behaviour [99,100]. Our model is built on the knowledge the academic literature
has acquired to develop a new urban simulation of human mobility able to answer compli-
cated questions, opening up capabilities for other applications. In particular, considering
the use of the adapted simulation model on any similar citizen sensing mobile applicationYou can also read