Alterazioni del grasso corporeo: Il ritorno di antichi fantasmi? - Antonella Castagna
←
→
Page content transcription
If your browser does not render page correctly, please read the page content below
Alterazioni del grasso corporeo:
 Il ritorno di antichi fantasmi?

       Antonella Castagna
David Lowery, 2017

Diagnosis and treatment of lipodistrophy: a step-by-step
approach

                                                     D. Araujo-Vilar
ENDOCRINOL METABOL CLIN N AM 2016
Potential causes of inflammageing

                       Ferrucci F, NrC, 2018
Inflammageing is a risk factor for multiple chronic diseases

                                     Ferrucci F, NrC, 2018
Heart Fat in HIV: marker or mediator of risk?

                       Curr Opin HIV AIDS, 2017
WHAT ABOUT TAF ?
Fletcher C, CROI 2019
What is LDL Cholesterol?

Holmes MV, NrC , 2019
Mills A, et al. JAIDS 2015
Switch study (TANGO)

Phase III, randomised, multicentre, parallel-group, non-inferiority study
• Objective: To demonstrate the non-inferior antiviral activity of switching to DTG/3TC QD
  compared with continuation of current ARV regimen over 48 weeks in HIV-1-infected
  ART-experienced subjects
• Primary endpoint: The proportion of participants who meet the snapshot virological failure
  criteria at week 48 using the ITT-E population
  – Non-inferiority margin = 4%; week 48 primary endpoint

                                             TAF-based regimens
                     Randomisation
   TAF-based
   regimens
                     1:1
                     N=600
                                             DTG/3TC

                                        Baseline   Week 24   Week 48     Week 96 Week 144

                                                              Primary
                                                             endpoints
   North America + EU + international                        Secondary
                                                             endpoints
JA LAKE, CROI 2019
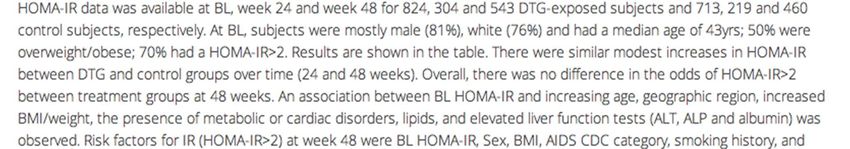
Bernardino J, 2019
OC64

  Homeostatic model assessment for insulin resistance (HOMA-IR)
 index trajectories in HIV-infected patients treated with first-line
     antiretroviral regimens based on non-nucleoside reverse
   transcriptase inhibitors (NNRTIs), ritonavir-boosted protease
inhibitors (PIs/r) or on integrase strand transfer inhibitors (InSTIs)

Muccini Camilla1, Gianotti Nicola2, Galli Laura2, Poli Andrea2, Galizzi Nadia1, Dell’Acqua
   Raffaele3, Mastrangelo Andrea1, Messina Emanuela2, Piatti Pier Marco4, Lazzarin
                                         Adriano2, Castagna Antonella1,2

                                        1Vita-Salute   San Raffaele University, Milan, Italy;
                                       2IRCCS   San Raffaele Scientific Institute, Milan, Italy;
                                            3University   Hospital Policlinico, Bari, Italy;
    4Cardiometabolic   Clinical Trials Unit, Internal Medicine Department, IRCCS San Raffaele Scientific Institute, Milan, Italy

                       ICAR 10° congresso nazionale, Roma 22-24 maggio 2018

                                                                                                Submitted, JMV
Material and methods • Retrospective analysis on a cohort of HIV-1 infected patients followed at the Infectious Diseases Unit of the San Raffaele Hospital of Milan: • who started antiretroviral therapy (ART) since 2007; • with 2 NRTIs (tenofovir, abacavir, lamivudine or emtricitabine) and 1 anchor drug [ritonavir-boosted PI, non-NRTI or integrase strand transfer inhibitor (InSTI)]; • with 1 HOMA-IR determination before starting ART and ≥1 determination after starting ART; • Patients with known diabetes were excluded; • Follow-up accrued from the start of ART (=baseline, BL) up to the stop of any drug of the regimen or lost to follow-up or data freezing (January, 22, 2018); • Univariate and multivariate mixed linear models with random slope and intercept for each patient were fitted to estimate HOMA-IR changes according to the anchor drug.
Changes from baseline in HOMA-IR index according to the
            type of the initial ART regimen

                                 Univariate mixed linear model
             Type of ART
             regimen       Crude mean (95%CI) change in
                                                           P-value
                              HOMA-IR, units per year
             INSTI            0.149 (0.012, 0.287)          0.034
             NNRTI            -0.071 (-0.174, 0.031)        0.174
             PI/r             0.041 (-0.052, 0.134)         0.387
Inflammageing induces a catabolic state.
L Ferrucci, NrC 2019LT Fourman, AIDS 2017
Ogni difficoltà su cui si sorvola diventa un fantasma che
turba il nostro sonno
F. Chopin
Tom’s Selfies
Accessi al servizio di chirurgia plastica _ Data on File_ 180319_OSR

          800
                                        757

          700                                    680
                                                                                      660
                                                                            635
                                                          598      609
          600                   586                                                           588

          500

          400           368

          300                                      261
                                          253
                                  207                       215                 215     218
                                                                      203                       203
          200
                          145
                                                                                                      10189
          100

                15 15
            0
                2009    2010    2011    2012     2013     2014     2015     2016      2017    2018    2019
                                              N° VISITE           N° pazienti
PRE-DIABETE
Glicemia Glicemia 2 ore dopo
a digiuno il carico di glucosio all’OGTT
Diabete Diabete
mellito mellito
126 mg/dL 7,0 mmol/L 200 mg/dL 11,1 mmol/L
IFG IGT
100 mg/dL 5,6 mmol/L 140 mg/dL 7,8 mmol/L
Normale Normale
About 50% of cases convert from NFG/NGT to diabetes
in less than 5 years
Adattamento dal rapporto di follow-up di The Expert Committee on the Diagnosis and Classification of
Diabetes Mellitus. Diabetes Care 2003;26:3160–3167You can also read