An agent based algorithm resembles behaviour of tree dwelling bats under fission-fusion dynamics - Nature
←
→
Page content transcription
If your browser does not render page correctly, please read the page content below
www.nature.com/scientificreports
OPEN An agent‑based algorithm
resembles behaviour
of tree‑dwelling bats
under fission–fusion dynamics
Ján Zelenka1, Tomáš Kasanický1, Ivana Budinská1 & Peter Kaňuch 2*
Utilization of computational approach in the study of social behaviour of animals is increasing and
we attempted such an approach in our study of tree-dwelling bats. These bats live in highly dynamic
fission–fusion societies that share multiple roosts in a common home range. The key behavioural
component associated with complex and non-centralized decision-making processes in roost
switching is swarming around potential locations in order to recruit members to the new roost. To
understand roost switching dynamics of bat groups in their natural environment, we employed a
computational model, the SkyBat, which is based on swarm algorithm, to model this process. In a
simulated environment of this agent-based model, we replicated natural fission–fusion dynamics of
the Leisler’s bat, Nyctalus leisleri, groups according to predefined species and habitat parameters.
Spatiotemporal patterns of swarming activity of agents were similar to bats. The number of simulated
groups formed prior to sunrise, the mean number of individuals in groups and the roost height did
not differ significantly from data on a local population of bats collected in the field. Thus, the swarm
algorithm gave a basic framework of roost-switching, suggesting possible applications in the study of
bat behaviour in rapidly changing environments as well as in the field of computer science.
Group living has numerous energetic and social benefits for a nimals1,2. The survival rate of bats primarily
increases through communal breeding and offspring rearing3. Bats living in social groups depend strongly on the
protective function and microclimatic suitability of daily roosts4, with a significant proportion of more than 1400
species worldwide roosting in cavities of trees5–7. Maternity groups of most of tree-dwelling bat species change
their roosts every couple of days, and the distance between two such roosts may exceed hundreds of metres in a
dense forest e nvironment8–14. While bats have perfect homing abilities and complex spatial o rientation15, group
3
membership in tree-dwelling species often alternates after evening emergence . As a result, these bats live in
highly dynamic fission–fusion societies in which they split up and rejoin larger or smaller groups of conspecifics,
sharing multiple roosts in the common home range16–21.
Tree hollows excavated by woodpeckers or even more ephemeral shelters beneath loose bark provide limited
room for maternity groups of tree-dwelling bats, especially considering their rapid doubling in size after the
births of pups in midseason5. Therefore, frequent shuffling of adult females and their offspring among groups
maintains long-term social relationships within their c olony3,22. Tree roost characteristics are in relationship
with ambient c onditions23, thus roost switching ensures also microclimate that is most conducive to successful
reproduction24–26. This behaviour also reduces parasites in the cavities, minimizes commutes and competition
with other cavity dwellers and protects against predators that can deplete bat colonies if shelters are occupied
for a longer time18,26–28.
The key behavioural component associated with roost switching and roost-mate recruitment in tree-dwelling
bats is a swarming behaviour in which individuals eavesdrop on calls of conspecifics at multiple roosts within
the colony home range (In order to make terminology clear, the more common use of the term swarming in bat
biology is associated with pre-hibernation mating behaviour. In our case we refer to so-called ‘dawn swarming’29).
Colony members perform a set of characteristic flight displays accompanied by social vocalisation and calls
with long-distance propagation attributes in front of potential roosting sites, beginning at night and reaching its
1
Institute of Informatics, Slovak Academy of Sciences, 845 07 Bratislava, Slovakia. 2Institute of Forest Ecology,
Slovak Academy of Sciences, 960 53 Zvolen, Slovakia. *email: kanuch@netopiere.sk
Scientific Reports | (2020) 10:16793 | https://doi.org/10.1038/s41598-020-72999-0 1
Vol.:(0123456789)
www.nature.com/scientificreports/
number of cavities cavity height (m)
10 30 50 70 90 5.0 7.0 9.0 11.0 13.0
(a) (b) (c)
1500
1000
distance (m)
500
0
Leisler’s bat
0 500 1000 1500 0 500 1000 1500
distance (m) distance (m)
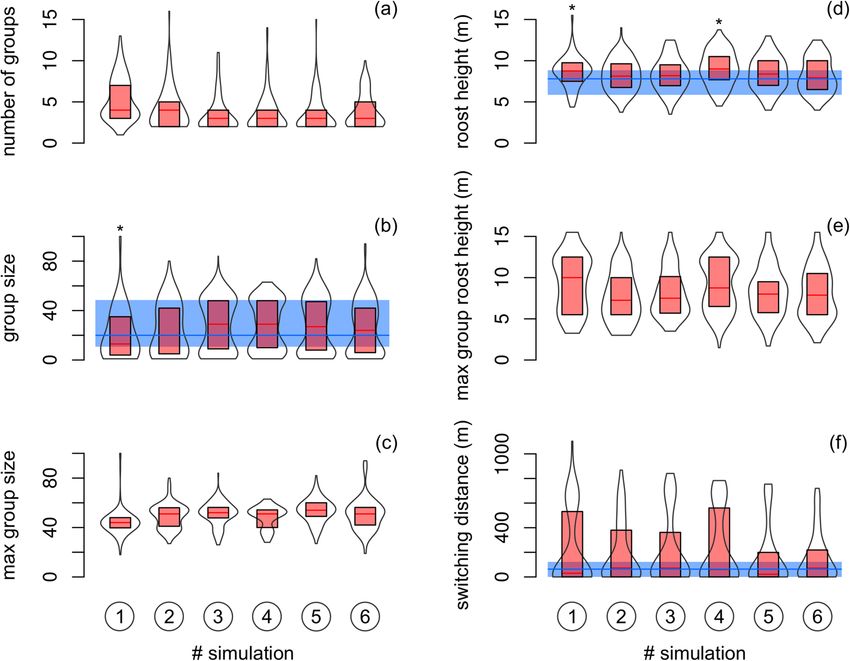
Figure 1. (a) A female of tree-dwelling Leisler’s bat, Nyctalus leisleri, from the study population. Photo credit:
Peter Kaňuch. (b) The number of tree cavities and (c) the mean elevation of cavity entrance above the ground in
the old pastured oak woodland. Population size was estimated to ~ 100 adult females in this area.
peak at d awn30–37. This unique behavioural mechanism is believed to drive the collective selection of new roosts
from a large set of potential roosting sites. A simplified process of roost switching includes disintegration of the
former group during foraging along with an individual search for a roost, swarming around potential locations
in order to recruit other members and to select a new roost once the number of gathered mates is acceptable.
Thus, roost switching is a multi-factorial task in which each bat evaluates the size of their group, quality of the
roost, and remaining time to f eed5,36,38.
This decision-making process observed in roost switching in tree-dwelling bats suggests a computational
algorithm, a set of rules that defines a sequence of instructions to rule cooperation in a multi-agent system.
Modern computational approaches to the study of social behaviour of animals are increasingly used and this
emerging field provides many similar agent-based models today39–42 even in social behaviour of bats43–46. The first
agent-based model that attempted to simulate roost switching in tree-dwelling bats using biologically relevant
data was run by Ruczyński and Bartoń38. The model based on predefined assumptions has found that the bats
that were successful in finding roosts were mainly those possessing accurate tree discrimination, i.e. the ability
to quickly and effectively assess trees for suitability, whereas bats without this ability instead used the tactic of
eavesdropping on swarming conspecifics in large groups. Another data-driven modeling of group formation
in the fission–fusion dynamics of bats worked on a system of roosts of fixed characteristics with accounted
pair-specific social influence47. However, it is questioning how collective decision is made under variable roost
conditions and unstable social relationships. Deficiencies of previous models may be solved with the use of
the swarm algorithm SkyBat, inspired by fission–fusion societies of bats48,49. Among the unique features of
this computational algorithm is the ability to perform group movement without a need of individually specific
exploration behaviour and social influence while searching for new targets of interest and hence an ability to
perform flexible, non-centralized group decision-making in rapidly changing environments. Thus, the SkyBat
model does not emphasise individual tree discrimination ability because tree roosts are ephemeral, and suit-
ability of a cavity may change quickly during the course of s eason14,18,21,50. Moreover, this model assumes that
each bat regardless of its relationships with other members must find a group in a suitable roost within a certain
time limit for activity, which enables the algorithm to comprehend and simulate roost switching dynamics of
bat groups in their natural environment.
In this study, we aimed to test the robustness of the SkyBat algorithm, specifically its ability to replicate natu-
ral fission–fusion dynamics of bat groups in specific conditions. We adjusted the first version of this model48
and fed the algorithm according to the set of basic rules and properties of bat movement, group sizes, roosting
preferences and swarming behaviour observed in the field. This led us to simulate roost switching behaviour of
tree-dwelling Leisler’s bats, Nyctalus leisleri, in a defined time frame and environment akin to real roosting areas.
Material and methods
Field data collection. In order to obtain natural data that could be compared with our computer simula-
tions, we studied a population of the Leisler’s bat, Nyctalus leisleri, breeding in old pastured oak woodland in
Gavurky Protected Area (Pliešovská Kotlina Basin, central Slovakia; N48° 27′ 50.906″, E019° 7′ 48.534″; 460 m
a.s.l.). This species is a medium-sized (body mass 13–18 g), insectivorous, migratory vespertilionid bat (Fig. 1a)
inhabiting a predominantly forested landscape in a temperate zone throughout most of Europe50. Their breed-
ing season is between May and August, during which maternity groups of adult females and their young switch
their tree roosts every few d ays11,36. Groups roosting in tree cavities in Gavurky were found by radio-tracking or
Scientific Reports | (2020) 10:16793 | https://doi.org/10.1038/s41598-020-72999-0 2
Vol:.(1234567890)www.nature.com/scientificreports/
by search during dawn swarming with the help of a bat detector, and they were censused at evening emergence,
supplemented by harp-trapping and individual banding. During long-term field observation from 2003 to 2014,
we collected data on spatial distribution of bats’ roosts, group size, elevation of cavity entrance above the ground
(hereafter cavity or roost height) and distance travelled during group roost switching (for details see35,36,51–54).
All methods were carried out in accordance with relevant guidelines and regulations. All experimental protocols
were approved by the Ministry of Environment of the Slovak Republic.
Agent‑based model settings. Bats. According to our field observations, a conservative estimation of
the local population size was one hundred individual bats. Using this data, we designed a comparable number of
agents in the model to replicate generic individuals of the Leisler’s bat group, including characteristics regarding
species-specific flying, foraging and behaviour. This model only simulates adult females in groups without juve-
niles (which are typically delivered midseason), though newly volant offspring do roost with their m others16,19,20.
Agents moved within the simulated environment by highly correlated random walk, following nearly linear
path. The direction and flight speed of an agent at each step was randomly chosen within predetermined limits.
To maintain biological relevance, the values for flight speed were derived using roughly Poisson distribution
with a minimum flight speed of 2.5 m s−1 (the take-off velocity in similar sized s pecies55), a median of 3.7 m s−1
and a maximum of 11.1 m s−156. Movement of bats was described by the following equation:
v m (t) = v d (t) + v s (t) (1)
where vm is a bat movement vector, vd is the distance travelled by random speed and vs is random vector of the
swerve (Fig. S1 of Supplementary Information). To detect a cavity, we set the field of perception (FoP) of bat
agents at an angle of 270° and a distance of 150 m in accordance with structural characteristics of echolocation
calls of the s pecies50. To avoid the counter effect of atmospheric attenuation, bats usually tune to lower frequen-
cies that are more resistant but energetically very c ostly57. We estimated that the low frequency calls of Leisler’s
bats during swarming are audible to other eavesdropping individuals at a distance of 80–100 m (Dattr). Swarming
agents that were attracting roost-mates made such calls in a variable radius Dattr around the cavity in order to
lure in any individuals randomly passing this circle.
Environment. For roost switching simulations, we designed an area of 128.2 ha (~ 900 × 1800 m) with a
3-dimensional configuration identical to habitat conditions in the field (x, y coordinates and z heights of 944
cavities available for roosts). This simplified habitat setting was considered sufficient because cavity density and
height are the primary determining factors in roost-site selection of tree-dwelling b ats6,10,11,25,54. In a hexagonal
grid divided into 37 equal cells, density of cavities ranged from 8 to 92 per a cell (Fig. 1b) and mean cavity height
from 4.8 to 13.5 m (Fig. 1c). This roosting habitat was centralized in a square plane (9000 × 9000 m). The total
dimensions of our simulation environment were set with respect to the possible distance the species might travel
while foraging50.
In general, this species prefers higher tree roosts10,11,25,54. On the other hand, it should avoid roosts infested
by parasites18,26; therefore, excrements were used as a proxy of the load of parasites associated with g uano28.
The quality of a roost (QR), thus the attractiveness of a tree cavity for roosting, was expressed by the equation:
100 ∗ CH i
QRi (t) = ∗ wCH + ((−1 ∗ (LE(t) − 100)) ∗ wLE ) (2)
max (CH)
i
where CH was cavity height, LE was the load of excrements (0–100) and w was the weight of the cavity height or
load of excrements. In this simulation, both weights were set by default to 0.5. With each second of simulation,
the value of LE increased by 5 × 10⁻⁵ times the number of bats in a roost during the course of a day. Effect of
excrements decreased by a value of 10 if the cavity was empty (until zero) and increased by 0.1 times the number
of bats in occupied roosts (until 100).
Temporal settings. The length of a season was set to 120 days, which should cover the full breeding period of
the species in the study area. This period begins in early May when adult females arrive from hibernacula in
southern Europe, and it ends in late August when offspring leave the maternity colony as the colony breaks apart.
For the sake of simplicity of computation, we did not consider seasonal variation in the daytime. The length of
time available to study the species with nocturnal and crepuscular activity outside the roost was fixed to eight
hours per day (one cycle), which is an average nighttime during the summer at this latitude. One simulation step
in the cycle was equal to 1 s, with 28,800 steps per cycle in total. In the beginning of the simulation, the whole
group was located in one randomly chosen roost. After evening emergence from this roost, a foraging period
began, which might vary from two to three hours per individual. During this period, bats were foraging within
the total area of the environment, neither interacting with the environment nor with each other. This ensured
that all agents were haphazardly distributed within the environment before the swarming period, which can take
most of the night36.
Model interactions. Model agents implemented a non-centralized group decision process in which the group
searched for a new roost based on their quality and attracted other roost-mates to form a suitable group. Bats
often leave roosts when directly attacked by predators26, thus at the same time, groups worked to eliminate pre-
istance10,27.
dation risks that was expected higher if roost switching is over a short d
Scientific Reports | (2020) 10:16793 | https://doi.org/10.1038/s41598-020-72999-0 3
Vol.:(0123456789)www.nature.com/scientificreports/
bat is flying to new cavity bat is signalling at a roost
or to roost attracted by during tattr or teattr
other bats in distance Dattr
3 1
cavity does not have
required quality QR
t > 4:00, ri = the last roost bat is in roost attracted by other bats,
bat is searching
for roost ri 2 0 GST threshold is reached
or t > 4:00
roost is not attracted by other bats
or does not have required quality
t = 20:00
4
bat is foraging, t > 20:00 < 23:00
Figure 2. State diagram of an agent-based behavioural model designed for finding a suitable roost for a bat
group under fission–fusion dynamics (0 – bat is in the roost; 1 – bat is signalling the roost to other bats; 2 – bat
is searching for roost; 3 – bat is flying to new cavity or to attracted roost; 4 – bat is foraging).
At the end of each foraging period, agents selected one roost from the set of cavities located within their FoP.
Once the QR was satisfactory (QR > 30), the individual would begin signalling to attract potential group mem-
bers by swarming around the cavity. A roost with at least one signaller already swarming around it had a higher
probability that another agent, a receiver or non-signaller, would select it, if this occurred within the Dattr buffer.
Receivers locating multiple roosts within the Dattr area would select the roost with the largest number of signallers.
The length of time (tattr) the signaller spent at a roost in order to attract other agents was calculated as follows:
1000
tattr (t) = CH 2i + 1 + NRB(t) + (3)
TTS
where CH was cavity height, NRB was the number of bats in the roost and TTS was time to sunrise. The length
of additional time (teattr) for signalling primarily depended on the number of other co-swarming bats and was
calculated as follows:
NSB2 (t)
teattr (t) = (4)
2
where NSB was the number of signalling bats swarming at the roost. After this time, the signaller would enter
the roost and remained inside as long as another signaller was still attracting new roost-mates or, if the group
had already reached threshold size (GST), until the next evening emergence. This was expressed by the equation:
b t ∈ �0, o�
GST(t) =
b − (b−a)∗(t−o) t ∈ �o, Tsim � (5)
Tsim −t
where the a and b parameters represented the minimum and maximum values of group size (10 and 100 indi-
viduals, respectively, in the simulated population), Tsim was the time of simulation cycle and o was the time (set to
midnight) when the signalling agents’ efforts into increasing the group size began decreasing. Once the signalling
time reached defined limits and the group size did not reach required GST, all bats left their cavity and began
searching for other roosts either as signallers or receivers.
Our model also acknowledged the role of bats’ memory in the decision-making process. Signalling the
same roost or nearby roosts repeatedly over multiple nights was thus penalized because of the higher risk of
predation10,27. This penalization was implemented on roosts within a 0 to 150 m radius around the roost. The
distance (PD) that penalized repeated selection of the actual location increased with time, while PD for previously
used roosts decreased (Fig. S2 of Supplementary Information). Thus, inspection of a cavity that did not already
have a signaller (control of QR) depended on a number of hypotheses. In general, these hypotheses considered
distances to formerly occupied roosts that related to predation risk (details in Table S1 of Supplementary Infor-
mation). If an agent did not find a new roost prior to sunrise (< 5 min), it would have to enter its most recent
roost. The final model of bat behaviour is illustrated in the state diagram (Fig. 2).
Running of simulations. The process of construction and adjustments of the agent-based model was per-
formed in the MATLAB (MathWorks, Inc) programming software (the Matlab code is in the Code file of Sup-
plementary Information). Simulation of the behaviour of 100 agents using 3,456,000 steps (one season) was
Scientific Reports | (2020) 10:16793 | https://doi.org/10.1038/s41598-020-72999-0 4
Vol:.(1234567890)www.nature.com/scientificreports/
1500
1000
distance (m)
500
0
0 500 1000 1500 0 500 1000 1500 0 500 1000 1500
distance (m) distance (m) distance (m)
foraging
roosting
swarming
sunset midnight sunrise sunset midnight sunrise sunset midnight sunrise
Figure 3. Simulated foraging trajectory (small points) and swarming around tree roosts (open circles) of three
random agents (bats) during a single night in an area with properties as in Fig. 1. Density plots also denote time
when bats were roosting in cavities.
repeated six times to explore variations in simulated outputs. Simulation of one season using a desktop platform
with Intel Xeon CPU W3670 3.20 GHz, 6 GB RAM lasted approximately 30 h.
Statistical analyses. The output of the simulation was a list of daily occupied cavities with relevant group
sizes as was found when bats’ roost switching activity was completed (t > 4:00). We paid close attention to roosts
occupied by maximum groups, which comprise the highest number of individuals on a particular day, as those
roosts should reflect the main patterns in roost site preference during the season.
Due to varying sampling techniques, providing either full (simulated data) or random (field data) evidence,
and need for credible comparison of spatial patterns, we compared only locations of maximum groups in the
simulations with roosts found in the field during the long-term study. We were confident that the field data set
would also depict locations of the most preferred roosts of bats in the study area. With no need for concern
about statistical concepts of randomness, uniformity and clustering, statistical comparison of the similarity of
two such point patterns was made by an area-based nonparametric spatial point pattern t est58 using a package
‘sppt’ 0.2.159 of the R 3.6.3 environment for statistical c omputing60. To avoid possible overestimation of patterns’
similarity, we used the robust global S-values as a similarity index. The S-values were calculated only considering
the number of hexagonal grid cells dividing the area that had roosts presently occurring within them, in either
the field or in simulated data sets.
Simulated data such as group size, roost height and roost switching distance were compared with field col-
lected values (n = 31 groups, 35 roosts, 21 switching events), though we were unable to compare other param-
eters obtained from simulations (reported only) due to a lack of evidence from the field. We calculated both
unstandardized and standardized mean differences (Hedge’s g) between the simulated and observed natural
data with 95% confidence intervals using the R packages ‘rcompanion’ 2.3.2561 and ‘effsize’ 0.8.062, respectively.
The magnitude of standardized effect size was assessed using the thresholds by Cohen63. Values of simulated
and field sampling were compared also by a rank-based nonparametric Mann–Whitney U test using the core R
package ‘stats’ 3.6.360. Note that the switching distance in simulated data was based on maximum group roosts,
whereas in field data it was based on harp-trapping of banded individuals. However, both methods considered
switching between two consecutive days.
Results
Individual movement and spatiotemporal distribution of swarming activity of simulated agents was highly vari-
able (Fig. 3). However, simulated locations of roosts where groups were formed had very similar and often even
identical spatial patterns to the locations of roosts observed in the field. For six independent simulations, the
Scientific Reports | (2020) 10:16793 | https://doi.org/10.1038/s41598-020-72999-0 5
Vol.:(0123456789)www.nature.com/scientificreports/
1 2 3
4 5 6
Figure 4. Spatial distribution of tree roosts (red crosses) of maximum groups, which could form from 100
possible agents during the six independent simulations of 120 days each. The number of agents and number of
days were set to mimic natural population size of the Leisler’s bat in the area and the length of breeding season,
respectively. Distribution of simulated roosts was compared with observed natural roosts (blue crosses) by an
area-based nonparametric spatial point pattern test. Red cells of hexagonal grid refer to statistically significant
increases (P < 0.05) of the number of simulated roosts, while blue cells refer to decreases (S, robust global index
of similarity).
robust global S-values ranged from 0.87 to 1.00. Significant differences (P < 0.05) were seldom identified at the
local level (Fig. 4). The majority of both simulated and field-observed roosts were located in the areas (hexagonal
cells) of the highest density of available tree cavities (Fig. 1b).
The median number of simulated groups per day was 3 (total range of 1–16 of six independent simulations).
The median size of such groups was 22 (1–100) individuals. The maximum group formed at the end of bats’
roost switching activity was about 51 (18–100) individuals. The median roost height was 8.5 (3.5–15.5) meters.
Similarly, the roost height of maximum groups was about 8.3 (1.5–15.5) meters. Simulated switching distance
had median 49 (range 0–1103) meters (Fig. 5). Simulated group size was in average 1.3–10 individuals smaller
comparing to field data (total range of 95% CI was from – 17.5 to 5.8). The mean difference in simulated and
observed roost height and switching distance was about 0.2–1.0 m (95% CI from – 0.4 to 1.7) and 58–133 m
(95% CI from – 9 to 183), respectively. However, the magnitude of effect size in standardized mean differences
between simulated and observed data was assessed as either small or even negligible (Table 1). Similarly to the
effect size statistics, rank-based test indicated that simulated group size, roost height and switching distance
differed from values observed in the field only seldom (Fig. 5).
Discussion
In the presented agent-based model, both the daily and seasonal patterns of swarming activity of agents resem-
bled bats in their natural e nvironment35,36. Incorporating selected parameters of the species and its environment,
the SkyBat swarm a lgorithm48,49 competently replicated natural fission–fusion dynamics of tree-dwelling bat
groups in predefined conditions. The low variation of means of computing data in six independent replications
confirmed that the computational algorithm that processed biological input information produced consistent
results. The most important outputs, which allowed us to evaluate the characteristics of agents’ fission–fusion
Scientific Reports | (2020) 10:16793 | https://doi.org/10.1038/s41598-020-72999-0 6
Vol:.(1234567890)www.nature.com/scientificreports/
Figure 5. (a) Number of groups, (b, c) sizes of groups, (d, e) heights of roosts and (f) the distance between two
roosts that were occupied by the maximum group in two consecutive days in the six independent simulations.
Simulated data (violin plots show medians and 25–75% quartiles in box with rotated kernel density estimation)
were compared with observed data from the natural population (horizontal median line with 25–75% quartiles)
if allowed. Significant differences (P < 0.05) by the Mann–Whitney U test are denoted by asterisks.
behaviour, were the final number of simulated groups formed prior to the end of each simulation cycle (sunrise
in the field) and the mean and maximum numbers of individuals in groups with respect to the local population
size. This data did not differ significantly from the field data on Leisler’s bats collected during the long-term study
in the Gavurky population (Table 1, Figs. 4 and 5).
Agents in the simulations behaved similarly to their biological source of inspiration, as groups selected cavity
entrances more than 7.5 m above the ground, significantly higher than the average of available cavities in the
study habitat53. For the study species, such roosting strategy suits reduced wing loading and lift-to-drag r atio64.
Additionally, this strategy ensures required thermal conditions of roosts due to benefits arising from greater
exposure of cavity to s unlight4,24,25 and reduces the risk of predation from the ground10. Furthermore, even
switching distance between roosts was very similar to our field observations, and therefore we may consider
simulation outputs as entirely plausible. Thus, our study confirmed that this algorithm is able to rule out a flexible
non-centralized group decision while resolving multiple individual tasks during roost switching of tree-dwelling
bats in a cluttered environment5,36,38. However, besides species-specific modeling of fission–fusion behaviour
in bats, a more general implication of our findings could be for understanding of social dynamics that brings
together different disciplines in a complex. We may thus study better interactions of individual group members
as well the relationship between individual interactions and group level b ehaviours65.
Utilization of this modern computational approach in the study of dawn swarming behaviour of tree-dwelling
bats is largely unknown. We are fully aware of very complex social behaviour and cognitive abilities of bats22, and
our pioneering study can illuminate only a basic framework of the dynamic system of roost switching. We also
did not account yet for the effect of additional variation in biological information at an individual level (e.g., age,
relatedness, fitness, hormonal secretion) and how that data would improve the model, but our case study is vital
for understanding the roost switching of bat groups in a rapidly changing environment. Together with changed
characteristics of roosts, one of the proximate factors shaping fission–fusion dynamics are indeed ambient condi-
tions as females are more likely to switch roosts at high temperatures while less when it r ained23,26. Further, for
example, by modelling specific conditions of the species’ forest habitat, one can also predict the response of the
local population to logging practice or altered food supply. We therefore suggest that the SkyBat can be employed
as a tool for biological conservation.
Scientific Reports | (2020) 10:16793 | https://doi.org/10.1038/s41598-020-72999-0 7
Vol.:(0123456789)www.nature.com/scientificreports/
Simulation Difference 95% CI Hedge’s g 95% CI Magnitude
Group size [Individuals]
1 – 10.0 – 17.5 – 2.5 – 0.49 – 0.85 – 0.13 Small
2 – 6.2 – 13.4 1.1 – 0.31 – 0.67 0.06 Small
3 – 1.3 – 8.3 5.8 – 0.06 – 0.43 0.31 Negligible
4 – 2.0 – 9.2 5.2 – 0.10 – 0.47 0.26 Negligible
5 – 1.8 – 8.8 5.2 – 0.08 – 0.44 0.28 Negligible
6 – 4.1 – 11.2 3.0 – 0.19 – 0.56 0.17 Negligible
Roost height [m]
1 0.7 0.0 1.3 0.31 – 0.07 0.69 Small
2 0.2 – 0.4 0.8 0.10 – 0.27 0.48 Negligible
3 0.3 – 0.3 0.9 0.13 – 0.25 0.51 Negligible
4 1.0 0.5 1.7 0.47 0.09 0.85 Small
5 0.4 – 0.2 1.0 0.17 – 0.21 0.55 Negligible
6 0.2 – 0.4 0.8 0.09 – 0.29 0.47 Negligible
Switching distance [m]
1 118 71 165 0.39 – 0.23 1.02 Small
2 88 29 146 0.37 – 0.26 0.99 Small
3 112 60 164 0.41 – 0.21 1.03 Small
4 133 83 183 0.47 – 0.15 1.09 Small
5 62 4 120 0.26 – 0.36 0.88 Small
6 58 –9 126 0.30 – 0.32 0.92 Small
Table 1. Mean difference between simulated and observed data in original unites and standardized measure
of the effect size (Hedge’s g). Both effect size statistics have shown lower and upper limits of 95% confidence
intervals. The magnitude of effect size is assessed using the thresholds by C ohen63.
Results of this interdisciplinary study also suggest possible applications of the algorithm not only in bat
ecology but also in the fields of computer science and artificial intelligence. In all fairness, besides other bio-
inspired, swarm-based computational algorithms characterized by convergent social phenomena in different
animals, a bat algorithm with derivates has already been described66. Although this computational algorithm
has the unique ability to solve complex problems67–70, its formal description was solely inspired by echolocation
properties during group foraging. The grouping mechanism in foraging individuals is completely different from
group roosting, while group foraging is associated with even less investigated reasons for sociality in b ats71,72.
The most important features of a swarming algorithm applied in the SkyBat model are its ability to find a solu-
tion in a limited time and its independence from the environment and specific relationships among individuals.
A derivative of the SkyBat algorithm was successfully tested as a searching algorithm in a field of i nformatics49.
Furthermore, a highly potential candidate for utilization of the SkyBat is swarm robotics, a relatively new bio-
inspired approach that aims to coordinate a large number of autonomous robotic agents in searching for specific
targets of interest and moving groups from one location to another without a leader73. Thus, the coordination
among robotic agents is achieved in a self-organised manner where their collective behaviour is a result of local
interactions among them and between them and their environment. This is directly comparable to fission–fusion
dynamics in social groups of tree-dwelling bats.
Data availability
The data sets generated and analysed in the study are available from the corresponding author upon request.
Received: 11 June 2020; Accepted: 9 September 2020
References
1. Rood, J. P. Group size, survival, reproduction, and routes to breeding in dwarf mongooses. Anim. Behav. 39(3), 566–572 (1990).
2. Kokko, H., Johnstone, R. A. & Clutton-Brock, T. H. The evolution of cooperative breeding through group augmentation. Proc. R.
Soc. B 268(1463), 187–196 (2001).
3. Kerth, G. Causes and consequences of sociality in bats. Bioscience 58(8), 737–746 (2008).
4. Kunz, T. H. Roosting ecology of bats in Ecology of bats (ed. Kunz, T. H.) 1–55 (University of Chicago Press, Chicago, 1982).
5. Kunz, T. H. & Lumsden, L. F. Ecology of cavity and foliage roosting bats in Bat ecology (eds. Kunz, T. H. & Fenton M. B.) 3–89
(University of Chicago Press, Chicago. 2003).
6. Lacki, M. J. & Baker, M. D. A prospective power analysis and review of habitat characteristics used in studies of tree-roosting bats.
Acta Chiropterol. 5(2), 199–208 (2003).
7. Naďo, L. & Kaňuch, P. Roost site selection by tree-dwelling bats across biogeographical regions: an updated meta-analysis with
meta-regression. Mammal Rev. 45(4), 215–226 (2015).
8. Barclay, R. M. R., Faure, P. A. & Farr, D. R. Roosting behaviour and roost selection by migrating silver-haired bats (Lasyonycteris
noctivagans). J. Mammal. 69(4), 821–825 (1988).
9. Lewis, S. E. Roost fidelity of bats: a review. J. Mammal. 76(2), 481–496 (1995).
Scientific Reports | (2020) 10:16793 | https://doi.org/10.1038/s41598-020-72999-0 8
Vol:.(1234567890)www.nature.com/scientificreports/
10. Ruczyński, I. & Bogdanowicz, W. Roost cavity selection by Nyctalus noctula and N. leisleri (Vespertilionidae, Chiroptera) in
Białowieża Primeval Forest, eastern Poland. J. Mammal. 86(5), 921–930 (2005).
11. Ruczyński, I. & Bogdanowicz, W. Summer roost selection by tree-dwelling bats Nyctalus noctula and N. leisleri: a multiscale analysis.
J. Mammal. 89(4), 942–951 (2008).
12. Lučan, R. K., Hanák, V. & Horáček, V. Long-term re-use of tree roosts by European forest bats. For. Ecol. Manag. 258(7), 1301–1306
(2009).
13. Kuhnert, E., Schonbachler, C., Arlettaz, R. & Christe, P. Roost selection and switching in two forest-dwelling bats: implications
for forest management. Eur. J. Wildl. Res. 62(4), 497–500 (2016).
14. Dietz, M., Brombacher, M., Erasmy, M., Fenchuk, V. & Simon, O. Bat community and roost site selection of tree-dwelling bats in
a well-preserved European lowland forest. Acta Chiropterol. 20(1), 117–127 (2018).
15. Jensen, M. E., Moss, C. F. & Surlykke, A. Echolocating bats can use acoustic landmarks for spatial orientation. J. Exp. Biol. 208(23),
4399–4410 (2005).
16. Kerth, G. & Reckardt, K. Information transfer about roosts in female Bechstein’s bats: an experimental field study. Proc. R. Soc. B
270(1514), 511–515 (2003).
17. Kerth, G., Ebert, C. & Schmidtke, C. Group decision making in fission-fusion societies: evidence from two-field experiments in
Bechstein’s bats. Proc. R. Soc. B 273(1602), 2785–2790 (2006).
18. Reckardt, K. & Kerth, G. Roost selection and roost switching of female Bechstein’s bats (Myotis bechsteinii) as a strategy of parasite
avoidance. Oecologia 154(3), 581–588 (2007).
19. Metheny, J. D., Kalcounis-Rueppell, M. C., Willis, C. K. R., Kolar, K. A. & Brigham, R. M. Genetic relationship between roost-mates
in a fission-fusion society of tree-roosting big brown bats (Eptesicus fuscus). Behav. Ecol. Sociobiol. 62(7), 1043–1051 (2008).
20. Popa-Lisseanu, A. G., Bontadina, F., Mora, O. & Ibáñez, C. Highly structured fission-fusion societies in an aerial-hawking, car-
nivorous bat. Anim. Behav. 75(2), 471–482 (2008).
21. Rueegger, N., Law, B. & Goldingay, R. Interspecific differences and commonalities in maternity roosting by tree cavity-roosting
bats over a maternity season in a timber production landscape. PLoS ONE 13(3), e0194429 (2018).
22. Kerth, G., Perony, N. & Schweitzer, F. Bats are able to maintain long-term social relationships despite the high fission-fusion
dynamics of their groups. Proc. R. Soc. B 278(1719), 2761–2767 (2011).
23. Patriquin, K. J. et al. Weather as a proximate explanation for fission-fusion dynamics in female northern long-eared bats. Anim.
Behav. 122, 47–57 (2016).
24. Kerth, G., Weissmann, K. & König, B. Day roost selection in female Bechstein’s bats (Myotis bechsteinii): a field experiment to
determine the influence of roost temperature. Oecologia 126(1), 1–9 (2001).
25. Sedgeley, J. A. Quality of cavity microclimate as a factor influencing selection of maternity roosts by a tree-dwelling bat, Chalinolo-
bus tuberculatus, New Zealand. J. Appl. Ecol. 38(2), 425–438 (2001).
26. Patriquin, K. J. & Ratcliffe, J. M. Should I stay or should I go? Fission-fusion dynamics in bats in Sociality in bats (ed. Ortega, J.).
65–103 (Springer, New York, 2016).
27. Fenton, M. B. et al. Raptors and bats: threats and opportunities. Anim. Behav. 48(1), 9–18 (1994).
28. Lučan, R. K. Relationships between the parasitic mite Spinturnix andegavinus (Acari: Spinturnicidae) and its bat host, Myotis
daubentonii (Chiroptera: Vespertilionidae): seasonal, sex- and age-related variation in infestation and possible impact of the
parasite on the host condition and roosting behaviour. Folia Parasitol. 53(2), 147–152 (2006).
29. Barataud, M. Acoustic Ecology of European Bats. Species Identification and Studies of Their Habitats and Foraging Behavior (Biotope
Editions & National Museum of Natural History, Paris, 2015).
30. Russo, D., Cistrone, L. & Jones, G. Spatial and temporal patterns of roost use by tree-dwelling barbastelle bats Barbastella barbastel-
lus. Ecography 28(6), 769–776 (2005).
31. Chaverri, G., Gillam, E. H. & Vonhof, M. J. Social calls used by leaf-roosting bat to signal location. Biol. Lett. 6(4), 441–444 (2010).
32. Schöner, C., Schöner, M. & Kerth, G. Similar is not the same: Social calls of conspecifics are more effective in attracting wild bats
to day roosts than those of other bat species. Behav. Ecol. Sociobiol. 64(12), 2053–2063 (2010).
33. Furmankiewicz, J., Ruczyński, I., Urban, R. & Jones, G. Social calls provide tree-dwelling bats with information about the location
of conspecifics at roosts. Ethology 117(6), 480–489 (2011).
34. Gillam, E. H. & Chaverri, G. Strong individual signatures and weaker group signatures in contact calls of Spix’s disc-winged bat,
Throptera tricolor. Anim. Behav. 83(1), 269–276 (2012).
35. Naďo, L. & Kaňuch, P. Dawn swarming in tree-dwelling bats: an unexplored behaviour. Acta Chiropterol. 15(2), 387–392 (2013).
36. Naďo, L. & Kaňuch, P. Swarming behaviour associated with group cohesion in tree-dwelling bats. Behav. Proces. 120, 80–86 (2015).
37. Gillam, E. H., Chaverri, G., Montero, K. & Sagot, M. Social calls produced within and near the roost in two species of tent-making
bats, Dermanura watsoni and Ectophylla alba. PLoS ONE 8(4), e61731 (2013).
38. Ruczyński, I. & Bartoń, K. A. Modelling sensory limitation: the role of tree selection, memory and information transfer in bats’
roost searching strategies. PLoS ONE 7(9), e44897 (2012).
39. Couzin, I. D., Krause, J., Franks, N. R. & Levin, S. A. Effective leadership and decision-making in animal groups on the move.
Nature 433(7025), 513–516 (2005).
40. Strandburg-Peshkin, A., Farine, D. R., Couzin, I. D. & Crofoot, M. C. Shared decision-making drives collective movement in wild
baboons. Science 348(6241), 1358–1361 (2015).
41. Egnor, S. E. R. & Branson, K. Computational analysis of behavior. Annu. Rev. Neurosci. 39, 217–236 (2016).
42. Ilany, A. & Akcay, E. Social inheritance can explain the structure of animal social networks. Nat. Commun. 7(1), 1–10 (2016).
43. Paolucci, M., Conte, R. & Tosto, G. D. A model of social organization and the evolution of food sharing in vampire bats. Adapt.
Behav. 14(3), 223–238 (2006).
44. Witkowski, M. Energy sharing for swarms modeled on the common vampire bat. Adapt. Behav. 15(3), 307–328 (2007).
45. Mavrodiev, P., Fleischmann, D., Kerth, G. & Schweitzer, F. Data-driven modeling of leading-following behavior in Bechstein’s bats.
bioRxiv 1, 843938 (2019).
46. Ripperger, S. P. et al. Vampire bats that cooperate in the lab maintain their social networks in the wild. Curr. Biol. 29(23), 4139–4144
(2019).
47. Perony, N., Kerth, G. & Schweitzer, F. Data-driven modeling of group formation in the fission-fusion dynamics of Bechstein’s bats.
bioRxiv 1, 862219 (2019).
48. Zelenka, J., Kasanický, T., Budinská, I., Naďo, L. & Kaňuch, P. SkyBat: a swarm robotic model inspired by fission-fusion behaviour
of bats in advances in service and industrial robotics. RAAD 2018. Mechanisms and machine science 67 (eds. Aspragathos, N.,
Koustoumpardis, P. & Moulianitis, V.) 521–528 (Springer, New York, 2019).
49. Zelenka, J., Kasanický, T. & Budinská, I. A swarm algorithm inspired by tree-dwelling bats. Experiments and evaluations in advances
in service and industrial robotics. RAAD 2019. Advances in intelligent systems and computing 980 (eds. Berns, K. & Görges, D.)
527–534 (Springer, New York, 2020).
50. Dietz, C. & Kiefer, A. Bats of Britain and Europe (Bloomsbury Publishing, London, 2016).
51. Kaňuch, P., Krištín, A. & Krištofík, J. Phenology, diet, and ectoparasites of Leisler’s bat (Nyctalus leisleri) in the Western Carpathians
(Slovakia). Acta Chiropterol. 7(2), 249–258 (2005).
52. Kaňuch, P. & Ceľuch, M. Bat assemblage of an old pastured oak woodland (Gavurky Protected Area, central Slovakia). Vespertilio
11, 57–64 (2007).
Scientific Reports | (2020) 10:16793 | https://doi.org/10.1038/s41598-020-72999-0 9
Vol.:(0123456789)www.nature.com/scientificreports/
53. Naďo, L. & Kaňuch, P. Why sampling ratio matters: Logistic regression and studies of habitat use. PLoS ONE 13(7), e0200742
(2018).
54. Naďo, L., Chromá, R. & Kaňuch, P. Structural, temporal and genetic properties of social groups in the short-lived migratory bat
Nyctalus leisleri. Behaviour 154(7–8), 785–807 (2017).
55. Schutt, W. A. Jr. et al. The dynamics of flight-initiating jumps in the common vampire bat Desmodus rotundus. J. Exp. Biol. 200(23),
3003–3012 (1997).
56. Shiel, C. B., Shiel, R. E. & Fairley, J. S. Seasonal changes in the foraging behaviour of Leisler’s bats (Nyctalus leisleri) in Ireland as
revealed by radio-telemetry. J. Zool. 249(3), 347–358 (1999).
57. Dechmann, D. K. N., Wikelski, M., van Noordwijk, H. J., Voigt, C. C. & Voigt-Heucke, S. L. Metabolic costs of bat echolocation
in a non-foraging context support a role in communication. Front. Physiol. 4, 66 (2013).
58. Andresen, M. A. An area-based nonparametric spatial point pattern test: The test, its applications, and the future. Methodol. Innovat.
9, 1–11 (2016).
59. Steenbeek, W., Vandeviver, C. Andresen, M. A., Malleson, N. & Wheeler, A. sppt: spatial point pattern test. R package version 0.2.1.
https://github.com/wsteenbeek/sppt (2018).
60. R Core Team. R: A language and environment for statistical computing (R Foundation for Statistical Computing, 2020).
61. Mangiafico, S. rcompanion: functions to support extension education program evaluation. R package version 2.3.25. https://
cran.r-project.org/package=rcompanion(2020).
62. Torchiano, M. effsize: efficient effect size computation. R package version 0.8.0. https://cran.r-project.org/package=effsize (2020).
63. Cohen, J. A power primer. Psychol. Bull. 112(1), 155–159 (1992).
64. Hedenström, A. & Johansson, L. C. Bat flight: aerodynamics, kinematics and flight morphology. J. Exp. Biol. 218, 653–663 (2015).
65. Durlauf, S. & Young, P. Social Dynamics (MIT Press, Cambridge, 2001).
66. Yang X.-S. A new metaheuristic bat-inspired algorithm in Nature inspired cooperative strategies for optimization (NICSO 2010).
Studies in computational intelligence 284 (eds. Gonzales, J. R., Pelta, D. A., Cruz, C., Terrazas, G. & Krasnogor, N.) 65–74 (Springer,
New York, 2010).
67. Gandomi, A. H. & Yang, X.-S. Chaotic bat algorithm. J. Comput. Sci. 5(2), 224–232 (2014).
68. Taha, A. M., Chen, S.-D. & Mustapha, A. Multi-swarm bat algorithm. Res. J. Appl. Sci. Eng. Tech. 10(12), 1389–1395 (2015).
69. Jordehi, A. R. Chaotic bat swarm optimisation (CBSO). Appl. Softw. Comput. 26, 523–530 (2015).
70. Wang, G.-G., Chang, B. & Zhang, Z. A multi-swarm bat algorithm for global optimization. Conference: IEEE Congress on Evo-
lutionary Computation (CEC 2015). Sendai, Japan (2015).
71. Dechmann, D. K. N., Kranstauber, B., Gibbs, D. & Wikelski, M. Group hunting: a reason for sociality in molossid bats?. PLoS ONE
5(2), e9012 (2010).
72. Roeleke, M. et al. Landscape structure influences the use of social information in an insectivorous bat. Oikos 129(6), 912–923
(2020).
73. Binitha, S. & Sathya, S. S. A survey of bio-inspired optimization algorithms. Int. J. Softw. Comput. Eng. 2(2), 137–151 (2012).
Acknowledgements
We are grateful to L. Naďo for the inspiring and fruitful discussions about bat behaviour and for the assistance
with data collection. This research was funded by the Slovak Research and Development Agency (APVV-17-
0116) and the Scientific Grant Agency VEGA (2/0131/17).
Author contributions
P.K. conceived the idea of the study. J.Z., T.K. and I.B. designed the computer algorithm and ran simulations, and
P.K. compared simulated data with field observations. P.K. and J.Z. drafted the manuscript with valuable input
from T.K. All authors discussed the results and edited the manuscript.
Additional information
Supplementary information is available for this paper at https://doi.org/10.1038/s41598-020-72999-0.
Correspondence and requests for materials should be addressed to P.K.
Reprints and permissions information is available at www.nature.com/reprints.
Publisher’s note Springer Nature remains neutral with regard to jurisdictional claims in published maps and
institutional affiliations.
Open Access This article is licensed under a Creative Commons Attribution 4.0 International
License, which permits use, sharing, adaptation, distribution and reproduction in any medium or
format, as long as you give appropriate credit to the original author(s) and the source, provide a link to the
Creative Commons licence, and indicate if changes were made. The images or other third party material in this
article are included in the article’s Creative Commons licence, unless indicated otherwise in a credit line to the
material. If material is not included in the article’s Creative Commons licence and your intended use is not
permitted by statutory regulation or exceeds the permitted use, you will need to obtain permission directly from
the copyright holder. To view a copy of this licence, visit http://creativecommons.org/licenses/by/4.0/.
© The Author(s) 2020
Scientific Reports | (2020) 10:16793 | https://doi.org/10.1038/s41598-020-72999-0 10
Vol:.(1234567890)You can also read