AN OVERVIEW OF MENTAL HEALTH ISSUES FOR LATINO AND ASIAN IMMIGRANTS IN THE UNITED STATES - KIMBERLY ROTH, MHS, PHD CANDIDATE
←
→
Page content transcription
If your browser does not render page correctly, please read the page content below
An Overview of Mental Health Issues for Latino
  and Asian Immigrants in the United States

          Kimberly Roth, MHS, PhD Candidate

                DMH Noontime Seminar
                  February 21, 2018
                    Baltimore, MD
Outline
Terminology
Challenges
Why Study Immigrant Health?
o Immigrant Health Paradox
o Acculturation and related experiences
Examples
o Latinos: Acculturation and Disorder by Generational
Status
o Asians: Acculturation, Intergenerational Cultural
Dissonance and Alcohol Use
Caveats
Cultural Considerations
Service Use and Barriers to Care
© 2014, Johns Hopkins University. All rights reserved.Terminology
Immigrant
Latino vs. Hispanic
Subethnicity
o Country of origin, Ancestry
Nativity
o Generational Status
U.S. Census Bureau (2015, 2017);
Pew Research Center; Lim et al (2011)
© 2014, Johns Hopkins University. All rights reserved.Challenges in Studying
Immigrant Health
Measurement
o Changing definitions
o Lack of data
o Subgroup comparisons
Complex phenomena
o No agreement of operationalization
Politics
U.S. Census Bureau (2015, 2017);
Pew Research Center; Lim et al (2011)
© 2014, Johns Hopkins University. All rights reserved.Why Study Immigrant Health?
Immigration at highest rate since end of 19th
century
o US has more immigrants than any other country
o 13.4% of US population, up from 4.7% in 1970
Latinos are the largest and third-fastest growing
minority group
o 17.8% of total U.S. population (~57 million)
o 25% of population by 2060
o Largest foreign-born population
Asian Americans represent the fastest growing
racial population in the U.S.
o 5.6% of total U.S. population (~18 million)
o 2nd largest foreign-born population (~30%)
o Projected to be the largest by 2055
U.S. Census Bureau (2015, 2017);
Pew Research Center; Lim et al (2011)
© 2014, Johns Hopkins University. All rights reserved.Immigrant Health Paradox
Minority health disparities, with increased:
o Mortality
o Physical illnesses
o Smoking and alcohol-related problems
o Psychological distress
Foreign-born individuals exhibit decreased:
o Mortality
o Physical illnesses
o Substance use
Despite lower SES and other stressors associated
with minority status or immigration
Risk reaches (and often surpasses) US-born whites
after spending time in the US
© 2014, Johns Hopkins University. All rights reserved. (Lariscy, 2015; Ortega et al., 2000)Lifetime Prevalence of Disorder
in Latinos and Non-Hispanic Whites in the US, by ancestry
50 Puerto Rican
Cuban
40 Mexican
Other
Percent with Disorder
30 All Latinos
Non-Hispanic Whites
20
10
0
Depressive Anxiety Substance Use Any Disorder
Data from the NLAAS
DSM-IV Disorder Category
© 2014, Johns Hopkins University. All rights reserved. (Alegria et al., 2007)Lifetime Prevalence of Disorder
in Latinos and Non-Hispanic Whites in the US, by nativity
60
US-born Latino
50 Foreign-born Latino
Percent with Disorder
40 US-born White
Foreign-born White
30
20
10
0
Depressive Anxiety Substance Use Any Disorder
Data from the NLAAS DSM-IV Disorder Category
© 2014, Johns Hopkins University. All rights reserved. (Alegria et al., 2007)Lifetime Prevalence of Disorder
in Asians and Non-Hispanic Whites in the US, by ancestry
50
Chinese
Filipino
40 Vietnamese
Other
Percent with Disorder
30 All Asians
Non-Hispanic Whites
20
10
0
Depressive Anxiety Substance Use Any Disorder
Data from the NLAAS
DSM-IV Disorder Category
(Hong et al., 2014; Takeuchi et al., 2007;
© 2014, Johns Hopkins University. All rights reserved.
Alegria et al., 2007)Lifetime Prevalence of Disorder
in Asians and Non-Hispanic Whites in the US, by nativity
60
US-born Asian
50 Foreign-born Asian
Percent with Disorder
40 US-born White
Foreign-born White
30
20
10
0
Depressive Anxiety Substance Use Any Disorder
Data from the NLAAS DSM-IV Disorder Category
© 2014, Johns Hopkins University. All rights reserved. (Hong et al., 2014; Alegria et al., 2007)Lifetime Prevalence of Disorder
in Asians in the US, by Immigration Characteristic
0-5 yrs 6-10 yrs US-born =21 yrs 18-34 >=35
US-born
25.58
24.62 24.62 25.32 23.97
Percent with Disorder
16.62
15.69 14.97 15.87 15.16
12.59 12.76 13.29
Years in US Age at Immigration Generational Status
Data from the NLAAS
© 2014, Johns Hopkins University. All rights reserved. (Takeuchi et al., 2007)Unidimensional Model
Acculturation Accultured
New Culture
“… [encompasses] those
phenomena which result when
groups of individuals having different
cultures come into continuous first-
hand contact, with subsequent Not Accultured
changes in the original culture
patterns of either or both groups."
(Redfield, Linton & Herskovits, 1936, p.149) Bidimensional Model
Enculturation Accultured/ Bi-cultural
New Culture
“… the process of preserving the Assimilated
norms of the native group,
whereby individuals retain Marginalized Traditional/
identification with their ethnic not Accultured
cultures of origin.”
(Guarnaccia et al., 2007) Culture of Origin
© 2014, Johns Hopkins University. All rights reserved. (Lara et al., 2005)Related Experiences
Context of Exit
o Varies by subgroup
Experiences in the U.S.
o Discrimination
o Acculturative Stress
o Family Conflict / Intergenerational Dissonance
o Access to services
Similar yet different than refugees!
© 2014, Johns Hopkins University. All rights reserved.Latinos: Acculturation and Disorder by Generational Status
Acculturative Experiences by
 Generational Status
                            92.8   91.8
                                                                          84.6
                   81.9
                                                               77.6
                                                      74.2
Percent

                                                                                                                                  57.9
                                               54.9                                                                        54.9          53.7

                                                                                                                    40.7

                                                                                             30.8

           18.2

                                                                                                         9.3

            GOOD/EXCELLENT                       DISCRIMINATION                            MEDIUM/HIGH               FAMILY CONFLICT
          ENGLISH PROFICIENCY                                                           ACCULTURATIVE STRESS
                  1st Generation                 1.5 Generation                             2nd Generation        3rd Generation
                          All differences p
Past 12-Month Disorder
Prevalence by Generational Status
22.7
19
17
Percent
15.4
13.4
12.6
10.7 11.2 10.9
9.4 9 9.2
5.2 5.3
0.9
1.6
ANY DEPRESSIVE ANY ANXIETY DISORDER ANY SUBSTANCE USE ANY DISORDER
DISORDER DISORDER
1st Generation 1.5 Generation 2nd Generation 3rd Generation
All differences pAdjusted Relative Odds of Past
12-Month Depressive Disorder
1st Generation 1.5 Generation 2nd Generation 3rd Generation
(n=1,257) (n=365) (n=522) (n=397)
English Proficiency
Good/Excell vs.
-- 1.24 (0.42-3.65) -- --
None/Poor
Discrimination
Ever vs. Never -- 12.6 (1.63-97.1)* -- 2.75 (0.78-9.72)
Acculturative Stress
Med/High vs.
1.71 (1.12-2.60)* -- n/a‡ n/a‡
None/Low
Family Conflict
Ever vs. Never 2.40 (1.60-3.61)** 1.67 (0.68-4.11) 3.05 (1.46-6.39)** 1.54 (0.80-2.94)
All models adjusted for for age at interview and sex. Some adjusted for martial status, education, and ancestry/nationality.
*pAdjusted Relative Odds of Past
12-Month Anxiety Disorder
1st Generation 1.5 Generation 2nd Generation 3rd Generation
(n=1,257) (n=365) (n=522) (n=397)
English Proficiency
Good/Excell vs.
-- -- -- --
None/Poor
Discrimination
Ever vs. Never 1.29 (0.84-1.97) 14.6 (1.93-110)* 2.98 (1.12-7.92)* 2.28 (0.75-6.96)
Acculturative Stress
Med/High vs.
1.95 (1.29-2.94)** -- n/a‡ n/a‡
None/Low
Family Conflict
Ever vs. Never 2.00 (1.35-2.96)** 1.67 (0.78-3.58) 2.84 (1.44-5.60)* --
All models adjusted for for age at interview and sex. Some adjusted for martial status, education, and ancestry/nationality.
*pAdjusted Relative Odds of Past
12-Month Substance Use Disorder
1st Generation 1.5 Generation 2nd Generation 3rd Generation
(n=1,257) (n=365) (n=522) (n=397)
English Proficiency
Good/Excell vs.
14.1 (1.47-135)* -- -- --
None/Poor
Discrimination
Ever vs. Never 2.71 (0.32-22.9) -- -- 3.20 (0.41-25.0)
Acculturative Stress
Med/High vs.
2.68 (0.70-10.2) -- n/a‡ n/a‡
None/Low
Family Conflict
Ever vs. Never 10.2 (1.25-82.6)* 4.06 (0.47-35.4) 6.04 (1.78-20.5)* --
All models adjusted for for age at interview and sex. Some adjusted for martial status, education, and ancestry/nationality.
*pLatinos: Conclusions
Latino generations are extremely heterogeneous
“Generation 1.5” often resemble their US-born
counterparts more than other first generation immigrants
Generational groups have different relationships with
mental disorder
Effects also vary by type of mental disorder
Take into account generational status and age at
migration
Avoid collapsing psychiatric disorders into one category
© 2014, Johns Hopkins University. All rights reserved.Asians: Intergenerational Cultural Dissonance and Alcohol Use
Asian Americans & Alcohol Use
Underage drinking is a widespread problem with multiple
negative outcomes
Asians experience a range of adverse outcomes from
alcohol misuse
Alcohol use problems differ across adolescent Asian
subgroups
o Higher rates of use and binge drinking among Korean,
Japanese, and Filipino Americans
o Lower rates among Chinese and Asian Indian Americans
o Very few data on Vietnamese and Cambodian American
youth
Wu et al. (2011); Iwamoto et al. (2012);
Lee et al. (2009); Makimoto (1998); Cheng et al. (2012)
© 2014, Johns Hopkins University. All rights reserved.Intergenerational Cultural
Dissonance (ICD)
“The Acculturation Gap”
ICD measures the difference in acculturation between
children and their caregivers
o Leads to increased miscommunication, misunderstanding,
and familial conflict
o Associated with a range of subsequent adverse child
outcomes including depression and alcohol use
o Most research comes from Hispanic populations
Portes & Rumbaut (1996); Lau et al. (2005);
Choi et al. (2008); Kim et al. (2009)
© 2014, Johns Hopkins University. All rights reserved.Conceptual Framework
Objective: Estimate the association of ICD and
alcohol use in Vietnamese and Cambodian
adolescents
Is this relationship mediated by depression?
Intergenerational Adolescent
Cultural alcohol use
Dissonance
Adolescent
Depression
Data come from the Cross Cultural Families project
© 2014, Johns Hopkins University. All rights reserved.ICD, Alcohol Use and Depression in Vietnamese
and Cambodian Adolescents
3.5
3
ADJUSTED ODDS RATIO
2.5
2
1.5
1
0.5 **
** **
0
ICD
and
Alcohol
Use
*Adjusted
*Adjusted
for sex,
for sex,
age,age,
nativity,
nativity,
nationality,
nationality,
©and and
acculturation
2014, Johns acculturation
Hopkins University. All rights reserved. ** pICD, Alcohol Use and Depression in Vietnamese
and Cambodian Adolescents
3.5
3
ADJUSTED ODDS RATIO
2.5
2
1.5
1
0.5 ** **
** **
0
ICD
and
Depression
*Adjusted for sex, age, nativity, nationality, andHopkins
© 2014, Johns acculturation
University. All rights reserved. ** pICD, Alcohol Use and Depression in Vietnamese
and Cambodian Adolescents
3.5
3
ADJUSTED ODDS RATIO
2.5
2
1.5
1
** ** **
0.5
** **
0
*Adjusted
*Adjusted
for sex,
for sex,
age,age,
nativity,
nativity,
nationality,
nationality,
©and and
acculturation
2014, Johns acculturation
Hopkins University. All rights reserved. ** pICD, Alcohol Use and Depression in Vietnamese
and Cambodian Adolescents
3.5
3
ADJUSTED ODDS RATIO
2.5
2
1.5
1
0.5 ** ** **
** **
0
ICD Baseline
and Depression
Alcohol and
Use Alcohol Use
*Adjusted
*Adjusted
for sex,
for sex,
age,age,
nativity,
nativity,
nationality,
nationality,
©and and
acculturation
2014, Johns acculturation
Hopkins University. All rights reserved. ** pAsians: Conclusions
Complex processes
Points to a potential mechanism
Prevention of adolescent alcohol use by targeting ICD
o More proximal risk factor than acculturation
o Enhancing communication and bicultural effectiveness
training (BET)
Randomized trials needed
o Powered for subgroup analyses
© 2014, Johns Hopkins University. All rights reserved.Special Topics
Caveats and Cultural
Considerations
Oversimplification of complex processes
Validity in Measurement
Etic vs. Emic Approach
Somatization
Culture-Bound Syndromes
o Latinos: Ataque de Nervios
o Asians: Khyal cap
Resilience
o Familism, Biculturalism, Spiritualism
© 2014, Johns Hopkins University. All rights reserved.Service Use Among Immigrants
Less likely to use mental health services
o Latinos: 12-month usage: 4.44% Mexicans, 5.55%
Cubans
o Asians: 1/3 less likely, 12-month usage: 3.1%
o Varies by generation: 3rd gen. higher rates
More use of informal services
o Friend/relative
o Clergy
o Indigenous healers
Spencer et al. (2010); NCLR report
(2005)
© 2014, Johns Hopkins University. All rights reserved.Past-Year Mental Health Service Use
in Latinos in the US, by Immigration Characteristic
0-5 yrs 6-10 yrs US-born =21 yrs 18-34 >=35
US-born
25.58
Percent using MH Services
24.62 25.32 23.97
14.67
15.87 15.16
12.76 13.29
6.35
2.63 2.73
2.03
Years in US Age at Immigration Generational Status
Data from the NLAAS
© 2014, Johns Hopkins University. All rights reserved. (Alegria et al., 2008)Barriers to Care
Structural
o Insurance, availability and accessibility of services,
transportation, financial burden
Language and cultural competency
o Communication with provider and staff
Legal
o Fear of deportation
Stigma
o Acceptability of mental illness in one’s culture
o Shame is associated with less use of services
Discrimination
o Racism
o Suspicion of service delivery system
© 2014, Johns Hopkins University. All rights reserved.
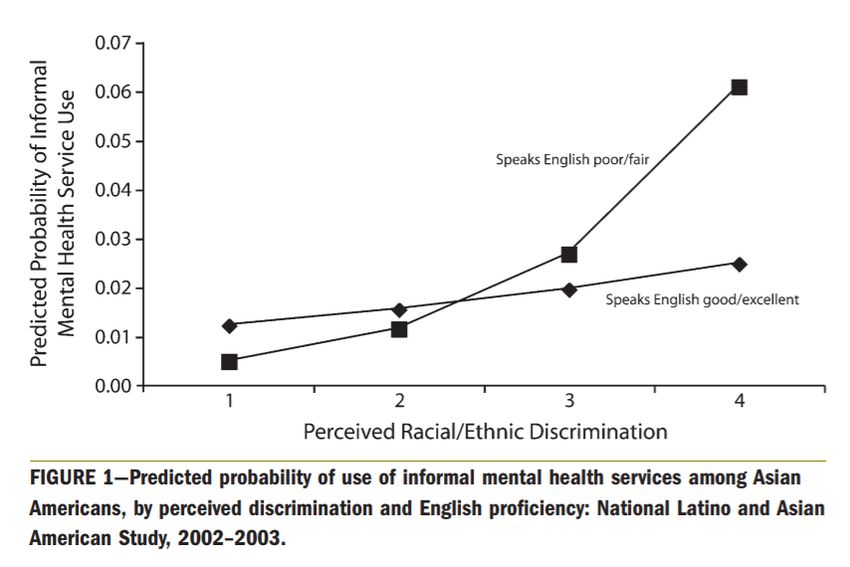
Spencer et al. (2010); NCLR report (2005)Source: NLAAS, Spencer et al., 2010
© 2014, Johns Hopkins University. All rights reserved.Cultural Considerations in a
Clinical Setting
Disease-related Beliefs
o Mal de Ojo
Stigma
Culture
o Fatalismo
o Engagement with family members
Cultural competence
o “…ability to interact effectively with people of different
cultures… [and] helps ensure the needs of all community
members are addressed.” (SAMHSA, 2016)
o “…to be respectful and responsive to the health beliefs
and practices… of diverse population groups”
www.thinkculturalhealth.hhs.gov/clas/blueprint
© 2014, Johns Hopkins University. All rights reserved. Alegria et al. (2012)Acknowledgements
This research was supported by:
o NIMH Psychiatric Epidemiology Training Program
(5T32MH014592-39; PI: Zandi, Peter)
Dr. Jeremy Kane
© 2014, Johns Hopkins University. All rights reserved.Thank You! kroth4@jhu.edu © 2014, Johns Hopkins University. All rights reserved.
You can also read