Analysis of Bidding Networks in eBay: Aggregate Preference Identification through Community Detection
←
→
Page content transcription
If your browser does not render page correctly, please read the page content below
Analysis of Bidding Networks in eBay:
   Aggregate Preference Identification through Community Detection
                       R. Kang-Xing Jin†                          David C. Parkes and Patrick J. Wolfe
                            Facebook, Inc.                          School of Engineering and Applied Sciences
                      Palo Alto, CA 94301 USA                       Department of Statistics, Harvard University
                        rjin@post.harvard.edu                              Cambridge, MA 02138 USA
                                                                        {parkes, patrick}@eecs.harvard.edu

                         Abstract                                   crystal display (LCD) screens. From this information
                                                                    we extract relational data by looking for bidders who
  Statistical analysis of networks plays a critical role in         participate in multiple auctions. This provides a net-
  the context of economics and the social sciences. Here
  we construct a bidding network to represent the be-
                                                                    work representation of the market, in which auctions
  havior of users of the eBay marketplace. We study the             are associated with nodes, and weighted edges between
  eBay markets for digital cameras and liquid crystal dis-          nodes capture the number of bidders competing in a
  play screens, and employ network analysis to identify             pair of auctions, where said bidders ultimately win in
  aggregate structure in bidder preferences. The network            only a single auction.
  that we construct associates auctions with nodes, and                Given such a “bidding network,” we adopt commu-
  weighted edges between nodes capture the number of                nity detection algorithms to identify aggregate prefer-
  bidders competing in a pair of auctions, where said bid-          ence information. Our main idea is that behavioral in-
  ders ultimately win in only a single auction. We show             formation about bidders can provide, in the aggregate,
  that current community detection methods applied to               information about which auctions’ goods are viewed
  this network allow for the identification of goods that
  are considered substitutes and complements, and thus
                                                                    as substitutes and which auctions’ goods are viewed
  the identification of aggregate preference information.           as complements. We demonstrate that community de-
  In closing we suggest additional opportunities as well            tection methods applied to this network can identify
  as challenges for the analysis of structured data in elec-        substitutes and complements goods, and thus aggre-
  tronic markets.                                                   gate preference information about the bidder popula-
                                                                    tion. We close with a discussion about the need for
                                                                    principled, Bayesian-inference based methods to study
                     Introduction                                   the structure of behavioral data in economic contexts.
As technology enables the collection of ever more vast
and diverse data sets, methods of unsupervised learn-                  The Problem: Aggregate Preference
ing continue to grow in importance. Nowhere is this                              Identification
more readily apparent than in modern-day e-commerce
networks, where the burgeoning study of behavior and                A central problem in the analysis of economic systems
preferences continues to gain in importance (Bapna                  is to identify the preferences of the actors within the
2004; Reichardt & Bornholdt 2005; Shah et al. 2003;                 economy. Armed with information about preferences,
Yang et al. 2003). However, the mathematical and                    one can then study both the allocative efficiency of mar-
statistical models and methodologies to support these               ket institutions, as well as propose new institutions in
studies lag significantly behind at present; existing al-           order to improve market efficiency. We are interested
gorithms do not allow researchers to ask and answer                 in methods that can be leveraged to provide robust in-
the new scientific questions engendered by these mod-               formation about common structure in user preferences.
ern data types.                                                        Specifically, on eBay we are interested in the following
   In particular, such data sets typically exhibit rela-            two questions:
tional and temporal structure spanning a variety of                 • Can substitutes goods be automatically identified
scales. Here we consider a data set derived from the                  from bidder behavior?
eBay online auction site. We collect information about              • Can complements goods be automatically identified
the bidder activity in two markets, namely the market                 from bidder behavior?
for branded digital cameras and the market for liquid
                                                                       Roughly, two items are substitutes if a typical bid-
Copyright c 2007, American Association for Artificial In-           der with value for one item also has value for the other
telligence (www.aaai.org). All rights reserved.
    †
                                                                    item.1 Examples of substitutes goods include two mod-
      This work comprised the first author’s senior thesis work
                                                                       1
while a student at Harvard University (Jin 2006).                          A more technical definition can be provided, whereby
els of 19” LCD monitors. Two items are complements The empirical study of Internet auctions is a rela-
if a typical bidder has superadditive value for the pair tively new field, and most work has been done in the
of items (and the demand for one item might fall if the past five years. This fact is not too surprising, since on-
price on the other item increases.) Examples of com- line auction websites have only reached prominence re-
plements goods include a digital camera and a memory cently. To our knowledge, no prior work has addressed
stick, or a flight and matching hotel rooms. the questions of identifying natural substitutes or natu-
This macro-level, structural information on the pref- ral complements amongst the goods in the eBay market.
erences of participants in a marketplace can be useful The closest related work is a study of bidder commu-
for a number of reasons. For instance: nities on eBay (Reichardt & Bornholdt 2005), which we
• Knowledge of goods that are natural substitutes, or believe to be the first study of communities in a network
complements, can influence the design of user inter- generated from an online auction site.2 The authors
faces; logged all data over a 12-day period on the German
eBay.de website. They then generated a network with
• Manufacturers can learn from revealed preference in- bidders as nodes and edges drawn between any two bid-
formation about the products that are viewed as sub- ders who bid in the same auction. Next, they applied a
stitutes in the marketplace; community detection algorithm to the network. They
• In complex markets, it can be useful to pre-bundle found 7 “major” communities and noted that these
complements (and sometimes substitutes; e.g., in the communities tended to correspond to auctions in spe-
case of information goods) to improve revenue and/or cific eBay-defined high-level goods categories. For ex-
efficiency properties and simplify elicitation; ample, one community consisted of bidders who primar-
• Such knowledge can also be used to enhance cross- ily participated in the Toy Models and Toy categories.
selling (in the case of complements); e.g., attempting From these data, they concluded that bidders tend to
to sell digital memory in addition to a camera. limit their activities to general categories of goods. We
ask different questions in our work (i.e., whether one
The question of substitutes is also in part motivated can identify aggregate preference structure for specific
by the related problem of categorization: eBay has mil- goods within a category), and construct a different net-
lions of widely varying items—for example, antiques, work to represent the eBay market.
cars, real estate, and electronics, among others—so
what is a scalable way to organize these items into
categories? Categorization has been shown to have a From eBay to Bidding Networks
significant positive effect on monthly sales (Lohse & In this section we describe how we construct a bidding
Spiller 1998), and an important part of the success of network from eBay data.
eBay (Weiss, Capozzi, & Prusak 2004). Indeed, items
with precise categories tend to attract more bidder traf- eBay Auction Data
fic (Hahn 2001), and allows for search via category- We collect data by searching closed listings on
specific parameters (McGuinness 2001), such as size, eBay.com. We have developed harvesting scripts writ-
model and brand. ten in Perl to “scrape” eBay data, which is then stored
Related Work in a Mysql database.3 The information in the data set
is multi-faceted and includes the following elements for
In application domains, the analysis of social networks each auction:
is well established (Wasserman & Faust 1994); recent
work has begun to focus on model-based clustering for 1. Title of auction, name of seller, type of auction, re-
these networks (Handcock, Raftery, & Tantrum 2007). serve price, reputation of seller.
A number of other studies also treat classification and 2. Whether or not the item sold. The high bid in the
clustering in relational data (Taskar, Segal, & Koller auction, and the start and end time.
2001; Kemp, Griffiths, & Tenenbaum 2004). However,
to the best of our knowledge, the application of such 3. The name of each bidder, the time the bid was placed
techniques to the economic analysis of electronic mar- (to the bidder proxy) and the value of each bid.4
kets is a very recent development. In addition, for the two eBay markets that we have
Community detection in networks is a growing area of studied we have collected descriptive information, in-
research because it can help to reveal underlying struc- cluding technology, brand information, etc. from an on-
ture (Palla et al. 2005). For example, Flake et al. (Flake line source.
et al. 2002) found that web pages tend to cluster into
2
communities of semantically similar pages; community Personal communication, M. E. J. Newman.
3
structure has also been examined in social and biologi- These scripts were first developed in a classroom setting
cal networks (Girvan & Newman 2002). by co-author Parkes, and were subsequently improved by
Aaron Roth.
4
preferences satisfy gross substitutes if the demand for one We do not have information on the value submitted by
of the items does not decrease when the price of the other the winning bidder to her proxy, only a lower bound on this
item increases (Lehmann, Lehmann, & Nisan 2001). via the closing price.We collected data from two categories of goods.
The first set (Canon) contains all auctions matching
“Canon” in the Digital Cameras category over a pe-
riod from Jan. 10, 2006 to Jan. 25, 2006. The sec-
ond set (LCD) contains all auctions matching “LCD”
in the Monitors and Projectors category over a period
from Nov. 29, 2005 to Dec. 14, 2005. These markets
were chosen because they are reasonably sized markets
where there might be natural substitutes (specific mod-
els of cameras and specific sizes, brands, or models of
LCDs).5
The Canon set consisted of 6717 auctions, and the
LCD set consisted of 11782 auctions. Similarly to Yang
et al. (Yang et al. 2003), we found for both data sets
that the distribution on the number of auctions in which
a bidder participates appeared to follow a power law.
In the Canon market, 8453 of the 12759 bidders (66%)
participated in only one auction, and 2065 (16%) par-
ticipated in only two. In the LCD market, 15650 of
the 23801 bidders (66%) participated in only one auc-
tion, and 3883 (16%) participated in only two. A small
number of bidders thus account for a disproportionate
amount of bidding activity. The maximum numbers of
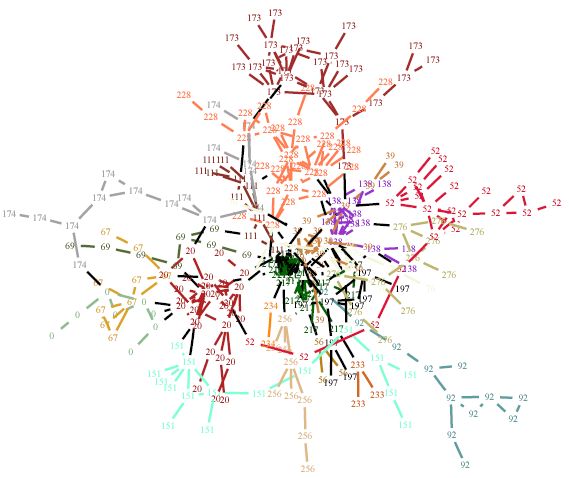
auctions participated in by a single bidder were 61 and Figure 1: Largest maximally connected component of
171 for the Canon and LCD markets, respectively. The the Canon bidding network, derived from eBay data
bidder who participated in 171 auctions in the LCD
market averaged more than 12 per day!
Community Detection Methods
Constructing a Bidding Network
Following data collection, we construct a graph to rep- We apply a current, state-of-the-art community detec-
resent the semantic information about goods that is tion algorithm to this graph.
revealed through bidder behavior: auctions are nodes
and an edge is drawn between an two auctions that
share a common bidder. Thus, an edge conveys infor- What is a Community?
mation about preferences: if one restricts edges to those
that represent bidders that eventually win a single item Informally, a community is described as a subset of
then the presence of bidding across auctions provides re- nodes that are connected more strongly to each other
vealed preference, in this case indicating that the items than to the rest of the network. For example, a social
in the associated auctions are substitutes. network of all university students in a locale, with edges
Preprocessing techniques are applied as follows in or- defined by friendships, might naturally have communi-
der to emphasize structure and remove noise due to ties defined along college lines.
extremal bidding behaviors: edges are weighted by the To this end, one formal definition of a community
number of shared bidders in any two auctions; and edge is as follows (Reichardt & Bornholdt 2004): Given a
weights due to bidders with bids less than some frac- graph G with N nodes and M edges, a community of n
tion f (e.g., 0.8) of the winning price in one or both of 2m
nodes and m edges is one satisfying n(n−1) > N (N2M
−1) >
the auctions are removed. This proved important; for mnN
instance, the 171-auction bidder in the LCD data set, n(N −n) , where mnN is the number of edges connect-
who represented less than 0.02% of the bidder popula- ing the community to the rest of the network. Each
tion, was found to generate more than 10% of the graph of these terms represents a normalized edge density—
edges. We do not want the community structure in our the number of edges divided by the maximum num-
network to be dominated by any one bidder. ber of edges possible (if the nodes were connected as
As an illustration of the resulting network, Figure 1 a clique). The first inequality requires that within-
shows a spring-model energy-minimization representa- community density be greater than the average network
tion of the largest maximally connected component of density, while the second inequality requires that the
the Canon bidding network (for f = 0.8). average network density be greater than the density of
edges leaving the community. Loosely, a community
5
Note that these market choices define our set of possible should have a dense number of edges within the com-
substitutes for the purposes of this study, as we can only munity and a sparse number of edges connecting it with
determine substitutes on which users bid. the rest of the network.Finding a Good Community Structure
For a given graph G = (V, E), where |V | = N and
|E| = M , the community detection problem can be
formalized as a partitioning problem subject to a con-
straint. Each v ∈ V should be assigned to some par-
tition ci , for i ∈ {1, 2, . . . , nc } where nc is the number
of communities. We want this partitioning to match
our intuition as to what a good community is—that is,
the partitions should satisfy some definition of commu-
nity and/or maximize some metric that assesses a pro-
posed community partitioning. The community detec-
tion problem is difficult because there may be multiple
ways to divide any graph into acceptable communities,
and furthermore, the number of “optimal” communities
is often not known beforehand.
Modularity is a global metric that has been widely
used to compare different community divisions and de-
termine an “optimal” one (Newman 2004), and is de-
fined as follows. Let eii be the fraction of all edges
in the graphP that lie within community i, and let
1 Figure 2: Network community assignments in the LCD
ai = 2M v∈ci dv , where dv is the degree of node v, bidding network, with colors and labels indicating nodal
denote the fraction of ends of edges in the graph that
community membership
are in community i. Then the modularity Q(G, c) of
a graph and P given community division c is defined as
Q(G, c) = i (eii − ai 2 ). This represents the fraction of demonstrated to reliably identify communities in both
edges in the network that fall within communities less artificial networks and real-world networks, and can be
the expected value of the fraction of edges in the net- further optimized for computational efficiency (Clauset,
work that fall within communities given the number of Newman, & Moore 2004).
ends of edges in each community and if the edges had Figure 2 demonstrates the results of applying this
been assigned uniformly at random. algorithm to a subset of 10% the eBay LCD market,
Adopting shorthand Q for this modularity metric, with nodes shown as auctions and edges drawn between
a value of Q = 0 indicates no community structure, any two auctions that share a common bidder.
while a value of Q approaching the maximum of 1 rep-
resents the presence of strong community structure.6 Results: Substitutes Preferences
Newman (Newman 2004) found that real world net-
works with strong community structure tend to have Q For each of our markets—Canon and LCD—we gen-
values of at least 0.3. The highest known value of Q erated a network that used both price threshold edge
in the literature for an unweighted real-world network filtering (at f = 0.8) and edge weighting, and applied
is Q = 0.75, which came from a reviewer network from our solution. We applied keyword extraction8 to the
Amazon.com (Clauset, Newman, & Moore 2004).7 communities and examined the keywords. We first dis-
Having adopted this metric, we are now prepared to cuss results for the Canon market, and then turn to the
identify communities in a network. Given the largest LCD market.
maximally connected component of a network, we wish
Canon Digital Cameras
to find a community division that maximizes Q for this
component. Since the number of possible partitions is Figure 3 illustrates the result of applying the methodol-
exponential in the number of nodes, Newman (New- ogy described above to our digital camera data set. The
man 2004) propose a greedy forward-selection method size of each circle is proportional to the number of auc-
(“Greedy Q”) where one starts with each node in its tions in each community, and significant keywords are
own community and iteratively joins communities based listed in order (with the most over-represented first).
on the greatest increase in Q. This method has been For the Canon market with both edge filtering and
edge weighting, there were 25 communities ranging in
6
In practice, it is possible to generate networks and com- size from 3 to 339. Of these, 15 were major communi-
munity assignments where Q < 0. Furthermore, for any ties.9 Twelve of the major communities had significant
given network, it may be impossible to attain Q = 1. In
8
earlier work, Newman (Newman 2003) normalized the value We use a simple statistical method to extract keywords
of Q; however, he argues that the unnormalized Q is more to describe a collection of auctions (Jin 2006), looking for
informative (Newman 2004). words that are both widely shared and over-represented, in
7
In fact, we found Q values of 0.72 in the LCD eBay the sense of TF/IDF methods (Salton & Buckley 1988).
9
market and 0.77 in the Canon eBay market—higher even We define a major community as one with at least 1% of
than the modularity reported in the literature for Amazon. the total auctions in the maximally connected component.Figure 3: Proportionally sized Canon “substitutes” communities, with 0.8 edge thresholding and weighted edges
keywords, with a range of 1 to 6 significant keywords are shown in Figure 4. Eight of these 10 communities
per community. The figure illustrates these 12 most had a size (15”, 17”, 19”, 20”, 24”) and/or a specific
significant communities. Ten of these communities had model number (e173fp, 2005fpw, 2405fpw) as a key-
exactly one camera model keyword (sd500, a620, s2, word. Importantly, no communities had more than one
a70, a520, s50, sd200, s80, s410, s110) and two commu- size or more than one model number. This property
nities had two camera keywords (sd400 and sd450; pro1 is desirable because it is unlikely that different sizes or
and g6). These are natural substitutes: the sd400 is the models of monitors serve as good substitutes.
predecessor to the sd450, and the two camera models The communities are not quite as distinct as in the
are extremely similar—they share the same resolution Canon market—for example, there are two communities
and memory card, with the major difference being a with e173fp as a keyword, and also two communities
slightly larger screen on the sd450;10 the pro1 and g6 with 15” as a keyword. Thus, there is some evidence of
are 2 of the 6 “high-end” Powershot digital cameras that over-segmentation. Nonetheless, when taken together,
Canon offers and both take the same type of compact the keywords for the 12 major communities do seem
flash memory card.11 to encapsulate the significant areas of the market—for
example, all major monitor sizes are represented in at
LCD Screens least one of the major communities.
For the LCD market, we identified 42 communities An interesting anecdote is that examining the indi-
ranging in size from 3 to 973. Of these, 12 were ma- vidual auctions in the LCD community corresponding
jor communities. Ten of the major communities had to 24” 2405fpw Dell monitors (community 6 in Figure 4)
significant keywords, with a range of 1 to 7 signifi- revealed one case where our method correctly grouped
cant keywords per community; these 10 communities an auction with similar other auctions even though the
10
One review (www.dpreview.com/reviews/canonsd450/) seller had listed it in an incorrect category. In this case,
termed the sd450 a “fairly minor upgrade” to the sd400. the seller listed the item in the 19-inch Dell monitor
11 category, but our method nonetheless grouped it with
Information obtained from the official Canon Powershot
website (www.powershot.com). other 24” monitors of the same model.Figure 5: Density plot of complementarity between dig-
ital camera and memory card communities (SD: secure
digital, CF: compact flash) in the Canon eBay market.
Figure 4: Proportionally sized LCD “substitutes” com- Brighter boxes indicate higher complementarities
munities, with 0.8 edge thresholding and weighted edges
We need a method to evaluate the strength of the
complementary relationship between two communities
Results: Complements of goods c1 and c2 . Intuitively, if the two communities
With respect to complements goods, we assume that have a large number of shared winning bidders, then
buying goods together is evidence of complementarity. it is likely that they have high complementarity. We
Complementary goods can occur in sets larger than two, define comp(c1, c2) as:
but as a starting point, we only consider pairs of goods.
comp(c1, c2) = max {cpct(c1, c2), cpct(c2, c1)} (1)
To study complementarity, we collected two addi-
tional data sets. The first set consists of all auctions where cpct(a, b) is the number of distinct winning bid-
matching “Secure Digital” in the Secure Digital (SD) ders in a that also win at least one auction in b, divided
memory card category over a given time period. The by the total number of distinct winning bidders in a.
second set consists of all auctions matching “Compact For cases where there are few shared winning bidders,
Flash” in the Compact Flash (CF) memory card cate- we define compT (c1, c2) as:
gory. (These additional data sets shared the same time compT (c1, c2) = max{cpctT (c1, c2), cpctT (c2, c1)} (2)
period as our Canon data set.)
It seems reasonable that memory cards and cameras where cpctT (a, b) is the number of distinct winning bid-
have complementary relationships. Furthermore, differ- ders in a that also place a bid that is at least a fraction
ent models of camera require specific formats of memory T of the closing price of an auction in b, divided by the
cards—either CF or SD. Thus, we can assess the effec- total number of distinct winning bidders in a. Note that
tiveness of our methods by comparing the strength of comp1 (c1, c2) is essentially equivalent to comp(c1, c2)—
complementary relationships detected for each camera the only difference is that comp1 (c1, c2) includes bids
model and the two types of memory cards. Out of the that tied the closing price but lost.
12 significant camera communities from the previous We examined compT (c1, c2) for 14 communities,
section, 7 are SD cameras and 5 are CF cameras. twelve of which were camera communities. In addition,
Our approach was two stage: first we identified (sub- we generated one CF community and one SD commu-
stitutes) communities of interest, and then constructed nity. Each of the memory card communities contained
a new graph in which these communities of interest are a random 10% sample of successfully sold auctions in
nodes, and edges are weighted to indicate the number their respective markets.12 Figure 5 displays the com-
of distinct winners that submit competitive bids (ac- 12
We did not generate substitute communities for the
cording to some threshold fraction of the winning bid) memory card markets, as we simply wanted to test for com-
in auctions that fall into the two communities. plements between cameras and card types in general.Figure 6: 14 × 14 Density plot for comp1 (c1, c2) Figure 7: 14 × 14 Density plot for comp0 (c1, c2) (brighter boxes indicate a higher value) (brighter boxes indicate a higher value) plement function values for the CF and SD memory communities are associated with the correct memory card communities in relation to the camera communi- card type, none of these relationships had the highest ties. Most of the values for comp1 (c1, c2) are 0—that value of comp0 (c1, c2) for their row. Thus, while re- is, there were no shared winners between most of the laxing compT (c1, c2) can result in the identification of community pairs. For 4 of the 7 secure digital camera more associations, there are trade-offs in increased mis- communities, there was a nonzero comp1 (c1, c2) value classification and noise. between the camera community and the secure digi- Interestingly, stronger complementarity seems to ex- tal community. For 1 of the 5 compact flash camera ist between secure digital cameras and secure digital communities, there was a nonzero comp1 (c1, c2) value cards than between compact flash cameras and com- between the camera community and the compact flash pact flash cards. Further investigation is needed to de- community. There were no false positives. termine if this is due to an intrinsic property of the We next assessed whether we could identify more as- goods, or is rather a by-product of our choice of metric. sociations by relaxing the threshold. At the least re- strictive value of T , comp0 (c1, c2), the function is able Looking Forward: Generative Modeling to associate 3 more camera communities with their and Bayesian Inference correct memory card type. In the process, however, A criticism of the methods that we have explored in one compact flash camera community is potentially this work is that they are ad hoc. One first proposes a misclassified, since it has similar comp0 (c1, CF ) and network to capture some underlying semantic property comp0 (c1, SD) values. via community structure, and then applies a community The data also suggest that there is some between- detection algorithm without resort to an explicit model. camera-community complementarity—that is, there are Following the recent directions of Kemp and New- bidders who win multiple cameras from different com- man (Kemp et al. 2006; Newman & Leicht 2007), a munities. Figure 6 depicts the full 14 × 14 density plot more promising approach seems to be one of combin- for comp1 (c1, c2). As we see, only 2 of the 4 camera ing generative modeling with Bayesian inference. One communities with memory card comp1 (c1, c2) relation- defines a generative model that allows for particular ships had their strongest comp1 (c1, c2) value with the relational structure between objects (e.g., between bid- memory card community. The other two communities ders and auctions) and is also stochastic. This in turn had stronger complement relationships with another induces a graph whose edges, weights, and other pa- camera community. rameters are considered to be random variables from As we decrease T , the between-camera-community an appropriately chosen probability distributions. A values of compT (c1, c2) begin to dwarf the camera- number of fitting methods are then available to esti- memory card values of compT (c1, c2). This fact be- mate these parameters from observed data, as well as comes evident in Figure 7, which depicts a 14 × 14 den- to compare and select from a variety of possible models. sity plot for comp0 (c1, c2). While 8 of the 12 camera For instance, as described in the citations above, one
can posit a Dirichlet process prior model for commu-        Kemp, C.; Tenenbaum, J. B.; Griffiths, T. L.; Yamada,
nity structure wherein the generative model captures:       T.; and Ueda, N. 2006. Learning systems of concepts
(a) an endogenous number of communities; (b) a dis-         with an infinite relational model. In Proc. 21st Natl.
tribution on the propensity of linking to items in other    Conf. Artif. Intell. (AAAI-06).
communities (and in the same community), conditioned        Kemp, C.; Griffiths, T. L.; and Tenenbaum, J. B. 2004.
on a particular community assignment; and (c) links be-     Discovering latent classes in relational data. Techni-
tween items given a model for linking propensity. Not       cal Report MIT-CSAIL-TR-2004-050, Massachusetts
only does such a scheme enable principled inference pro-    Institute of Technology, Cambridge, MA.
cedures that can also be extended to model the dynamic
                                                            Lehmann, B.; Lehmann, D.; and Nisan, N. 2001. Com-
evolution of marketplaces and temporal dependencies
                                                            binatorial auctions with decreasing marginal utilities.
within them, it also provides a means of uncertainty
                                                            In Proc. 3rd ACM Conf. Electron. Commer., 18–28.
quantification for the resultant parameter estimates, an
important consideration when scientific conclusions are     Lohse, G. L., and Spiller, P. 1998. Electronic shopping:
being drawn from the data under study.                      The effect of customer interfaces on traffic and sales.
                                                            Commun. ACM 41:81–87.
                     Summary                                McGuinness, D. L. 2001. Ontologies and online com-
In this paper we have collected behavioral data from        merce. IEEE Intell. Sys. 16:9–10.
bidders in two eBay markets and from this data in-          Newman, M. E. J., and Leicht, E. A. 2007. Mix-
ferred aggregate properties about bidder preferences.       ture models and exploratory data analysis in networks.
The basic idea is that by their bidding behavior bid-       Proc. Natl. Acad. Sci. USA. To appear.
ders indicate “revealed preference” information; e.g.,      Newman, M. E. J. 2003. Mixing patterns in networks.
two goods are natural substitutes (when auctions are        Phys. Rev. E 67:026126.
part of a community in which bidders tend to win in         Newman, M. E. J. 2004. Fast algorithm for detect-
only one auction) or two goods are natural complements      ing community structure in networks. Phys. Rev. E
(when auctions are part of a community then tend to         69:066133.
share winning bidders). Although current community
detection methods seem to be a reasonable tool we con-      Palla, G.; Derényi, I.; Farkas, I.; and Vicsek, T. 2005.
sider much of this methodology ad hoc: which graph to       Uncovering the overlapping community structure of
construct, how many communities to look for, how to         networks in nature and society. Nature 435:814–818.
interpret the results? As a future direction we have ad-    Reichardt, J., and Bornholdt, S. 2004. Detecting
vocated the combination of generative modeling with         fuzzy community structures in complex networks with
Bayesian inference. We are currently pursuing this di-      a Potts model. Phys. Rev. Lett. 93:218701.
rection on new data sets.                                   Reichardt, J., and Bornholdt, S. 2005. eBay users
                                                            form stable groups of common interest. ArXiv Physics
                    References                              e-print physics/0503138.
 Bapna, R. 2004. User heterogeneity and its impact on       Salton, G., and Buckley, C. 1988. Term-weighting ap-
 electronic auction market design: An empirical expla-      proaches in automatic text retrieval. Inform. Process.
 nation. MIS Quart. 28:21–43.                               Manag. 24:513–523.
 Clauset, A.; Newman, M. E. J.; and Moore, C. 2004.         Shah, H. S.; Joshi, N. R.; Sureka, A.; and Wur-
 Finding community structure in very large networks.        man, P. R. 2003. Mining eBay: Bidding strategies
 Phys. Rev. E 70:066111.                                    and shill detection. In Zaı̈ane, O. R.; Srivastava, J.;
 Flake, G. W.; Lawrence, S.; Giles, C. L.; and Coetzee,     Spiliopoulou, M.; and Masand, B., eds., WEBKDD
 F. M. 2002. Self-organization and identification of        2002 — Mining Web Data for Discovering Usage Pat-
 Web communities. IEEE Comput. 35:66–70.                    terns and Profiles. Berlin: Springer-Verlag. 17–34.
 Girvan, M., and Newman, M. E. J. 2002. Community           Taskar, B.; Segal, E.; and Koller, D. 2001. Probabilis-
 structure in social and biological networks. Proc. Natl.   tic classification and clustering in relational data. In
 Acad. Sci. USA 99:7821–7826.                               Proc. 17th Intl. Joint Conf. Artif. Intell. (IJCAI-01),
                                                            870–876.
 Hahn, J. 2001. The dynamics of mass online market-
 places: A case study of an online auction. In Proc.        Wasserman, S., and Faust, K. 1994. Social Network
 SIGCHI Conf. Hum. Factor. Comput. Syst., 317–324.          Analysis: Methods and applications. Cambridge, UK:
                                                            Cambridge University Press.
 Handcock, M. S.; Raftery, A. E.; and Tantrum, J. M.
 2007. Model-based clustering for social networks. J.       Weiss, L. M.; Capozzi, M. M.; and Prusak, L. 2004.
 R. Statist. Soc. A 170:301–354.                            Learning from the Internet giants. MIT Sloan Manage.
                                                            Rev. 45:79–84.
 Jin, R. K.-X. 2006. Leveraging bidder behavior to
 identify categories of substitutable and complemen-        Yang, I.; Jeong, H.; Kahng, B.; and Barabási, A. L.
 tary goods on eBay. Senior thesis in computer science,     2003. Emerging behavior in electronic bidding. Phys.
 Harvard College.                                           Rev. E 68:016102.
You can also read