A Statistical Analysis of the Power of 0 - The Fat Emperor
←
→
Page content transcription
If your browser does not render page correctly, please read the page content below

BT Young Scientist and Technology Exhibition – January 2020
Project Title: A Statistical Analysis of the power of 0

A Statistical Analysis of the Power of 0
Name: Ben Loughnane
School: Kinsale Community School, 3rd Year
Category: Individual, Intermediate, Social and
Behavioural Sciences.

 Project Reference Number: 3033

Name: Ben Loughnane
Category: Individual, Intermediate, Social and Behavioural Sciences
School: Kinsale Community School, 3rd Year                            1
BT Young Scientist and Technology Exhibition – January 2020
Project Title: A Statistical Analysis of the power of 0

Judges’ Comments Page

Name: Ben Loughnane
Category: Individual, Intermediate, Social and Behavioural Sciences
School: Kinsale Community School, 3rd Year                            2

BT Young Scientist and Technology Exhibition – January 2020
Project Title: A Statistical Analysis of the power of 0

Table of Contents
Judges Comments Page                                                  2
1.Summary/Abstract                                                    5
1.1 Background                                                        5
1.2 Project Objectives                                                5
1.3 Experimental Approach                                             6
1.4 Results Summary                                                   7
1.5 Conclusions                                                       7
2.Introduction
2.1 Background to Project Selection                                   10
2.2 Research                                                          10
2.3 Research Summary                                                  16
2.4 Project Objectives                                                16
3.Experimental Methods
3.1 Survey Design Options                                             17
3.2 Test Survey                                                       17
3.3 Experimental Approach                                             18
3.4 Survey Locations                                                  19
3.5 Sources of Variation                                              20
Name: Ben Loughnane
Category: Individual, Intermediate, Social and Behavioural Sciences
School: Kinsale Community School, 3rd Year                                 3

BT Young Scientist and Technology Exhibition – January 2020
Project Title: A Statistical Analysis of the power of 0

3.6 Experimental Safety
4.Results
4.1 Survey Results                                                    21
4.2 Raw Data – Demographic Analysis                                   21
4.3 Analysis of Results                                               23
4.4 The Chi – Square Test                                             31
4.5 The Student t Test                                                40
5.Conclusions and Recommendations
5.1 Results Summary                                                   43
5.2 Conclusions and Recommendations                                   43
5.3 Next Steps                                                        45
6.References                                                          46
7.Acknowledgements                                                    47
8.Appendices
8.1 Survey Questionnaire                                              49
8.2 Pharmacy Letter                                                   51
8.3 Raw Data Summary                                                  51
9.Photo Album                                                         52

Name: Ben Loughnane
Category: Individual, Intermediate, Social and Behavioural Sciences
School: Kinsale Community School, 3rd Year                                 4

BT Young Scientist and Technology Exhibition – January 2020
Project Title: A Statistical Analysis of the power of 0

1.Summary/Abstract
1.1 Background
I got the idea for my BT Young Scientist project when my dad was diagnosed with high
cholesterol and prescribed medication from his GP. Through advice from a friend he took a
heart scan known as the calcification test. He received a 0 score and after expert advice he
found that he did not need to be taking any medication because this 0 score supposedly
meant that he was not in any danger of developing heart disease. When I was trying to think
of an idea to do for my project, I recalled that my family and I had little or no knowledge of
the test my dad had taken and the whole topic surrounding it. I decided to set out and find
out about the test and what its purpose is, and then to see could other people such as my
father be avoiding the use of unnecessary medication. That is, reducing their need to spend
money on the medication and avoiding potential side effects they may be experiencing as a
result of taking the medication. I felt that this could be an important issue because statins as
a very common form of medication and many people in Ireland do have high cholesterol.

1.2 Project Objective
In my research I set out to:

    •   Find out about heart calcification.
    •   Research many different reports to show the reliability of the advice my dad
        received.
    •   Investigate why there is not an awareness of this topic amongst the public.
    •   Investigate why this test is not recommended to patients by medical professionals in
        Ireland.
In my survey I set out to:

    •   Apply my research so as to be able to ask accurate questions regarding the topic and
        be able to educate the public about the topic.
    •   Survey a wide demographic of the public on their awareness of the calcification test
        and cholesterol medication usage.
    •   See if age impacts the awareness of the topic.
    •   See if people would be willing to take the test.
    •   To see how much money people are spending on statins and if they suffer from side
        effects.
    •   Analyse all of my collected data using the chi-square test and JMP software to see if
        my results are statistically significant.

Name: Ben Loughnane
Category: Individual, Intermediate, Social and Behavioural Sciences
School: Kinsale Community School, 3rd Year                                              5
BT Young Scientist and Technology Exhibition – January 2020
Project Title: A Statistical Analysis of the power of 0
1.3 Experimental approach
I completed my survey in a number of stages:
• An Interview:
I managed to conduct an over the phone and later meet the founder of the Irish Hear
Disease Awareness charity (IDHA), David Bobbett. I held a detailed conversation with
him regarding my project and he gave me several recommendations for the construction
of my survey.
• Test Survey:
I surveyed approximately 50 people with a test survey in my local area. I received a lot
of helpful feedback that I took into account when formulating the proper survey. I
realized that I needed to make sure that my survey was easy to understand and that the
questions were clear.
• Survey:
After making these changes to my survey, I went to various locations to collect my data.
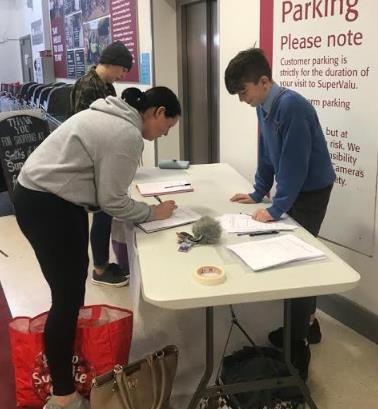
I spent a full day conducting surveys in Kinsale SuperValu where I surveyed a total of 210
surveys. I surveyed a number of teachers in my own school where I received a further 50
surveys. I also surveyed people at various pharmacies in Kinsale (Maloney’s, O’Connor’s
and more). I did this because I wanted to survey people who may have been collecting
cholesterol medication and were therefore the ideal people for me to be surveying. I
surveyed 120 people at these locations.
• Online Survey:
I decided to send out an electronic survey because I wanted to survey additional people.
I first learnt how to construct an online survey on Microsoft Forms. I posted the survey
and was delighted with the response it received. I was sent many comments with people
who were very interested in the topic. Furthermore, I contacted the Irish Heart
Foundation who allowed me to post the survey on their facebook noticeboard. In total, I
received 750 surveys from this method of surveying.
I collected a total of 1200 surveys!
Name: Ben Loughnane
Category: Individual, Intermediate, Social and Behavioural Sciences
School: Kinsale Community School, 3rd Year 6
BT Young Scientist and Technology Exhibition – January 2020
Project Title: A Statistical Analysis of the power of 0

1.4 Results Summary
    •   I had a close to even split between Males and Females, with a 57.9% - 42.1% split.
    •   The majority of survey participants were in the age group of 35-60.
    •   30% of people thought that high cholesterol was the leading cause of heart disease
        while 26% thought that the leading cause was obesity – both incorrect.
    •   Only 30.8% of people were aware of the calcification test with 69.2% of people
        unaware of the test.
    •   Very few people have actually taken the test with 4.6% of people saying that they
        have taken the test.
    •   50.4% of people were aware of their cholesterol score.
    •   Approximately 20% of people surveyed have been prescribed medication for an
        above average cholesterol score.
    •   The most commonly used medication was Lipitor (Atorvastatin) with 48% of people
        using it.
    •   Over half of statin users are spending over €20 a month on their medication
    •   The most common side effect of using cholesterol medication was muscle pain.
    •   79.1% of people would be open to taking the calcification test.
    •   The average price that people would be willing to pay for the test is €178.50.

1.5 Conclusion
After conducting my research, I know that the test fits official screening criteria for
mainstream use of the test and is recommended by the European Society of Cardiology to
be taken by all middle-aged people in Ireland. However, it is probably not economically
viable at this stage to have untargeted screening in Ireland on a mass scale due to the
limited availability of the test and the lack of knowledge regarding the test in the medical
community.

Recommendation: I believe that there is a place in Ireland where that
CAC screening could be used on a larger scale by using it in a targeted
fashion. For example,

Concern/Symptom/Family History -> Calcification test -> Further tests

(Angiogram, Heart Echo etc.).

This is a path that I think could possibly work. At the moment the
calcification test is not present in these steps when getting your health
Name: Ben Loughnane
Category: Individual, Intermediate, Social and Behavioural Sciences
School: Kinsale Community School, 3rd Year                                             7
BT Young Scientist and Technology Exhibition – January 2020 Project Title: A Statistical Analysis of the power of 0 check-up. While I recognise that it may not be economically viable for everyone to be taking the test, I think that the test could be of great value if it was used in a targeted fashion. Although, the test is known to detect people at a high risk with no symptoms (and I agree with this), it has even greater value for people with a poor family history etc. Introducing the test in this way could also allow for further growth. In my project, I found that there was a very poor awareness of the calcification test and its purpose. I found that throughout my results that the opinions and attitudes of males and females were quite similar although slightly more males than females had been diagnosed with high cholesterol. Over half of cholesterol medication users were spending upwards of €240 a year. Recommendation: Have an active education program targeted at middle aged people educating them about calcification and the benefits of taking the test. Many people could benefit from this. Recommendation: That the work of IHDA be promoted and that the documentaries done be recommend for watching because of the valuable insight they provide into this topic. After conducting my research I found that the current heart disease risk assessment system is over 60 years old and outdated in its methods. As well as this, expert medical advice has informed me the that there is a lot of unnecessary medication being prescribed in this industry. Recommendation: I think that there should be a new heart disease risk assessment system introduced in Ireland in which the calcification test is more prominent. The test should be recommended to all middle-aged individuals on my opinion. Given that heart disease and high cholesterol are much more common than other diseases such as cancer, should there not be a test that is as common as other cancer screenings etc.? The test is clinically proven to be beneficial and could provide so many benefits to people. Name: Ben Loughnane Category: Individual, Intermediate, Social and Behavioural Sciences School: Kinsale Community School, 3rd Year 8
BT Young Scientist and Technology Exhibition – January 2020
Project Title: A Statistical Analysis of the power of 0

Next Steps:

    •   I could take this project further by setting up my own awareness website that could
        promote and show some of the research that has such clear implications but is not
        known at all by the general public. My results showed that although many people
        would be open to options such as the test, they were unaware of any alternatives
        such as the CAC test. I believe that a potential website such as this one would help to
        change this. As well as that, I believe my research could help to educate and start a
        conversation within the medical community.

    •   I could try and contact a hospital that provides the calcification test and see if I could
        observe it and record the test to show the simplicity and ease of taking it and
        interpreting the results.

Name: Ben Loughnane
Category: Individual, Intermediate, Social and Behavioural Sciences
School: Kinsale Community School, 3rd Year                                                9
BT Young Scientist and Technology Exhibition – January 2020 Project Title: A Statistical Analysis of the power of 0 2.Introduction 2.1 Background to project selection. I got the idea for my BT Young Scientist project when my dad was diagnosed with high cholesterol and prescribed medication from his GP. Through advice from a friend he took a heart scan known as the calcification test. He received a 0 score and after expert advice he found that he did not need to be taking any medication because this 0 score supposedly meant that he was not in any danger of developing heart disease. When I was trying to think of an idea to do for my project, I recalled that my family and I had little or no knowledge of the test my dad had taken and the whole topic surrounding it. I decided to set out and find out about the test and what its purpose is, and then to see could other people such as my father be avoiding the use of unnecessary medication. That is, reducing their need to spend money on the medication and avoiding potential side effects they may be experiencing as a result of taking the medication. I felt that this could be an important issue because 7% of Ireland’s adult population take statins as a form of medication and many people in Ireland do have high cholesterol. 2.2 Research 2.2.1 What is Cholesterol? Cholesterol forms part of the outer membrane that surrounds every cell. It is used to insulate fibres and make hormones, which carry chemical signs around the body. Without cholesterol, your body wouldn’t work because it is vital to make sure the body is functioning properly. However, too much cholesterol in the blood can increase the risk of coronary heart disease and disease of the arteries. When too much cholesterol is present, a waxy substance called plaque can form in the body’s arteries. Overtime, this build-up can cause atherosclerosis (hardening of the arteries) which can lead to heart disease. 2.2.2 Cholesterol-Lowering Medication Sometimes Cholesterol medication is needed in addition to a low-fat, high-fibre diet to lower cholesterol. The most common cholesterol-lowering drugs are called statins. Statins are a group of lipid-lowering medications that are often prescribed by doctors to help lower cholesterol levels in the blood. Statins block a substance your liver needs to make cholesterol, therefore removing cholesterol from your blood. Although the statins are highly effective for lots of people, some people experience many side effects that can have a short and long term impact on the health of the individual In question. Name: Ben Loughnane Category: Individual, Intermediate, Social and Behavioural Sciences School: Kinsale Community School, 3rd Year 10
BT Young Scientist and Technology Exhibition – January 2020
Project Title: A Statistical Analysis of the power of 0

2.2.3 Side-Effects of Statins
Some people can suffer from side-effects from the taking of statins. Muscle pain and
headaches are among the most common side-effects. People often feel this pain as a
soreness, tiredness or weakness in their muscles. The pain may be a mild discomfort, or it
can be severe enough to make people’s daily activities difficult. Takers of the drug have also
been known to suffer from headaches, nausea, dizziness and an inability to focus. This is
because the statins may impact our neurological activity and not allow us to operate at a
perfect level. The question I have is that: should the Irish health system not be making more
of an effort to provide alternatives to statin medication?

2.2.4 What is Coronary Artery Calcification (CAC)?
Coronary Artery Calcification (CAC) is the build-up of calcium in the arteries, which can
cause blood vessels to narrow and lead to the development of heart disease. Coronary
calcification indicates the total atherosclerosis of coronary arteries. The dangerous thing
about calcification is that it can build up in blood vessels in asymptomatic individuals and is
the reason for many sudden heart attacks.

2.2.5 The Calcification Test
A coronary calcium scan is a CT (Computed Tomography) scan of your heart that detects and
measures the amount of calcium (and total plaque present) in the walls of your coronary
arteries. The test is available in Ireland at a cost of approximately €250 but is not a very
commonly taken test as part of health check-ups. In America, the test is much more
common and available at a much cheaper rate ($100).

Name: Ben Loughnane
Category: Individual, Intermediate, Social and Behavioural Sciences
School: Kinsale Community School, 3rd Year                                              11
BT Young Scientist and Technology Exhibition – January 2020
Project Title: A Statistical Analysis of the power of 0

2.2.6 Coronary Calcium Scoring
Coronary calcification indicates atherosclerosis of the coronary arteries. On the other hand,
atherosclerotic diseased coronary arteries do not always show calcifications. The extent of
the calcification correlates with the total coronary plaque burden present. Research has
shown that the total coronary plaque burden can be quantified based on the coronary
calcium burden. Everyone should have a certain healthy score based on their age but the
danger occurs where the person has the average score of a much higher age bracket than
which they are in. Coronary calcium scanning shows a very high negative predictive value:
the score of 0 has a negative predictive value of nearly 100% for ruling out a significant
coronary narrowing.

2.2.7 The 0 Score
In 2007, a study was published in the Journal of the American College of Cardiology by a
group of 10 MD’s led by Dr. Matthew J. Budoff regarding the long-term prognosis associated
with coronary calcification. They used an observational outcome study of over 25,000
middle risk individuals referred for CAC scanning to assess cardiovascular risk. 44% received
a 0 score. The results of the study showed that 99.4% of these people were alive 10 years
later. For people who had a score >1000 the survival rate worsened to 87%(Ref.3)
A further study conducted by many of the same people was released in 2009. It had much
the same objective and had 44,052 middle risk participants. Of the 45% that received a 0
score there was a survival rate of 99.48% in the following 10 years. Again , the amount of
people who had an event with a score of just 10 was approx. 4%. These numbers continue
to rise in the same pattern etc. (Ref.4)
A study was conducted in 2006 regarding the value of CAC screening in asymptomatic
smokers and non-smokers. The study consisted of 10,377 participants of which over 40%
were smokers. All participants had not shown any signs of developing heart disease
(although naturally the assumption is that you are more at risk of developing heart disease if
you smoke). 50% of smokers had a 0 score while 66% of non-smokers had a score which was
not a huge variation. Smoking did indeed increase your risk but a non-smoker with a CAC
score over 1,000 had 7 times more risk than a smoker with a 0 score. Therefore, the studied
proved that CAC scoring is a better predictor of heart disease than smoking.

Name: Ben Loughnane
Category: Individual, Intermediate, Social and Behavioural Sciences
School: Kinsale Community School, 3rd Year                                            12
BT Young Scientist and Technology Exhibition – January 2020
Project Title: A Statistical Analysis of the power of 0

This graph shows the research mentioned above. (Ref 8)
These studies further prove the idea that the score of 0 has a negative predictive value of
nearly 100% for ruling out a narrowing of a coronary vessel, whether it be because of
calcification or high cholesterol. These figures underline that the calcification test shows the
total amount of coronary plaque present. Other studies have been conducted in recent
years that show similar results. In an effort to take this further, I emailed Dr. Matthew J.
Budoff about his research but I unfortunately received no reply to my questions.

2.2.8 Heart Disease risk assessment system
The current heart disease risk assessment system used in Ireland is called the Framingham
Risk Score and is over 60 years old. It is a population-based system where a number of
health factors are combined to determine the risk of the individual developing CVD. It is a
population based rather than an individual approach to assessing the risk of heart disease.
Framingham has been shown to not being a good predictor of an individual’s risk of heart
disease. Most sudden heart attacks happen in the middle risk group as defined by
Framingham. On the other hand, coronary artery calcium scoring is a single score which
identifies an individual’s risk relative to the general population. What I am trying to outline
here, is that although the above information does not relate directly to my research it shows
the outdated nature of the current system.
Heart Disease is the biggest killer in Ireland each year (36%) ahead of cancer. However,
cancer screenings and risk tests are being updated frequently while the current Framingham
system is used to cover all possible events and the CAC test is never recommended. I
wonder why our health system is not recommending this test to its patients when it can so
clearly be providing benefits. If the CAC test was introduced in a more mainstream fashion,
Name: Ben Loughnane
Category: Individual, Intermediate, Social and Behavioural Sciences
School: Kinsale Community School, 3rd Year                                              13
BT Young Scientist and Technology Exhibition – January 2020
Project Title: A Statistical Analysis of the power of 0

it could help to identify individuals who are taking unnecessary cholesterol medication as
well as identify patients at risk of an event.

2.2.9 Research on Calcification activity in Ireland
I contacted David Bobbett to ask him about his ongoing work in this area and for advice on
constructing my survey. David set up the Irish Heart Disease Awareness charity (IDHA) as a
result of his own experiences. He informed me about the documentaries he funded, which I
watched with great fascination (Extra Time and The Widowmaker). He informed me about
the difficulties he has faced with his charity trying to integrate the calcification test into the
Irish health system. David believes that because there is more money in treatment than
prevention for companies, it will always be hard to make the test integrated into the
mainstream. I also spoke at length with him regarding my survey and he gave me valuable
advice on possible topics for my survey and so on.

2.2.10 The economic viability of the test in Ireland.

Shown above is the Wilson and Jungner screening criteria. In 1968, Wilson and Jungner
published 10 principles of screening that often represent the de facto starting point for the
implementation of screenings today worldwide. The calcification test is at the end of a day,
a CT scan. I believe that based on these accepted guidelines in the medical community that
there is a place for the test in Ireland because based on my research, I think that the test fits
these guidelines.

Name: Ben Loughnane
Category: Individual, Intermediate, Social and Behavioural Sciences
School: Kinsale Community School, 3rd Year                                                 14
BT Young Scientist and Technology Exhibition – January 2020
Project Title: A Statistical Analysis of the power of 0

2.2.11 Further Research (Interviewing a medical professional)
I was lucky enough to speak to out local GP, Dr. Tony Foley about how often he would
recommend the calcification test. He informed me that to his knowledge, there have never
been an updated set of guidelines regarding coronary artery calcification in Ireland from
either the ICGP (Irish College of GP’s or from the Irish Medical Board. He said that he would
only ever recommend the test in an extreme case as there is no targeted screening
programme presently in Ireland. In his opinion, the calcification test is very positive and he
would definitely like to see it being used in an increased capacity in Ireland today. Dr. Foley
also expressed his interest in my project and said that he had never heard of many of the
studies that I am referencing in my research.

2.2.12 Research on how to construct a survey
The science department and teachers in my school helped me to construct a survey. They
gave me some tips on how to format the survey. As I progressed in constructed my 2 nd and
3rd drafts etc. I realised how important it was to clearly outline my questions and that the
more people I spoke to about the survey the better and more varied feedback I would
receive, which would lead to my questions being more accurate. As mentioned above I also
took the advice of an expert on the topic when constructing my questions. I also contacted
the Irish Heart Foundation and although they were unable to be of any assistance, they
were more than happy to let me distribute my survey through their facebook page.

Name: Ben Loughnane
Category: Individual, Intermediate, Social and Behavioural Sciences
School: Kinsale Community School, 3rd Year                                              15
BT Young Scientist and Technology Exhibition – January 2020
Project Title: A Statistical Analysis of the power of 0

2.3 Research Summary
    •   Cholesterol forms part of the outer membrane that surrounds every cell.
    •   Sometimes Cholesterol medication is needed to lower levels. These are called statins
        and sometimes can cause users to have side effects.
    •   Coronary Artery Calcification (CAC) is the build-up of calcium in the arteries, which
        can cause blood vessels to narrow.
    •   A coronary calcium scan is a CT scan of your heart that detects and measures the
        amount of calcified plaque in the walls of your coronary arteries.
    •   Research has shown that the total coronary plaque burden can be quantified based
        on the coronary calcium burden.
    •   A score of 0 has a negative predictive value of nearly 100% for ruling out a significant
        coronary narrowing.
    •   Studies have proved that smoking does indeed increase your risk of developing heart
        disease but a non-smoker with a CAC score over 1,000 has 7 times more risk than a
        smoker with a 0 score.
    •   The current heart disease risk assessment system used in Ireland is called the
        Framingham risk assessment system and is over 60 years old.
    •   The calcification test has faced difficulties integrating itself into the mainstream
        health service in Ireland.
    •   The Wilson and Jungner Screening criteria is used as a starting point for screening
        decisions and to see if they are viable.

2.4 Project Objectives
In my survey I set out to:

    •   Apply my research so as to be able to ask accurate questions regarding the topic and
        be able to educate the public about the topic.
    •   Survey a wide demographic of the public on their awareness of the calcification test
        and cholesterol medication usage.
    •   See if age impacts the awareness of the topic.
    •   See if people would be willing to take the test.
    •   To see how much money people are spending on statins and if they suffer from side
        effects.
    •   Analyse all of my collected data using the chi-square test and JMP software to see if
        my results are statistically significant.

Name: Ben Loughnane
Category: Individual, Intermediate, Social and Behavioural Sciences
School: Kinsale Community School, 3rd Year                                              16
BT Young Scientist and Technology Exhibition – January 2020 Project Title: A Statistical Analysis of the power of 0 3.Experimental Methods 3.1 Survey Design Options There was a variety of different ways that I could have surveyed the public. I first though of gathering my data by interviewing people one on one and asking them detailed questions in orders to get very accurate data. I also felt this could be good because it would be quick, to the point and it would allow me to survey a wide range of people. However, I decided not to pursue this option because people may have been giving personal information and the responses may not have been fully truthful if people did not feel their privacy was being respected. However, I did use interviews at times during the process when interviewing experts that could provide me with valuable unbiased input and advice to benefit my project. I concluded that the best option was to hand out questions in the form of a survey\questionnaire for people to fill out. I felt that this was a better option because it could be done in an anonymous manner. It also allowed me to obtain a large amount t of surveys at one time because I could be surveying multiple people at once. I had considered possibly seeing if I could take someone I knew and have them take the calcification test while I observed. I considered this because I would be interested to see the easy nature of the completion of the test and the clear results it produces. However, There is a very limited availability of the test currently and the cost element was another factor for someone my age. I was quite happy with my decision to use surveys as my method of collecting data and a I started to draft it. 3.2 Test Survey I went to Microsoft forms which is an application within Office 365 and used the app to begin learning how to formulate a survey. I learnt how to structure a survey and how to ask questions in a clear and concise manner that would generate equally clear answers. I got the ideas for my initial questions from different aspects of my research. Once I was happy with my first draft, I handed out a number of test surveys to see if my survey was of the required standard to hand out on a larger scale. After receiving helpful feedback from the initial participants and the IDHA I made small improvements to the survey by making it easier to read and correcting mistakes. When formulating questions for my survey I realised that I would need information about statins that was reliable so I had to visit a range of pharmacies to obtain the statins provided Name: Ben Loughnane Category: Individual, Intermediate, Social and Behavioural Sciences School: Kinsale Community School, 3rd Year 17
BT Young Scientist and Technology Exhibition – January 2020
Project Title: A Statistical Analysis of the power of 0

and the prices they provided them at. To obtain this information I visited Lloyd’s Pharmacy
(Churchtown), Meagher’s Pharmacy (Milltown) and Boots Pharmacy (Dundrum) which were
all located in Co. Dublin. I then visited 3 other pharmacies in my location: Maloney’s,
O’Connor’s and Collins’s which are all Kinsale Pharmacies. Everyone was really nice and
friendly and were happy to give me the relevant information as well as offering advice and
tips.

3.3 Experimental Approach
Initially, I set out to survey about 600 people and to try to make sure I took a random
sample of the population.
The first part of my survey dealt with the regular demographic data of the survey
participants. I asked about their gender and age. I split the age question into 4 sections:
under 18, 18-35, 35-60, 60+. I had quite a large range from 35-60 but I did this because this
was the main applicable age group which is over medicalised with regards to cholesterol
medication.
I split the main topic of my project into 3 sections. The first was of the general awareness of
heart disease and the calcification test. I asked people if they had taken the test as well as if
they were even aware of the test. The next section dealt with whether people knew their
cholesterol levels, had they ever been prescribed medication, and if so did they suffer from
side effects. The last section of the survey asked people had they considered alternatives to
this medication and if they would be willing to take a test which could reduce their need to
take this medication or benefit their health.

Name: Ben Loughnane
Category: Individual, Intermediate, Social and Behavioural Sciences
School: Kinsale Community School, 3rd Year                                                18
BT Young Scientist and Technology Exhibition – January 2020
Project Title: A Statistical Analysis of the power of 0

3.4 Survey Locations
Kinsale Supervalu:
I spent a full day surveying in our local SuperValu and I was delighted with the responses
from everyone who took time to fill out the survey and support my project. I did have to
remind people as they placed €2 on the table that I was only collecting data, not money!! I
managed to collect 210 surveys which I was delighted with.
Pharmacies:
I needed to conduct surveys in a setting such as this because parts of my survey were
targeting people who were taking cholesterol medication. Therefore, I set up shop in two of
my local pharmacies: Maloney’s and O’Connor’s. I was again very happy with the response
and collected 120 surveys over the couple of days.
My School:
I arranged with my science teacher to leave a number of surveys in the staff room in my
school, asking the teachers to fill them out. I got approximately 50 surveys filled out and I
was very grateful to the teachers who took time out to give me a hand.
Online Surveys:
I was finding it very difficult to obtain surveys because as a single student under 18, I
required adult supervision but one of my parents could not always be there due to work and
other commitments. I decided to put my survey into electronic format because I was tight
on time and was in the process of compiling my report and preparing my display. I used
Microsoft Forms to compile the survey and I posted it to a few Facebook noticeboards. I also
contacted the Irish Heart Foundation who were very interested in my survey and were more
than happy to let me distribute it on their forum. I was astounded at the reply I received,
not just with the numbers of replies but also the amount of positive feedback that I received
from volunteers. I collected 750 surveys through this method.

Name: Ben Loughnane
Category: Individual, Intermediate, Social and Behavioural Sciences
School: Kinsale Community School, 3rd Year                                              19
BT Young Scientist and Technology Exhibition – January 2020
Project Title: A Statistical Analysis of the power of 0

3.5 Sources of Variation
There are a few reasons why my results may have varied. These are listed, including the
measures we took to reduce them.

    • We might not have had a diverse enough population for our results to be accurate.
    o I tried my best to avoid this by surveying in a range of different places.
    • People may have lied about their age or other details, or not completed the survey
      fully due to potential embarrassment.
    o I ensured people that the results were confidential and always gave them the
      chance to complete the survey by themselves in a private setting.
    • People might have rushed through the survey in order to get it done as quickly as
      possible.
    o I tried to keep the survey relatively short by cutting out questions that were
      unnecessary. However, I still included all important and relevant questions so that
      that the survey was of good quality yet people could take their time.
    • In my survey, I asked people what their cholesterol level was. A small amount of
      people may have put in a score that was old or inaccurate.
    • I hope that by surveying such a large amount of people I have overcome this.
    o To ensure that our results were as accurate as possible I used the chi-square test to
      analyse my data. This made sure that my results were at least 95% accurate.

3.6 Experimental Safety
There were not many safety hazards involved in doing my project. I always made sure that
my parents knew what I was doing at all times and that they were okay with it. When
conducting my surveys, I made sure that an adult was present at all times and that I had the
relevant permission to be surveying in the location that I was conducting the surveys. I
always checked that it was ok to take photos and that I made sure that participants were
okay with being photographed while filling out a survey. I deleted any photos that were not
being used in the report or display immediately.

Name: Ben Loughnane
Category: Individual, Intermediate, Social and Behavioural Sciences
School: Kinsale Community School, 3rd Year                                           20
BT Young Scientist and Technology Exhibition – January 2020
Project Title: A Statistical Analysis of the power of 0
4.Results
4.1 Survey Results
After collecting all surveys I ended up with X. I tried to get as broad a demographic as
possible while surveying. I initially screened all surveys for unfinished ones and then began
inputting my data into excel (it took a long time!) I did make mistakes along the way where I
would have to redo entire columns but it is a learning process and I got better as I went
along. I transferred my compiled data into a data program called JMP. The JMP program
gave me the ability to do man graphs and charts just like excel but it also allowed me to
produce a wide range of other graphs as well as allowing me to use statistical tests to
analyse my data. All the graphs and charts in this report have been produced by JMP.
4.2 Raw Data – Demographic Analysis
Demographics of population: I first choose to look at the spread of my demographic
population in the form of pie charts.
What is your gender?
Although there are slightly more females than males, there is still a roughly even amount in
my sample population and I don’t believe this will have affected my results.
Name: Ben Loughnane
Category: Individual, Intermediate, Social and Behavioural Sciences
School: Kinsale Community School, 3rd Year 21BT Young Scientist and Technology Exhibition – January 2020
Project Title: A Statistical Analysis of the power of 0
What age are you?
Although there is a clear age group that had the most participation in my survey, I was
delighted with this because this is the main age-group for which my research applies.
Looking at age within gender
Shown here is a further breakdown of the demographic information looking at age within
gender. You can see that there is an idea; balance between males and females. Again,
although the age-group participation is quite lopsided, I am happy with that because the 35-
60 age-group is the one to which my age group applies.
Name: Ben Loughnane
Category: Individual, Intermediate, Social and Behavioural Sciences
School: Kinsale Community School, 3rd Year 22BT Young Scientist and Technology Exhibition – January 2020 Project Title: A Statistical Analysis of the power of 0 4.3 Analysis of Results I then decided to look at the percentage breakdown of my results and illustrated these using a series of pie charts. The sample data which I have created is known as inferential statistics because the sample is used to predict the behaviour of the whole population: There is a quite a divided opinion among what is the leading cause of heart disease which suggests that many people are unsure of the correct answer. The correct answer is actually the build-up of plaque which 19.4% answered correctly. Many people believed it to be obesity or high cholesterol. While these things may be factors in the build-up of plaque it is the build-up of plaque overtime that causes the heart disease. This is through a common mistake where many people think that heart disease is an event when really it is a progressive disease (Ref 7). The build-up of plaque is not always as a result of high cholesterol etc. Name: Ben Loughnane Category: Individual, Intermediate, Social and Behavioural Sciences School: Kinsale Community School, 3rd Year 23
BT Young Scientist and Technology Exhibition – January 2020
Project Title: A Statistical Analysis of the power of 0

I can clearly see here that there is a very poor awareness of the calcification test in Ireland.
69.2% of the surveyed population were not aware of the test and I did not expect this
number to be so high. Although this test is very commonplace and well known in the USA
there is clearly a very poor awareness of this test in Ireland.

Only 4.6% of the population have taken this test. This is to be expected given that last then
1/3 of the population are even aware of the test. The test is clearly not well known and this
shows in these figures. An interesting fact is that the ESC guidelines state that a CT scan for
coronary calcium should be considered for cardiovascular risk assessment in asymptomatic
adults at moderate risk but this is clearly not being done in Ireland (Ref 7).

Name: Ben Loughnane
Category: Individual, Intermediate, Social and Behavioural Sciences
School: Kinsale Community School, 3rd Year                                                24
BT Young Scientist and Technology Exhibition – January 2020
Project Title: A Statistical Analysis of the power of 0

I can see here that close to exactly 50% of the population is aware of their cholesterol score.
When people were filling out surveys they often took them a couple of minutes to
remember it but I think it is positive that such a large number of people are taking the time
to check what there score is.

 You can see that there is very little difference in males and females in their awareness of
their cholesterol score.

Name: Ben Loughnane
Category: Individual, Intermediate, Social and Behavioural Sciences
School: Kinsale Community School, 3rd Year                                             25
BT Young Scientist and Technology Exhibition – January 2020
Project Title: A Statistical Analysis of the power of 0

Roughly 20% of people said that they have been prescribed medication for an above
average cholesterol level. I selected this group and analysed this groups responses to the
next few questions regarding medication side effects etc. because this is the group that I
believe is possibly being over medicated.

This shows the cholesterol medication used by people in question. 48% of people said that
they use Lipitor while 28.6% of people use Crestor which combines for over ¾ of the total
medication used.

Name: Ben Loughnane
Category: Individual, Intermediate, Social and Behavioural Sciences
School: Kinsale Community School, 3rd Year                                            26
BT Young Scientist and Technology Exhibition – January 2020
Project Title: A Statistical Analysis of the power of 0

                              How much did this medication cost?

Note: Medication costs for per 28 day/4-week cycle
Although the most common price point was €10 I was surprised to see that over half of
people are spending €20 or more on their medication. This means that over half of people
are spending upwards of €240 a year on medication.

Name: Ben Loughnane
Category: Individual, Intermediate, Social and Behavioural Sciences
School: Kinsale Community School, 3rd Year                                         27
BT Young Scientist and Technology Exhibition – January 2020
Project Title: A Statistical Analysis of the power of 0
Have you suffered from side effects and what are they?
Over 40% of medication users have suffered from side effects which shows how probable
the medication can be for users and the detrimental effect that statins can have on users
health. 25% of users have suffered from muscle pain which seems to be the most common
side effect that people suffer from.
Name: Ben Loughnane
Category: Individual, Intermediate, Social and Behavioural Sciences
School: Kinsale Community School, 3rd Year 28BT Young Scientist and Technology Exhibition – January 2020
Project Title: A Statistical Analysis of the power of 0
How much would you be willing to pay for this test?
This graph shows that 76% of people would be willing to pay €150 for the calcification test
in Ireland today and it was by far the most popular option. After calculations, I found that
the average price someone would be willing to pay for the test is €178.50. The test can be
obtained in Ireland for approximately €250. Given that the test can be taken for less than
$100 in the USA I was surprised to see how much people would be willing to pay to take the
test in Ireland and I think that if the price of the test could be slightly reduced to meet this
figure of €178.50 that it could be made much more accessible to everybody who wants to
take the test.
Name: Ben Loughnane
Category: Individual, Intermediate, Social and Behavioural Sciences
School: Kinsale Community School, 3rd Year 29BT Young Scientist and Technology Exhibition – January 2020
Project Title: A Statistical Analysis of the power of 0
Have you considered alternatives to your prescribed medication?
61.7% of medication users said that they have not considered alternatives to the prescribed
medication. This suggest that people may not have been made aware to alternatives by
medical professional. I was very surprised by these results because I had thought that
people would make an effort to explore alternatives given the side effects and cost side of
statins. I wonder how this answer would change if other alternatives were promoted to
statins (i.e the calcification test).
When I was handing out these surveys, A man who answered this question told me that he
had actually made use of this exact method (he had taken the test and found he did not
need to be taking the medication).
Name: Ben Loughnane
Category: Individual, Intermediate, Social and Behavioural Sciences
School: Kinsale Community School, 3rd Year 30BT Young Scientist and Technology Exhibition – January 2020 Project Title: A Statistical Analysis of the power of 0 Would you be open to taking a test that could reduce your need to take this medication? There is a clear majority of 79.1% who would be open to taking a test that could reduce their need to take this medication. However, less than 40% of people had considered alternatives to the medication. This again suggests to me that if people were presented with viable possible alternatives to the medication that they would be open to doing so. 4.4 The Chi Square Test After looking at my results in the bar and pie charts I decided to see if I could do some statistical analysis of the data. I chose to use the Chi Square test as it seemed to be the best test for the type of data I had. The Chi Square test would be able to tell me if my results were statistically significant or not. (Statistically significant means that my data would be a true representation of the entire population to a 95% confidence level). It simply means that I am able to show my results are reliable. I included the graphs that I found most interesting belo Name: Ben Loughnane Category: Individual, Intermediate, Social and Behavioural Sciences School: Kinsale Community School, 3rd Year 31
BT Young Scientist and Technology Exhibition – January 2020
Project Title: A Statistical Analysis of the power of 0

Contingency Analysis of Have you heard of the cardiac scan known as ‘the calcification
test’? By What is your gender?
Mosaic Plot

Contingency Table
What is your gender? By Have you heard of the cardiac scan known as ‘the calcification test’?

Count            No      Yes     Total
Total %
Col %
Row %
Female          426     184       610
               41.00   17.71     58.71
               59.17   57.68
               69.84   30.16
Male            294     135       429
               28.30   12.99     41.29
               40.83   42.32
               68.53   31.47
Total           720     319      1039
               69.30   30.70
Tests

          N       DF      -LogLike    RSquare (U)
       1039        1   0.10060782          0.0002

  ChiSquare      Prob>ChiSq
       0.201          0.3537
Name: Ben Loughnane
Category: Individual, Intermediate, Social and Behavioural Sciences
School: Kinsale Community School, 3rd Year                                                      32
BT Young Scientist and Technology Exhibition – January 2020
Project Title: A Statistical Analysis of the power of 0
[Contingency Analysis of Have you taken the calcification test? By What is your
gender?
Mosaic Plot
Contingency Table
What is your gender? By Have you taken this test?
Count No Yes Total
Total %
Col %
Row %
Female 597 13 610
57.46 1.25 58.71
60.24 27.08
97.87 2.13
Male 394 35 429
37.92 3.37 41.29
39.76 72.92
91.84 8.16
Total 991 48 1039
95.38 4.62
Tests
N DF -LogLike RSquare (U)
1039 1 10.328101 0.0531
Test ChiSquare Prob>ChiSq
Likelihood Ratio 20.656BT Young Scientist and Technology Exhibition – January 2020
Project Title: A Statistical Analysis of the power of 0
Contingency Analysis of Are you aware of your cholesterol score? By What is your
gender?
Mosaic Plot
Contingency Table
What is your gender? By Are you aware of your cholesterol score?
Count No Yes Total
Total %
Col %
Row %
Female 310 296 606
29.98 28.63 58.61
60.43 56.81
51.16 48.84
Male 203 225 428
19.63 21.76 41.39
39.57 43.19
47.43 52.57
Total 513 521 1034
49.61 50.39
Tests
N DF -LogLike RSquare (U)
1034 1 0.69645229 0.0010
Test ChiSquare Prob>ChiSq
Likelihood Ratio 1.393 0.2379
I can see from this chart that 52.57% of males were aware of their cholesterol score while
48.84% of females were aware of their score. Just over half of people surveyed were aware
of their score. I can see here that although this set of results is not statistically significant it
is trending in that direction at a 77% confidence level which means that there could be
some variation in future results.
Name: Ben Loughnane
Category: Individual, Intermediate, Social and Behavioural Sciences
School: Kinsale Community School, 3rd Year 34BT Young Scientist and Technology Exhibition – January 2020
Project Title: A Statistical Analysis of the power of 0
Contingency Analysis of Have you been precribed medication for an above average
cholesterol score? By What is your gender?
Mosaic Plot
Contingency Table
What is your gender? By Have you been prescribed medication for an above average cholesterol score?
Count No Yes Total
Total %
Col %
Row %
Female 517 86 603
50.29 8.37 58.66
62.21 43.65
85.74 14.26
Male 314 111 425
30.54 10.80 41.34
37.79 56.35
73.88 26.12
Total 831 197 1028
80.84 19.16
Tests
N DF -LogLike RSquare (U)
1028 1 11.149642 0.0222
Test ChiSquare Prob>ChiSq
Likelihood Ratio 22.299BT Young Scientist and Technology Exhibition – January 2020
Project Title: A Statistical Analysis of the power of 0
Contingency Analysis of Would you be open to taking a medical test that could reduce
your need to take this medication? By What is your gender?
Mosaic Plot
Contingency Table
What is your gender? By Would you be open to taking a medical test that could eliminate you from needing to
take this medication or reduce your need to?
Count I don’t No Not Yes Total
Total % know applicab
Col % le
Row %
Female 2 17 377 193 589
0.20 1.70 37.66 19.28 58.84
100.00 43.59 62.42 54.21
0.34 2.89 64.01 32.77
Male 0 22 227 163 412
0.00 2.20 22.68 16.28 41.16
0.00 56.41 37.58 45.79
0.00 5.34 55.10 39.56
Total 2 39 604 356 1001
0.20 3.90 60.34 35.56
Name: Ben Loughnane
Category: Individual, Intermediate, Social and Behavioural Sciences
School: Kinsale Community School, 3rd Year 36BT Young Scientist and Technology Exhibition – January 2020
Project Title: A Statistical Analysis of the power of 0
Tests
N DF -LogLike RSquare (U)
1001 3 6.0639717 0.0075
Test ChiSquare Prob>ChiSq
Likelihood Ratio 12.128 0.0070*
This set of results is taken from the entire surveyed population. Of the people who it applied
to, the large majority said that they would be willing to take the test. This set of results is
also statistically significant.
Name: Ben Loughnane
Category: Individual, Intermediate, Social and Behavioural Sciences
School: Kinsale Community School, 3rd Year 37BT Young Scientist and Technology Exhibition – January 2020
Project Title: A Statistical Analysis of the power of 0
Contingency Analysis of What medication were you prescribed? By Gender
Mosaic Plot
Contingency Table
Gender By What medication were you prescribed?
Count Crestor Lipitor Not Other Pravach Zocor Total
Total % (Rosuva (Atorvas Applica ol (Simvast
Col % statin) tatin) ble (Pravast atin)
Row % atin)
Female 22 41 0 10 2 9 84
11.22 20.92 0.00 5.10 1.02 4.59 42.86
39.29 43.62 0.00 50.00 33.33 52.94
26.19 48.81 0.00 11.90 2.38 10.71
Male 34 53 3 10 4 8 112
17.35 27.04 1.53 5.10 2.04 4.08 57.14
60.71 56.38 100.00 50.00 66.67 47.06
30.36 47.32 2.68 8.93 3.57 7.14
Total 56 94 3 20 6 17 196
28.57 47.96 1.53 10.20 3.06 8.67
Tests
N DF -LogLike RSquare (U)
196 5 2.5056003 0.0096
Test ChiSquare Prob>ChiSq
Likelihood Ratio 5.011 0.4145
We can clearly see from this set of results that Lipitor is the most popular form of
medication used. However, this set of results is not statistically significant and may produce
different results if done again.
Name: Ben Loughnane
Category: Individual, Intermediate, Social and Behavioural Sciences
School: Kinsale Community School, 3rd Year 38BT Young Scientist and Technology Exhibition – January 2020
Project Title: A Statistical Analysis of the power of 0
Contingency Analysis of In your opinion, what is the leading the leading cause of heart
disease? By What age are you?
Mosaic Plot
Contingency Table
What age are you? By In your opinion, what is the leading the leading cause of heart disease?
Count Alcohol Build-up Excessive Excessive High High Obesity Other Smoking Total
Total % consumpt of plaque alcohol smoking blood Cholestrol
Col % ion consumpt pressure
Row % ion
18-35 0 20 2 0 11 42 42 0 9 126
0.00 2.35 0.24 0.00 1.29 4.94 4.94 0.00 1.06 14.82
0.00 12.35 22.22 0.00 9.73 16.67 19.00 0.00 10.34
0.00 15.87 1.59 0.00 8.73 33.33 33.33 0.00 7.14
35-60 2 121 5 3 67 175 155 1 64 593
0.24 14.24 0.59 0.35 7.88 20.59 18.24 0.12 7.53 69.76
100.00 74.69 55.56 100.00 59.29 69.44 70.14 100.00 73.56
0.34 20.40 0.84 0.51 11.30 29.51 26.14 0.17 10.79
60+ 0 21 2 0 35 32 18 0 12 120
0.00 2.47 0.24 0.00 4.12 3.76 2.12 0.00 1.41 14.12
0.00 12.96 22.22 0.00 30.97 12.70 8.14 0.00 13.79
0.00 17.50 1.67 0.00 29.17 26.67 15.00 0.00 10.00
Under 18 0 0 0 0 0 3 6 0 2 11
0.00 0.00 0.00 0.00 0.00 0.35 0.71 0.00 0.24 1.29
0.00 0.00 0.00 0.00 0.00 1.19 2.71 0.00 2.30
0.00 0.00 0.00 0.00 0.00 27.27 54.55 0.00 18.18
Total 2 162 9 3 113 252 221 1 87 850
0.24 19.06 1.06 0.35 13.29 29.65 26.00 0.12 10.24
Name: Ben Loughnane
Category: Individual, Intermediate, Social and Behavioural Sciences
School: Kinsale Community School, 3rd Year 39BT Young Scientist and Technology Exhibition – January 2020
Project Title: A Statistical Analysis of the power of 0
Tests
N DF -LogLike RSquare (U)
850 24 24.825217 0.0180
Test ChiSquare Prob>ChiSq
Likelihood Ratio 49.650 0.0016*
You can see in this chart that in the 60+ category, more people think that the leading cause
of heart disease is high cholesterol, while amongst people aged 18-35, smoking is seen as
the most likely cause of heart disease. This set of results is statistically significant to a 99%
confidence level.
4.5 The Student t Test
After I had analysed the responses to the questions in my survey I realised that I had
some numerical data that couldn’t be analysed using the chi square test. I began to
research another way to analyse this information and found the student t test.
A man called William Gosset who was a brewer in Guinness’s in Dublin who was
studying brewing samples and came up with a new statistical test to analyse his data
from his samples. He was not allowed by his employer to announce it under his own
name so he instead used a fake name called Student and the student t test was born.
I decide to see if I could use this test using JMP software. Some of my results are
shown below.
Name: Ben Loughnane
Category: Individual, Intermediate, Social and Behavioural Sciences
School: Kinsale Community School, 3rd Year 40BT Young Scientist and Technology Exhibition – January 2020
Project Title: A Statistical Analysis of the power of 0
Oneway Analysis of What is the estimated monthly cost of this medication? By What is
your gender?
Means Comparisons
Comparisons for each pair using Student's t
Confidence Quantile
t Alpha
1.97160 0.05
LSD Threshold Matrix
Abs(Dif)-LSD
Male Female
Male -3.4886 -1.3951
Female -1.3951 -2.3075
Positive values show pairs of means that are significantly different.
We can see here that although there is a slight difference in the amount of money being
spent between gender but it is quite small and not enough to warrant saying they are
significantly different.
Name: Ben Loughnane
Category: Individual, Intermediate, Social and Behavioural Sciences
School: Kinsale Community School, 3rd Year 41BT Young Scientist and Technology Exhibition – January 2020
Project Title: A Statistical Analysis of the power of 0
Oneway Analysis of If yes, how much would you be prepared to pay for this test? By
What is your gender?
Means Comparisons
Comparisons for each pair using Student's t
Confidence Quantile
t Alpha
1.96446 0.05
LSD Threshold Matrix
Abs(Dif)-LSD
Male Female
Male -18.429 8.405
Female 8.405 -10.226
Positive values show pairs of means that are significantly different.
In this graph, you can see that there is a statistically significant difference in the amount that
males and females were willing to pay for the calcification test. I am able to tell this from
the graph but also from the fact that there are two positive values in the set of results. This
means that the pair of means are significantly different. Evidently, males are willing to pay
more for the test than females.
Name: Ben Loughnane
Category: Individual, Intermediate, Social and Behavioural Sciences
School: Kinsale Community School, 3rd Year 42BT Young Scientist and Technology Exhibition – January 2020
Project Title: A Statistical Analysis of the power of 0
5.Conclusions and Recommendations
1.4 Results Summary
• I had a close to even split between Males and Females, with a 57.9% - 42.1% split.
• The majority of survey participants were in the age group of 35-60.
• 30% of people thought that high cholesterol was the leading cause of heart disease
while 26% thought that the leading cause was obesity – both incorrect.
• Only 30.8% of people were aware of the calcification test with 69.2% of people
unaware of the test.
• Very few people have actually taken the test with 4.6% of people saying that they
have taken the test.
• 50.4% of people were aware of their cholesterol score.
• Approximately 20% of people surveyed have been prescribed medication for an
above average cholesterol score.
• The most commonly used medication was Lipitor (Atorvastatin) with 48% of people
using it.
• Over half of statin users are spending over €20 a month on their medication
• The most common side effect of using cholesterol medication was muscle pain.
• 79.1% of people would be open to taking the calcification test.
• The average price that people would be willing to pay for the test is €178.50.
1.5 Conclusion
After conducting my research, I know that the test fits official screening criteria for
mainstream use of the test and is recommended by the European Society of Cardiology to
be taken by all middle-aged people in Ireland. However, it is probably not economically
viable at this stage to have untargeted screening in Ireland on a mass scale due to the
limited availability of the test and the lack of knowledge regarding the test in the medical
community.
Recommendation: I believe that there is a place in Ireland where that
CAC screening could be used on a larger scale by using it in a targeted
fashion. For example,
Concern/Symptom/Family History -> Calcification test -> Further tests
(Angiogram, Heart Echo etc.).
Name: Ben Loughnane
Category: Individual, Intermediate, Social and Behavioural Sciences
School: Kinsale Community School, 3rd Year 43You can also read