Analysis of Stray Losses in Power Transformers by 3-D Magnetic Field Simulation
←
→
Page content transcription
If your browser does not render page correctly, please read the page content below
Fifteenth National Power Systems Conference (NPSC), IIT Bombay, December 2008
Analysis of Stray Losses in Power Transformers by
3-D Magnetic Field Simulation
Chetan C. Adalja, M.L. Jain, Technology Department, EMCO Limited, Thane, India
Abstract—Transformer is a vital link in the power system,
which is connected in the network at different stages right from II. CASE STUDY
the generating station to the user’s premises. The T&D losses
in the Indian power system ranges from 10-50%, which is Accurate estimation of stray losses at design stage is a
significantly high. In this, the contribution of transformers prerequisite for a cost-effective and reliable design of
exceeds 6% of the total power generated. Although the transformer. Towards this, a case study was carried out on a
transformer is the most energy efficient equipment in the 100 MVA, 220/66/11 kV system transformer with S.C.
system, yet it would be expedient to make an attempt to further impedance at maximum, normal and minimum tap positions
reduce the losses in it to improve the overall system efficiency.
of 10.46%, 10.20% and 10.04% respectively and load losses
In this context, a case study was undertaken to analyze various
components of stray losses in power transformer and assess the of 245 kW (at normal tap) involving 3-D magnetic field
scope for their optimization. mapping and estimation of stray losses. As a first step, stray
The load losses in the transformer consist of I2R & stray losses in the transformer were estimated by to-the-scale
losses. In large rating transformer, the stray losses constitute modeling of transformer and 3-D field mapping for a
about 20-25% of the total load losses. Designers adopt various standard design. Moreover, the influence of shunt
cost-effective measures to minimize the losses and make the dimensions and edge stack construction in two halves on
transformer more efficient. These losses could be controlled to stray losses was also studied. The solution to the problem
a level of 8-10% by means of magnetic shunts judiciously
placed so as to canalize the leakage flux. However optimum
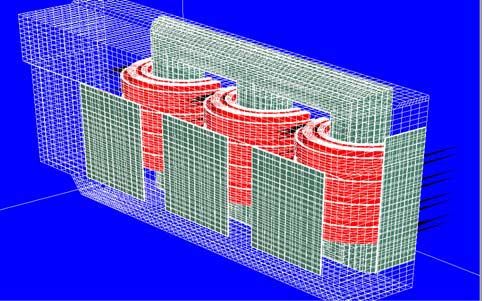
was attempted by plotting the 3-D magnetic field on both
location of these shunts calls for accurate knowledge of 3-D HV & LV sides. Fig. 1 below shows the modeled HV side
flux mapping. Some of the commercially available software 3-D geometry using software program. Similarly, the LV
programs support 3-D field simulation studies for estimation of side geometry is modeled and analyzed.
stray losses with fairly good accuracy. Depending on the
accuracy requirement, these programs could be exploited to a
varying degree to achieve the desired results. This paper
presents a case study involving estimation of stray losses in a
100 MVA, 220/66/11 kV system transformer using an Integral
Equation Method (IEM) and Finite Element Method (FEM)
based EDMAG-3D software program. To present a
comprehensive picture of total stray losses, the winding stray
losses due to axial and radial magnetic fields are also calculated
using 2-D programs.
I. INTRODUCTION
The stray losses in a transformer comprise winding stray
losses, viz. eddy loss and circulating current loss; the loss in
the edge stack (smallest packet of the core limb); and the Fig. 1. Modeled HV side geometry of Transformer
loss in structural parts, viz. frame, flitch plate and tank. Core
loss at the impedance voltage being insignificantly low, is III. METHODOLOGY
not considered in the present analysis. In case of large The software tool, based on Integral Equation Method
generator transformers, stray losses due to high current (IEM) and Finite Element Method (FEM) is used for stray
carrying leads also become significant. As the total stray losses analysis. This involves estimation of 3-D magnetic
losses with shielding measures in large rating transformers field intensity (H, A/m) and induction (B, Tesla) together
are of the order of 20-25% of the total load losses, it is with the eddy current losses in the structural parts and the
imperative to estimate stray losses accurately as control over resultant temperature rises. It calculates values of the
these gives a competitive advantage. Measures like using magnetic field quantities at pre-defined locations in space,
judiciously designed magnetic shunts help reduce the stray as a sum of field created by the current sources (windings,
losses effectively [1]. leads) with specified distribution of current using Biot-
The estimation of stray losses in structural parts of Savart law and the field created by the fictitious magnetic
transformer at design stage is generally carried out by using charges on the interface of magnetic and nonmagnetic media
empirical formulae covering wide range of design variants (to account for ferromagnetic magnetization) using
and complicated asymmetrical geometries. These formulae algebraization of integral equations.
therefore inherently suffer form unpredictable inaccuracies, The complete transformer, comprising Core, Windings,
which would be actually known only at final testing stage. Frames, Flitch plates, Tank, Wall shunts and the epures
However, with the availability of high speed and accurate (pre-defined line on which magnetic field values are
computational tools and software programs [2] it is possible computed in all 3-directions) is modeled for stray losses
to simulate complex geometries for 3-D electromagnetic estimation. The field quantities obtained at these epures are
fields mapping and precise estimation of stray losses at used for estimation of stray losses.
drawing-board stage.
498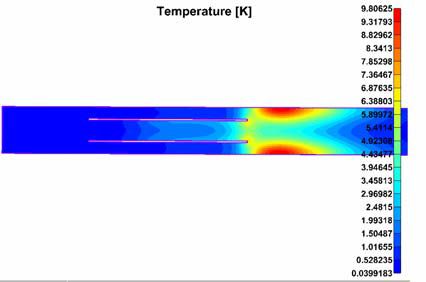
Fifteenth National Power Systems Conference (NPSC), IIT Bombay, December 2008

                                                                                  Table I & II show these values at normal and extreme tap
                  IV. ESTIMATION OF STRAY LOSSES                                positions on HV and LV side tank respectively.
  This section explains the modeling of transformer                                                          TABLE I
                                                                                        MAGNETIC FIELD STRENGTH ON HV SIDE TANK SURFACE
geometries and estimation of stray losses in structural parts,                                         Magnetic field Intensity
viz. tank, wall shunts, frames, flitch plates and edge stack.                                                                    Seff
                                                                                          Mode             (HV Side), A/m
                                                                                                                                (mm2)
The losses in different structural parts of transformer are                                          Heff,    Heff_w       Hmax
computed as follows.                                                                     Max. Tap     414      501         1601 48.63
                                                                                         Nor. Tap     607      743         2455 48.63
   A. Estimation of stray loss in Tank                                                   Min. Tap     644      795         2846 48.63
   The tank is made of mild steel having a nonlinear                                                        TABLE II
                                                                                        MAGNETIC FIELD STRENGTH ON LV SIDE TANK SURFACE
permeability. The software tool first calculates the magnetic
                                                                                                       Magnetic field Intensity
field value at the tank surface by decoupling the effect of                                                                       Seff
                                                                                           Mode            (LV Side), A/m
                                                                                                                                 (mm2)
nonlinearity. After estimation of the magnetic field, losses                                         Heff,    Heff_w       Hmax
are calculated considering nonlinearity by an iterative                                  Max. Tap     422       478        1447  43.76
estimation of coefficient of the tank influence factor.                                  Nor. Tap     620       710        2337  43.76
                                                                                         Min. Tap     649       739        2453  43.76
   The geometry of the tank is modeled by slicing it at
different heights and then connecting these levels using                        The stray losses in tank computed from the above magnetic
vertically defined epures. Fig. 2 shows the local coordinate                    field intensity values are presented in Table III below.
                                                                                                             TABLE III
system of the tank depicting the horizontal and vertical
                                                                                                        STRAY LOSSES IN TANK
epures.                                                                                                          Stray loss, kW
                                                                                                Mode
                                                                                                          HV Side     LV Side           Total
                                                                                               Max. Tap     6.54        7.06            13.60
                                                                                               Nor. Tap     6.48        7.00            13.48
                                                                                               Min. Tap     5.48        6.47            11.95
                                                                                The above trend of stray losses in tank follows the leakage
                                                                                impedance pattern.
                                                                                   B. Estimation of stray loss in Wall Shunts
                                                                                   Shunts are made of CRGO material and modeled as
                                                                                ferromagnetic bodies with linear permeability. The wall
                                                                                shunts modeled on HV side of transformer tank are shown
                                                                                in Fig. 1 above. The total 7 wall shunts are provided (viz. 3
                                                                                on HV side, 3 on LV side and 1 on side wall) to reduce tank
                                                                                stray losses. The epures are pre-defined at HV & LV side
Fig. 2. Local co-ordinate system for modeling of tank                           wall shunts locations to estimate stray losses.
                                                                                   Fig. 4 below shows the plot of the modulus of flux density
  Fig. 3 below shows the variation of the modulus of flux
                                                                                components (Bx, By, Bz) along the height of the shunts
density components (Bx, By, Bz) along the height of the
                                                                                (opposite to the winding on LV side at central phase) for
tank surface (on HV side) opposite to the winding axis of
                                                                                normal tap position. The curves A, B & C indicate the
central phase and considering all wall shunts in place.
                                                                                components of flux density, i.e. normal, along the width and
                                                                                the height of the shunt respectively.

Fig. 3. Flux density variation on the HV Side tank surface at central phase
(opposite to winding axis)
                                                                                Fig. 4. Flux density profile in shunts placed on LV side of tank wall
   In order to compute losses in the tank it is necessary to
obtain the values of Heff, Heff_w, Hmax and Seff. Where,                          For computation of stray loss in the shunts, it is necessary
Heff: effective tangential magnetic field strength on the tank                  to obtain values of B1, B2, L1 and L2 as represented by
surface (A/m); Heff_w: effective tangential magnetic field                      notations in Fig. 4. The peak values of magnetic field at
strength (opposite to the winding axis) on the tank surface                     normal tap position for first triangle is 0.01035T (B1) with
(A/m); Hmax: maximum tangential magnetic field strength                         base 1025mm (L1) and second triangle is 0.01054T (B2)
on the tank surface (A/m) & Seff: loss emission area (mm2).                     with base 1645 mm (L2) respectively.

                                                                              499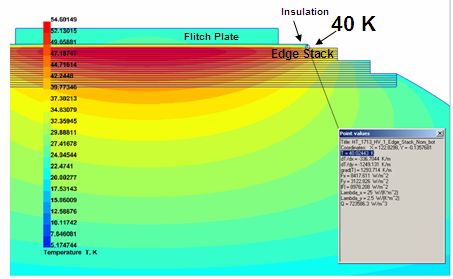
Fifteenth National Power Systems Conference (NPSC), IIT Bombay, December 2008

 The stray loss values in shunts, estimated based on above               typically at normal tap position, obtained for top and bottom
magnetic field values, are indicated in Table IV below.                  frame are as under. See Table V.
                             TABLE IV                                                                 TABLE V
                       STRAY LOSSES IN SHUNTS                                         MAGNETIC FIELD CONCENTRATION IN FRAMES
                                 Stray loss, kW                                                             Magnetic field (B), T
         Mode
                     HV Side   LV Side     Side Shunt          Total                                    Top Frame      Bottom Frame
       Max. Tap       0.78      2.51          0.54             3.83                Maximum value (B1)    0.00744          0.02022
       Nor. Tap       1.38      2.54          0.36             4.28                Minimum value (B2)    0.00032          0.00139
       Min. Tap       0.76      1.47          0.25             2.48         The field concentration in the bottom frame is over 2.7
  It is observed that the stray loss values in HV side shunts            times of that in top frame. This is attributed to lesser
are lower than those on LV side due to their smaller height              distance between the winding bottom edge and the bottom
and larger distance from the outer most winding.                         frame.
  C. Estimation of Stray Loss in Frames                                     Similarly, the maximum and minimum field values are
                                                                         obtained for top and bottom frames both for HV and LV
  Frames, also called yoke beams, are made of mild steel                 sides of transformer at extreme tap positions. The loss in the
material and are used for clamping of yokes and supporting               frames calculated from magnetic field values is as shown in
the windings. The frames are modeled as epures coinciding                Table VI below.
with their physical locations for magnetic field plotting and                                            TABLE VI
estimation of losses.                                                                              STRAY LOSS IN FRAMES
  Fig. 5 & 6 below show the plots of the modulus of flux                              Mode
                                                                                                             Stray loss, kW
density components (Bx, By, Bz) in top & bottom frames                                             Top Frame    Bottom Frame           Total
                                                                                    Max. Tap         0.98            1.74              2.72
along the height of the frame (from bottom to top) on the                           Nor. Tap         0.82            1.43              2.25
HV side of the transformer at normal tap position. For                              Min. Tap         0.58            1.24              1.82
estimation of loss in the frames, it is essential to obtain the            The loss in the bottom frame, which is higher as compared
maximum and minimum values of flux densities occurring                   to the top frame, is commensurate with the higher flux
along the height of the frames, which is represented by                  concentration in the bottom frame.
notations B1 & B2 in Fig. 5 & 6.
                                                                             D. Estimation of Stray Loss in Flitch Plates
                                                                           Flitch plates, made of MS and with slots at top and
                                                                         bottom positions are used in the present case. The flitch
                                                                         plates are 200 mm wide and 12mm thick modeled to the
                                                                         scale, taking care of the slots and analysis carried out using
                                                                         FEM technique. It is important to note that the stray losses
                                                                         in such structural elements are quite low but the incident
                                                                         magnetic field on them can be quite high for the exposed
                                                                         area leading to unacceptable local hot spots. Fig. 7 & 8
                                                                         shows the vector plot of eddy current density J (A/m2) and
                                                                         temperature rise profile (K) from minimum to maximum
                                                                         value differentiated by a colour band from blue to red, red
                                                                         being the highest.

Fig. 5. Flux density variation along the height of the Top Frame

                                                                             Fig. 7. Vector plot of current density J (A/m2) in Flitch Plate

                                                                            The magnetic field impinging on flitch plates induces
                                                                         eddy currents. The eddy current loops are shown in both
Fig. 6. Flux density variation along the height of the Bottom Frame      solid and slotted regions in Fig. 7. The magnitude of normal
                                                                         flux density being the highest at top and bottom winding
   It is observed that owing to the proximity effect, the                edges, it results in higher losses and hotspots in those
maximum flux density occurs in the bottom part of top                    regions of the flitch plates. In order to avoid such situations,
frame and the top part of bottom frame.                                  the slots are provided in the flitch plates at both top and
   The maximum and minimum values of flux densities,                     bottom locations.

                                                                       500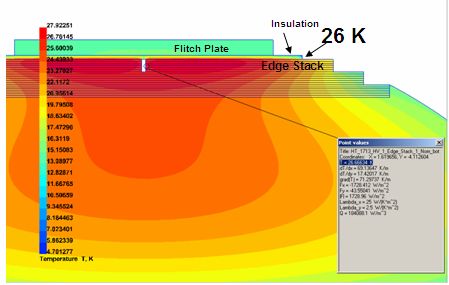
Fifteenth National Power Systems Conference (NPSC), IIT Bombay, December 2008

  Based on the magnetic field and eddy current density, the             normal tap position on the HV side of the transformer. The
losses are calculated for principal and extreme tap positions           curves A, B and C indicate the component of flux densities
in the flitch plates as shown in Table VII below.                       normal to the edge stack, along the width of edge stack and
                             TABLE VII                                  along the height of edge stack respectively.
                   STRAY LOSS IN THE FLITCH PLATES                         As the magnitude of normal magnetic flux density is
                     Mode            Stray loss, kW                     higher at the top and bottom winding edges, Fig. 9
                    Max. Tap              0.65
                    Nor. Tap              0.62                          represents first and second triangle with peak value flux
                    Min. Tap              0.52                          densities 0.04270T & 0.04422T respectively (at winding
                                                                        edges) along the height of edge stack. The length covered by
                                                                        first and second triangle is represented by notations L1 & L2
                                                                        in Fig. 9 is 635 & 710 mm respectively and distance
                                                                        between the peaks of two triangles represented by notation
                                                                        L12 in Fig. 9 is 1544 mm.

 Fig. 8. Temperature profile in Flitch Plate

   The temperature profile in the flitch plate is estimated by
specifying heat transfer co-efficient and using 3-D FEM.
   Well, in absolute terms, the stray losses in flitch plates
may not form a significant part of the total losses of the
transformer [3]. Nevertheless, it deserves designer’s
attention as it could cause abnormal local hotspot rise in the
flitch plates, and that in-turn disintegration of oil in the close
vicinity, and consequential generation of fault gases, which                 Fig. 9. Flux density variation along the height of the Edge Stack
could be misconstrued as fault / defect in the transformer.
   The effect of using non-magnetic material (stainless steel)
for flitch plate with following combination of slots was
studied and the results obtained are shown in Table VIII
below.
     a) Flitch plate without slot
     b) Flitch plate with slots at top and bottom
     c) Flitch plate with slot(s) throughout winding height

                           TABLE VIII
        STRAY LOSS IN FLITCH PLATE WITH DIFFERENT DESIGNS
                                  Stray loss, kW
             MS Plate      SS Plate       SS Plate   SS Plate with
  Mode      with slots at  without     with slots at     slot(s)
                top &        slot          top &      throughout
               bottom                     bottom     winding height
 Max. Tap        0.65       1.416          0.485         0.291
 Nor. Tap        0.62       1.324          0.458         0.286
 Min. Tap        0.52       1.248          0.425         0.252
                                                                            Fig. 10. Flux density variation across the height of the Edge Stack at top
                                                                            winding edge position
From the above, it is observed that for a given design of
flitch plate,                                                              The average value of magnetic field across the length of
     a) Loss in SS plate without any slot is the highest                edge stack is computed from Fig. 10. The maximum and
     b) Loss in SS plate with slots at top and bottom is about          minimum value of magnetic field at top winding edge
         26% less than that with MS plate                               position across the edge stack, represented by notations Bm1
     c) Loss in SS plate with slot(s) throughout the winding            & Bm2 in Fig. 10, is 0.07285T & 0.04379T respectively.
         height is about 54% less than that with MS plate               Similarly, the maximum and minimum value of magnetic
                                                                        field at bottom winding edge is also obtained. These
  E. Estimation of stray loss in Edge Stack                             magnetic field values are estimated for all phases at
  Stray loss in edge stack occurs due to flux impinging                 principal & extreme tap positions on both HV & LV sides of
normally (radially) on the outermost packet of the core.                transformer. The stray loss based on above magnetic field
  For estimation of stay loss in edge stack it is essential to          values estimated in edge stack is shown in Table IX below.
compute the 3-D magnetic field values along & across the
height of the edge stack. Fig. 9 & 10 below show the plots
of the modulus of flux density components (Bx, By, Bz)
along and across the height of edge stack respectively, at

                                                                      501
Fifteenth National Power Systems Conference (NPSC), IIT Bombay, December 2008
TABLE IX respect to the windings, type and material. In the present
STRAY LOSS IN EDGE STACK case study, the height of magnetic wall shunts was increased
Mode Stray loss, kW
by 645 mm on HV side of tank wall to attract larger chunk
Max. Tap 4.90
Nor. Tap 5.40 of the leakage flux entering the tank and the results obtained
Min. Tap 4.38 with above modification are shown in Table XII below.
TABLE XII
F. Total stray load losses COMPARISON OF ESTIMATED TANK LOSS WITH MODIFIED SHUNT
The stray losses in winding i.e. eddy losses are also Tank stray loss, kW Reduction in
Mode loss (%)
measured as part of total stray losses during testing and are Standard Shunt Modified Shunt
practically inseparable; hence same are calculated through Max. Tap 13.60 12.13 10.80
Nor. Tap 13.48 11.68 13.33
another 2-D package and added to the structural losses to get
Min. Tap 11.95 10.59 11.41
the total stray losses. The total stray losses in all structural
It is observed that increase in shunt height results in
parts and windings are computed at normal and extreme tap
reduction in the tank loss significantly. This in turn does
positions and the details are as summarized in Table X have the effect of increasing the loss in the shunts, which is
below. marginal and hence ignored while reporting the total stray
TABLE X
losses with modification.
TOTAL STRAY LOAD LOSSES IN TRANSFORMER
Sr. Component Stray losses, kW B. Modification in Edge Stack
No. Max. Tap Nor. Tap Min. Tap
1 Tank 13.60 13.48 11.95 In large transformer, the radially incident flux may cause
2 Shunts 3.83 4.28 2.48 considerable eddy current loss in the edge stack, resulting in
3 Frames 2.72 2.25 1.82 abnormal local hot spots, thereby increasing the risk of
4 Flitch Plates 0.65 0.62 0.52
5 Edge Stack 4.90 5.40 4.38 bubbling of oil in the local vicinity. Effect of division of the
6 Winding eddy losses 27.67 27.03 21.86 edge stack on the stray loss was studied and the estimated
Total Stray + Eddy losses 53.37 53.06 43.02 results are reported in Table XIII below.
Distribution of component stray losses, calculated as TABLE XIII
percentage of the total stray load losses at normal tap COMPARISON OF LOSS IN EDGE STACK
position is represented in Fig. 11 below. Edge Stack stray loss, kW Reduction in
Mode
Standard design Modified design loss (%)
Max. Tap 4.90 2.18 55.51
Nor. Tap 5.40 2.57 52.42
Min. Tap 4.38 2.09 52.27
The temperature profile of the edge stack is also analyzed.
The losses in the core blade packets including edge stack
and flitch plates are estimated and corresponding loss
density values entered into the program. The various heat
transfer co-efficients at outer core boundary surface are also
specified to solve planar temperature field in core blade
packets. Fig. 12 & 13 show the temperature profile of core
cross-section without & with division of the edge stack. The
Fig. 11. Component stray losses as percentage of the total stray losses
temperature profile is differentiated from minimum to
The estimated values of stray losses are compared with maximum by blue to red colour band.
the tested values to validate the above results.
V. COMPARISON OF STRAY LOSS RESULTS
Comparison of the stray losses estimated by software
program and the measured test results is shown in Table XI
below.
TABLE XI
COMPARISON OF TOTAL STRAY LOSSES
Sr. Total Stray losses, kW
Component
No. Max. Tap Nor. Tap Min. Tap
1 Tested values 52.98 49.95 46.93
2 Estimated values 53.37 53.06 43.02
Deviation -0.74 % -6.22 % 8.33 %
The reference tested values vis-à-vis the estimated values Fig. 12. Temperature profile in standard edge stack design
show a deviation of -0.74%, -6.22% & 8.33% at maximum,
normal and minimum tap positions respectively.
VI. CONTROL OF STRAY LOSSES
A. Shunt design modification
Magnetic shunts are effective in controlling the structural
stray losses as they offer high permeable path to the leakage
flux. The design of magnetic shunts depends on various
factors, viz. length, width and height, placement with
502Fifteenth National Power Systems Conference (NPSC), IIT Bombay, December 2008
losses in the flitch plates.
VIII. FURTHER WORK
Precise estimation of stray losses is a subject in itself. It
may not be prudent to attempt very precise simulation for
computation of stray losses in routine designs disregarding
the economic considerations. However, application of
modern high speed and accurate computation tools offer
deep insight into the complex field phenomena in
asymmetric transformer geometries. There is a wide scope
to exploit these tools for development of new cost-effective
designs, exploring possibilities for improvements in certain
areas like shunt materials, use of yoke shunts, use of width-
Fig. 13. Temperature profile in modified edge stack design wise wall shunts [4] etc.
It is observed that in the present case the stray loss is ACKNOWLEDGEMENTS
reduced by 52% at normal tap position and hotspot The authors are grateful to the EMCO Management for
temperature rise is reduced by 14 K after the division of granting permission to publish this paper.
edge stack in two halves, which is quite significant.
C. Total stray losses in transformer after modification REFERENCES
[1] Ramaswamy E, Sarma D V S, Lakhaini V K, “Design of magnetic and
The total stray losses estimated in the transformer with non-magnetic shunts for a power transformer using EDMAG-3D”, XI
modified shunt and divided edge stack are presented in International Scientific Conference, Transformer Building-2005,
Table IXV below. September 2005, pp. 70-77.
[2] Turowski, J., Turowski, M., and Kopec, M., “Method of three-
TABLE IXV dimensional network solution of leakage field of three-phase
TOTAL STRAY LOAD LOSSES WITH MODIFIED SHUNT transformers”, IEEE Transactions on Magnetics, Vol. 26, No. 7,
AND DIVIDED EDGE STACK
September 1990, pp. 2911-2919.
Sr. Stray losses, kW [3] D A Koppikar, S V Kularni, PN Srinivas, S A Khaparde, R. Jain,
Component
No Max. Tap Nor. Tap Min. Tap “Evaluation of flitch plate losses in power transformers”, IEEE
1 Tank 12.13 11.68 10.59 Transections on Power Delivery, Vol. 14, No. 3, July 1999.
2 Shunts 3.83 4.36 1.35 [4] Prof. S V Kulkarni & Prof. S. A. Khaparde, Transformer
3 Frames 2.72 2.25 1.82 Engineering – Design and Practice, Marcel Dekker, New York 2004,
4 Flitch Plate 0.65 0.54 0.62 pp. 169-230.
5 Edge Stack 2.18 2.57 2.09
6 Winding eddy losses 27.67 27.03 21.86 About the Authors:
Total Stray + Eddy losses 49.18 48.43 38.33
Mr. Chetan C Adalja, born in
D. Comparison of total stray losses after modification April 1982, a gold medalist from
The comparison of stray losses after modification in shunt Nirma University, completed his
graduation in Electrical Engineering
and edge stack is shown in Table XV below. from CKPCET, Surat, South Gujarat
TABLE XV University in 2003, followed by post-
COMPARISON OF STRAY LOSSES AFTER MODIFICATION graduation in 2005 in PAS-Power
Sr Total stray losses, kW Apparatus and Systems from Nirma
Design
No. Max. Tap Nor. Tap Min. Tap University, Ahmedabad. He started
1 Standard 53.37 53.06 43.02 his professional career as Lecturer at
2 After Modification 49.18 48.43 38.33
Engineering College in Surendranagar, Gujarat.He has been associated
Reduction 4.19 4.63 4.68
with EMCO Limited from 2006 and working as a senior engineer in
The results show that the modification in shunts and edge Technology Department. He has authored 3 technical papers.
stack effect reduction in the total stray losses by 4.19 kW,
4.63 kW & 4.68 kW at maximum, normal and minimum tap Mr. M.L. Jain, born in December
1945, completed his graduation in
positions respectively. Electrical Engineering from MNNIT,
Allahabad University in 1968,
VII. CONCLUSIONS followed by post-graduation in 1970
in Design and Production
1. Stray losses in a transformer can be precisely estimated Engineering – Heavy Electrical
using EDMAG-3D software program that is a powerful Equipment from MANIT Bhopal. He
tool to aid fairly accurate 3-D field mapping of complex started his professional career as
transformer design and development
transformer asymmetries. engineer in BHEL Bhopal in 1971.
2. The loss in the bottom frames is higher than the top From 1979 onwards upto 1996, Mr. Jain was associated with testing
frames because of its close proximity with bottom edge of of transformers and other HV equipments. He has authored a chapter
the winding. It was observed that lowering of the bottom on testing of transformers and reactors in BHEL monograph
‘Transformers’ published by Tata McGraw-Hill. Since 1996, Mr. Jain
frame height resulted in reduced frame losses. This is has been associated with EMCO Limited. Having worked as Head of
attributed to its reduced interaction with the leakage field Testing & Quality disciplines, he is presently Vice President –
returning to the bottom yoke. Technology, responsible for up-gradation of transformer technology.
3. The stray loss in edge stack is significant, leading to He has authored over 20 technical papers in the field of transformer
design analysis, testing and diagnostics. He is representing EMCO on
localized hotspot. Division of the edge stack effects professional bodies like BIS and CBIP, and is a member of
substantial reduction in loss as well as the temperature. CIGRE(I).
4. Choosing appropriate material for flitch plate and
judicious slot dimensioning could effect reduction in stray
503You can also read