Analysis of the National Infrastructure and Construction Pipeline 2021 - Reporting to Cabinet Office and HM Treasury
←
→
Page content transcription
If your browser does not render page correctly, please read the page content below
Analysis of the National
Infrastructure and
Construction Pipeline 2021
August 2021

                 Reporting to Cabinet
                 Office and HM Treasury
Analysis of the National
Reverse landscape         Reverse stacked

Infrastructure and
Construction Pipeline 2021
August 2021

                    Reporting to Cabinet
                    Office and HM Treasury
Contents
3 20
Ministerial Forward Projected Investment Over the Next 10 Years
4 21
Chief Executive Forward Regional Analysis of the Investment in the
Pipeline from 2021/22 to 2024/25
6 Limitations of the Methodology
Summary
Future Procurements 25
Future Investments Workforce Demand Analysis from 2021/22 to
Modern Methods of of Construction (MMC) 2024/25
Future Workforce Requirement Workforce Requirement to Deliver
Planned Investment in the Pipeline
from 2021/22 to 2024/25
9 Limitations of the Analysis
Analysis of the 2021 Pipeline
Procurements in 2021/22 by Sector
Procurements in 2021/22 by Work Type 27
Contract Awards in 2021/22 Annex A: Methodology and Assumptions
Procurements Delivered Using Modern Used for 10 Year Projection of Investment
Methods of Construction
Investment in the Pipeline from 2021/22 28
to 2024/25 Annex B: Methodology Used for Regional
Planned Investment in the Pipeline Beyond Analysis of Investment to 2024/25
2024/25
Funding Mix of Planned Investment in the 30
Pipeline from 2021/22 to 2024/25 Annex C: Devolved Infrastructure
Projects, Programmes and Other Investment
Investments Delivered through Modern
Methods of Construction
Analysis of the National Infrastructure and Construction Pipeline 2021 1Ministerial
Foreword
Lord Agnew
Minister of State for the Cabinet
Office and Her Majesty’s Treasury
Rt Hon Jesse Norman MP
Financial Secretary to the Treasury
The 2021 National Infrastructure and Construction Pipeline sets out nearly
£650 billion of public and private investment that will transform people’s
lives for decades to come. Across the UK, world-class infrastructure will act
as the foundation on which to build back better, uniting and levelling up the
country as we recover from the pandemic.
With the publication of the National these publications effectively. By setting out
Infrastructure Strategy in November 2020, planned and projected spend over the next
the government set out its bold and ambitious 10 years, we aim to continue to build market
plans to meet the short and long-term confidence in the construction industry to
challenges facing the UK. In December invest in innovation and develop capability.
we published the Construction Playbook,
outlining our expectations of how contracting We have all seen the critical role construction
authorities and suppliers, including the supply workers have played in supporting people’s
chain, should mutually engage. These reforms everyday lives, particularly over the last year
will drive innovation and Modern Methods of of the pandemic. This ranges from building
Construction (MMC) to create a more hospitals to maintaining vital transport and
productive, sustainable and resilient industry utilities networks. The ability for firms to
with a well-trained workforce for the future. plan and resource for these projects is of
The Infrastructure and Projects Authority’s utmost importance. This year’s pipeline
(IPA) Transforming Infrastructure includes forecasted future workforce
Performance: Roadmap to 2030, published demand based on planned investment on
alongside this pipeline, sets out the projects and programmes.
transformation required to achieve these It will also be the first time that government
ambitions and details how we will work earmarks where investments and
together with industry to achieve this vision.
procurements will be substantially using MMC.
It will require data from all parts of the system
Encouraging and driving innovation in a
to inform decision making and measure
efficiency. In addition, the Government has sustainable manner that aligns with our
brought forward new initiatives such as Project path to Net Zero by 2050 is central to the
Speed, the Chancellor-led taskforce working at government’s infrastructure ambitions.
pace to deliver infrastructure projects better, The government is committed to working
faster and greener by removing layers of hand in hand with industry to improve
bureaucracy, accelerating decision making and productivity and drive innovation to recover
reforming the planning system. from the pandemic by building back better to
This pipeline is one of the critical steps level up the country and achieve net zero
needed to deliver the ambitions set out in emissions by 2050.
Analysis of the National Infrastructure and Construction Pipeline 2021 3Chief Executive
Foreword
Nick Smallwood
Chief Executive,
Infrastructure and Projects Authority
Delivering excellent infrastructure and the public services that we rely on
every day is critical to our national progress, prosperity and wellbeing.
Between £21 billion and £31 billion of contracts across economic and social
infrastructure will be brought to market over the next year, with a projected
£650 billion over the next 10 years.
Well planned and delivered projects have requirements needed to deliver them.
never been more important to the UK in Delivering the investments and procurement
driving our economy’s recovery from the within this pipeline means bringing more
unprecedented challenges of the pandemic. workers into the infrastructure market by
In setting out planned procurements, attracting new apprentices, technicians,
investments, and projections of the workforce graduates and skilled workers from other
required to deliver planned investment, this industries, in addition to necessary
pipeline will support industry in making productivity improvements required in the
strategic and informed decisions to their sector. This pipeline will support 425,000
long-term business and project planning. jobs annually on average over the period
2021/22 to 2024/25.
The IPA’s flagship change programme,
Transforming Infrastructure Performance: To drive us towards our commitment to net
Roadmap to 2030, was published today zero emissions by 2050, the government is
alongside the pipeline. It brings together our committed to using its position as the single
diverse infrastructure expertise to lead real largest construction client to support and
system change across government and encourage the adoption of more productive
industry, delivering on our mandate for the and sustainable practices within the UK
people of the UK. It sets out a bold vision construction sector. This pipeline outlines
for the future of our infrastructure by the extent to which new work will incorporate
recognising how significantly and rapidly the delivery through MMC. 170 of the contracts in
world is changing and uses our position at the procurements, totalling an estimated
centre of government to take a longer term capital value ranging between £15.4 billion
and portfolio view. Collectively, we are working and £22.4 billion, are planned to include
across government to create a step change in elements delivered by making best use
project delivery, setting high standards for of MMC.
success and supporting capability
We are committed to driving and supporting
development across the construction sector.
projects to achieve nothing less than
Quality investment to upskill and train our world‑class delivery across the construction
future workforce is vital to improve productivity sector. This pipeline and the package of
and efficiency across the sector. The IPA has publications working alongside it will allow
developed the facility to forecast future industry to plan and strategise for the
workforce demand on the basis of planned coming years, setting projects up for success
investment on projects and programmes. from the very beginning. Working together,
To promote recruitment into construction, we will build more sustainably, strengthen
we have converted planned investment on the Union and level up the country to improve
projects and programmes into the workforce lives across the UK.
4 Analysis of the National Infrastructure and Construction Pipeline 2021£650bn £400 bn
Around
Nearly
of planned investment in the pipeline, including
of projected public and private investment over £200 billion to be invested by 2024/25
over the next 10 years.
425,000
Supporting
jobs annually on average between 2021/22
and 2024/25
528
Across
£31 bn
Up to
projects , programmes
of planned procurement over the and other investments
next year
418
Across
public
sector
projects and programmes
Analysis of the National Infrastructure and Construction Pipeline 2021 5Summary
1.0 Infrastructure investment is playing a critical role in the recovery of the construction
sector and the economy as a whole from the impact of COVID-19, both by maintaining
jobs in the short term, and creating the conditions for long-term sustainable growth.
The government’s plan to ‘build, back, better’ will create jobs to support the recovery
from COVID-19, and level up the country ensuring key industrial areas are at the heart of the
transition to net zero.
1.1 Following the publication of the National Infrastructure Strategy in November 2020, this
National Infrastructure and Construction Pipeline is the most ambitious to date. It sets out
future planned procurements and levels of investment alongside the workforce requirement
to deliver these plans. This will support industry in making informed decisions linked to short
term business planning as well as strategic plans over a longer time horizon. Alongside
effective leadership from key infrastructure clients, this will also help to drive innovation and
MMC to create a more productive, sustainable and resilient industry with a well-trained
workforce for the future.
1.2 Increasing investment levels can lead to pinch points in capacity for key resources such as
labour, plant and materials. Latest figures published by ONS in June have demonstrated how
the significant increase in demand for materials relative to global manufacturing capacity has
resulted in significant inflationary cost pressure. As of June 2021 producer price output
inflation on the year rose by 4.3% while producer price input rose by 9.1%. This was largely
driven by metallic and non-metallic products.1
1.3 Delivering the investments and procurements within this pipeline means bringing more
workers into the construction industry infrastructure market, through new apprentices,
technicians and graduates and attracting skilled workers from other industries. It will mean
retraining and up-skilling the existing workforce which will support improved productivity and
performance. This pipeline includes for the first time the forecasted future workforce demand
based on planned investment on projects and programmes. IPA will continue to provide
updated skills forecasts with each iteration of the pipeline, in order to support industry to
develop recruitment, retention and upskilling strategies.
1.4 Data from all parts of the system is critical to inform decision making and measure
efficiency. The data included within this pipeline is sourced from a range of providers
including government departments, regulators and industry. IPA collates and publishes this
information on planned procurements in addition to planned and projected investment to
provide clarity to industry and support their short to long term business planning.
1.5 This analysis document published alongside the pipeline data provides insights across the
wide range of infrastructure the UK is planning to procure in the coming year, in addition to
the investments linked to the wide range of infrastructure the UK is committed to delivering
over the coming years.
1
https://www.ons.gov.uk/economy/inflationandpriceindices/bulletins/consumerpriceinflation/june2021
6 Analysis of the National Infrastructure and Construction Pipeline 2021Future Procurements
1.6 The procurements section of this pipeline is made up of work packages that are planned
to go out to market for procurement throughout the 2021/22 financial year. The procurement
element of the pipeline workbook contains details for more than 400 contract opportunities.
1.7 Projects where contracts have been awarded or where funding has already been
drawn down are not included within the procurements section of this pipeline. Projects in
early stages of development are also not included in the procurements for 2021/22.
The procurements included within this pipeline are those that represent market opportunities
commencing in 2021/22, some of which will be awarded within this financial year and others
to be awarded in future years.
1.8 Where ranges are used, this reflects the difference between the estimated minimum and
maximum contracts value. Where ranges are not used, this is due to the difference in
estimated contract value being negligible or a range has not been provided.
1.9 The procurements in this pipeline include (but are not limited to) a broad range of works
across infrastructure and construction such as:
■ construction work including building, design & build and civil engineering contracts;
■ repair and maintenance services;
■ architectural, construction, engineering and inspections services; and
■ consultancy services.
1.10 The level of detail included in the procurements section of the pipeline varies across
projects and programmes. Information has been provided for the individual work packages
that make up projects and programmes, where available. Some projects and programmes
will therefore have multiple procurements included in the pipeline section of the workbook.
Future Investments
1.11 This pipeline also includes details of planned investment on announced projects,
programmes and other spending commitments. The planned investment element of the
pipeline workbook contains details for 528 individual projects, programmes and other
investments. The investments section of this pipeline sets out around £400 billion of planned
investment, of which over £200 billion will occur by 2024/25.2
1.12 This gives the best available indication of planned investment, however the pipeline
alone does not provide a full picture over the long-term, including beyond 2024/25.
Future price control periods for many regulated utilities have not been set for the period
beyond 2022/23 and a number of multi-year capital budgets remain to be agreed through
a future Spending Review.3
1.13 To help indicate the longer-term investment, we also provide a 10 year projection of nearly
£650 billion of public and private investment, covering the period to 2030/31. The 10-year
projection was first included in the 2017 Pipeline and then updated for the 2018 publication.
It is produced to support industry with long term strategic planning.
2
All pipeline investment figures and analyses have been completed in 2019/20 prices.
3
A future Spending Review will set multi-year budgets for those projects and programmes that did not receive a multi-year
settlement through the 2020 Spending Review Process.
Analysis of the National Infrastructure and Construction Pipeline 2021 7Modern Methods of Construction (MMC)
1.14 The Government is committed to using its position as the single largest construction
client to support adoption of a more productive, efficient and sustainable business model
within the UK construction sector. This innovation is a key part in reaching the Government’s
goal of net zero emissions by 2050. In the 2017 Autumn Budget the Government announced its
commitment to MMC through the adoption of a presumption in favour of offsite construction
for relevant departments from 2019. This was followed in December 2017 by the publication of
Transforming Infrastructure Performance, setting out a long term programme to improve the
performance and delivery of infrastructure assets.4
1.15 The Government took this commitment a step further by setting out specific proposals
for how this approach could be developed over time and used to deliver its capital investment
programmes. This is called ‘A Platform Approach to Design for Manufacture and Assembly
(P-DFMA)’, which was described in a Call for Evidence in November 2018.5 In December 2020
the Government published its Summary of Responses to the Call for Evidence and noted the
importance of a strong, committed and visible pipeline of projects.6 The IPA’s TIP: Roadmap to
2030 published alongside this pipeline sets out the long term vision for a platform approach
to construction.
Future Workforce Requirement
1.16 Delivering the investments and procurement within this pipeline means bringing more
workers into the infrastructure market, through new apprentices, technicians and graduates
and attracting skilled workers from other industries. It will mean retraining and up-skilling
the existing workforce which will support improved productivity and performance.
1.17 To support industry’s investment in future skills, for the first time since 2013 this pipeline
sets out future workforce demand generated by the planned investment in the pipeline.
This demonstrates the need for, on average, 425,000 workers across infrastructure and
construction to deliver this planned investment up to 2024/25. As new projects and
programmes are approved this figure will rise further and could potentially lead to skills
shortages if not appropriately managed. To help industry manage these potential constraints
the IPA will continue to provide updates on future workforce requirements through each
future iteration of the pipeline.
4
https://www.gov.uk/government/publications/transforming-infrastructure-performance
5
https://www.gov.uk/government/consultations/proposal-for-a-new-approach-to-building-call-for-evidence
6
https://assets.publishing.service.gov.uk/government/uploads/system/uploads/attachment_data/file/941816/2020-12-8_
response_-_Proposal_for_a_New_Approach_to_Building.pdf
8 Analysis of the National Infrastructure and Construction Pipeline 2021Analysis of the
2021 Pipeline
2.0 The total value of procurements across economic and social infrastructure planned for
2021/22 ranges between £21 billion and £31 billion.7 The total value of planned public and
private investment in the pipeline up to 2024/25 is over £200 billion.
Procurements in 2021/22 by Sector
2.1 The procurement section of the pipeline brings together procurements for the 2021/22
financial year across social and economic infrastructure sectors including Transport, Energy
and Digital Infrastructure. Social Infrastructure incorporates nine sub-sectors including
Education and Health. The chart below shows the maximum estimated value of contracts,
split by economic and social infrastructure.
Chart 1: Estimated Maximum Contract Value of Procurements in the Pipeline by Sector (£’m)
Social Infrastructure
£5,527m
Economic Infrastructure
£25,267m
2.2 The chart above shows that economic infrastructure accounts for c.80% of the estimated
value of planned procurements ranging from a minimum of £16 billion to a maximum of
£25 billion. The remaining estimated value of planned procurement is split between social
infrastructure sub-sectors (£5.1bn – £5.5bn).8 Table 1 below provides a more detailed
breakdown of planned procurements by sector.
7
In this report economic infrastructure includes Transport, Energy, Digital Infrastructure, Science and Research, Waste and
Floods and Coastal Erosion. This is different to the definition of economic infrastructure in the National Infrastructure
Commission’s fiscal remit, which only includes public investment in Transport, Flood and Coastal Erosion, Digital
Communications and Waste. In this report social infrastructure includes Culture, Work and Pensions, Rural Affairs, Justice and
Security, Education, Healthcare and Housing and Regeneration.
8
Where ranges are used, this reflects the difference between the estimated minimum and maximum contract value.
Analysis of the National Infrastructure and Construction Pipeline 2021 9Table 1: Pipeline Procurements by Sector9
Sector No. of No. of Projects No. of Programmes Estimated Estimated
Procurements Minimum Contract Maximum Contract
Value (£’m) Value (£’m)
Housing and Regeneration 16 4 12 £ 177.7 £ 242.5
Education 165 165 0 £ 2,408.1 £ 2,504.1
Energy 22 13 9 £ 139.9 £ 298.7
Flood Defence 41 40 1 £ 953.1 £ 953.1
Home Office 2 0 2 £ 0.3 £ 5.3
Justice 23 10 13 £ 2,525.4 £ 2,775.4
Science and Research 8 8 0 £ 338.0 £ 338.0
Transport 132 19 113 £ 14,806.3 £ 23,665.4
Waste 9 0 9 £ 11.6 £ 11.6
Total 418 259 159 £ 21,360.4 £ 30,794.1
Procurements in 2021/22 by Work Type
2.3 Procurements within the pipeline extend beyond the construction of critical
infrastructure to renewals, maintenance and consultancy, architectural and engineering
services that will support the development of new schemes. Chart 2 below splits out the
procurement section of the pipeline by the type of work being procured.10
Chart 2: Estimated Maximum Contract Value of Procurements in the Pipeline by Work Type (£’m)
20,000
16,000
12,000
8,000
4,000
0
1 2 3 4 5 6 7 8 9 10 11 12 13 14 15 16
1) Architectural and related services 11) Research and development services on security
2) Building installation work and defence materials
3) Construction work 12) Site preparation work
4) Construction-related services 13) Supply and installation of assets related to depot
5) Design and execution of research and development upgrades as part of the Piccadilly Line Upgrade
6) Engineering Services Programme
7) Railway and tramway locomotives and rolling 14) Technical testing, analysis and consultancy
stock and associated parts services
8) Repair and maintenance services 15) Urban planning and landscape architectural
9) Repair and maintenance services of building services
installations 16) Works for complete or part construction and civil
10) Repair, maintenance and associated services engineering work
related to aircraft, railways, roads and marine
equipment
9
Information has been provided for the individual work packages that make up projects and programmes, where available.
Some projects and programmes will therefore have multiple procurements included in the procurement section of the workbook.
10
Types of work are based on Common Procurement Vocabulary.
10 Analysis of the National Infrastructure and Construction Pipeline 20212.4 Construction work including building, design & build and civil engineering makes up over
two thirds of the work opportunities available to the market in 2021/22. Of the remaining
estimated contract value, £0.8 billion to £1.1 billion is architectural, engineering and design
services, £2.9 billion to £5 billion is repair and maintenance services.
Contract Awards in 2021/22
2.5 Contracts with an estimated value of between £13.4 billion and £20.7 billion are planned
to both commence procurement and be awarded within the 2021/22 financial year as shown
in Table 2 (below). The full breakdown can be found in the procurement section of the pipeline
workbook.
Table 2: Contract Value of Pipeline Procurements Planned to Commence and be Awarded in
2021/22
Contract Award Date No. of Procurements Estimated Minimum Estimated Maximum
Contract Value (£'m) Contract Value (£'m)
Q1 2021/22 17 £ 335.0 £ 349.0
Q2 2021/22 92 £ 5,834.7 £ 8,577.8
Q3 2021/22 44 £ 2,386.6 £ 3,559.5
Q4 2021/22 67 £ 4,758.0 £ 8,187.2
Multiple award dates in 2021/22 12 £ 38.0 £ 63.4
Total 232 £ 13,352.3 £ 20,736.9
Procurements Delivered Using Modern Methods of Construction
2.6 In line with the response from industry, for the first time, the Government is setting out
the extent to which new work will include elements delivered through MMC.11 Of the contracts
included within the procurement section of the pipeline, over 170 with an estimated capital
value ranging between £15.4 billion and £22.4 are planned to be utilising some form of MMC.
Chart 3: Estimated Maximum Contract Value of Procurements in the Pipeline to Include Delivery
via MMC (£’m)
N/A
Yes
£6,953m £22,420m
No
£1,421m
11
In this report MMC includes all innovative approaches to the delivery of infrastructure and construction projects ranging from
digital design to offsite and volumetric construction. Schemes that have self reported that at least 50% or greater of the project
or programme will be delivered via MMC have been included within this group.
Analysis of the National Infrastructure and Construction Pipeline 2021 11Case Study:
Department for
Education - MMC
GenZero
The Department for Education teachers at school. The proposal builds on
some of the principles adopted by DfE in
(DfE) is promoting the
its MMC solutions; GEN5 (primary schools)
development of off-site market and GEN7 Special Educational Needs and
responses to the education sector Disabilities schools, and takes a radical
through a unique MMC framework. approach to developing standardised,
repeatable, large‑scale building component
This framework drives innovation
platform design solutions that can be
and performance through mass‑manufactured, and that can be rapidly
compliance with a detailed and assembled on-site to create new school
challenging performance buildings that will be low carbon in
construction and use.
specification. This is part of DfE’s
journey towards a construction The Research and Development programme
will conclude with a Royal Institute of
platform that can deliver the
British Architects Stage 4 Technical Design
widest range of buildings at the from which the platform principles and
most economic cost and at revised specification and Net Zero Carbon
optimum performance. data can be extracted. The new platform
system for low carbon schools is based on
To kick start the platform approach a new manufactured timber system.
Innovate UK/Construction Innovation Hub The research project has provided a robust
have partnered on a DfE-led Research and open-source digital model of two schemes
Development programme to develop the - a city centre proposal and suburban
designs for zero-carbon secondary schools expansive site solution. This provides a
utilising Design for Manufacture and reference tool from which capital and
Assembly (DfMA) principles and which whole life costs are being constructed,
will allow easy adaptation for and carbon data generated.
cross‑government use.
A full size prototype section of the timber
This research has taken a whole-site construction is currently being
approach using innovative measures to manufactured by the Manufacturing
mitigate against climate change for over Technology Centre in Scotland utilising UK
60 years and provide sustainable long-term timber and manufacturing processes.
welfare benefits for both pupils and
12 Analysis of the National Infrastructure and Construction Pipeline 2021Example procurements included in the pipeline
North
• A5036 Princess Way
• Preston & South Ribble Flood
Risk Management Projects
• John Fisher RC School
Midlands and East of England
• Hartshill School
• Mine Water Treatment Scheme
• River Roding Project
London
• River Thames Scheme
• M25 RTMC Replacement
South and West
• A303
• King Edmund School
• Par Highway Dam
Analysis of the National Infrastructure and Construction Pipeline 2021 13Investment in the Pipeline from 2021/22 to 2024/25
2.7 Over £200 billion of planned investment in the pipeline will be delivered by 2024/25.
We provide specific investment figures to this date to reflect likely cycles in infrastructure
investment, as 2025 marks the end of the current 2020 Spending Review period. A future
Spending Review, will set out future capital budgets for portfolios that did not receive
multi‑year settlements as part of the 2020 Spending Review.
2.8 Due to the fact that not all projects and programmes received multi-year settlements up
to 2024/25 the planned investment in the pipeline will underestimate actual investment over
the coming years in some sectors.
2.9 For this reason, for the first time the IPA has applied its projection estimates to the
current Spending Review period in order to provide a comprehensive view of estimated future
planned and projected investment. The profile of planned investment in all sectors, up to
2024/25 is set out in Chart 4 and reflects the likely underestimate from 2023/24 to 2024/25.
Chart 4: Annual Profile of Planned Pipeline Investment by Sector (£’m)
70,000
60,000
50,000
40,000
30,000
20,000
10,000
0
2021/22 2022/23 2023/24 2024/25
Transport Energy Utilities Social Infrastructure
Digital Infrastructure Flood and Coastal Erosion Science and Research
2.10 Table 3 below shows the value of planned investment in each sector in the investment
section of the pipeline between 2021/22 and 2024/25. The full breakdown can be found in the
investment section of the pipeline workbook. This does not include projected investment
across regulated utilities, social infrastructure, economic infrastructure and other
investments, which can be found in Chart 9.
14 Analysis of the National Infrastructure and Construction Pipeline 2021Table 3: Planned Investment in the Pipeline 2021/22 to 2024/25 by Sector (£’m)
Sector 2021/22 2022/23 2023/24 2024/25 Total 2021/22
to 2024/25
(£’m) (£’m) (£’m) (£’m) (£’m)
Transport 17,403 18,274 17,046 17,229 69,952
Energy 13,696 14,777 12,384 10,438 51,295
Utilities 13,186 13,382 8,084 7,165 41,817
Social Infrastructure 14,188 5,532 3,570 2,587 25,876
Digital Infrastructure 2,177 2,425 2,387 2,376 9,365
Flood and Coastal Erosion 234 268 266 215 984
Science and Research 364 229 178 130 901
Total 61,247 54,887 43,915 40,140 200,190
Planned Investment in the Pipeline Beyond 2024/25
2.11 Around £200 billion of currently planned investment in the pipeline will be delivered after
2024/25. This includes major projects and ongoing investments that will be delivered over a
number of years, such as HS2, and Lower Thames Crossing in addition to investment
programmes such as the Affordable Homes Programme. This does not include projected
investment across regulated utilities, social infrastructure and economic infrastructure and
other private investment which can be found in Chart 9.
Chart 5: Planned Investment in the Pipeline Beyond 2024/25 by Sector (£’m)
Science and Research
Flood and Coastal Erosion
£ 838.3m £261.9m
Transport
Energy
£32,187m
Utilities
£151,005m £979.5m
Digital Infrastructure
£6,796.2m
Social Infrastructure
£6,772.1m
Analysis of the National Infrastructure and Construction Pipeline 2021 15Funding Mix of Planned Investment in the Pipeline from 2021/22 to 2024/25
2.12 The UK uses a mixed model to fund and finance its infrastructure, using both public and
private investment. This includes public investment covering economic infrastructure such as
roads and telecommunications, in addition to social infrastructure such as schools and
hospitals. The Government also supports private investment through established tools such
as the UK Guarantees Scheme, Contract for Difference and the Regulated Asset Base model.
At Budget 2018 the Government announced that it will no longer use Private Finance 2 (PF2),
the current model of Private Finance Initiative (PFI), however the Government will continue to
support private investment through other means including the UK Infrastructure Bank.
Chart 6: Funding Mix of Planned Investment in the Pipeline from 2021/22 to 2024/25 by
Sector (£’m)
Science and
Research
Flood and
Coastal Erosion
Digital
Infrastructure
Social
Infrastructure
Utilities
Energy
Transport
0 10,000 20,000 30,000 40,000 50,000 60,000 70,000 80,000
Public Private Mixed
2.13 Chart 6 above sets out the funding split of each sector of the pipeline to 2024/25. Chart 7
below shows the funding split by year. Around 50% of the pipeline to 2024/25 is funded and
delivered by the private sector, whilst the other 50% of the pipeline to 2024/25 is made up of
public funding.12
12
Public funding includes an element of mixed funding. Mixed funding is classified as any combination of funding sources. Of the
total planned investment within the Pipeline 49.3% of funding (£98.7bn) is private whereas 50.7% (£101.5bn) is funded by the
public sector.
16 Analysis of the National Infrastructure and Construction Pipeline 2021Chart 7: Funding Mix of the Planned Investment in the Pipeline from 2021/22 to 2024/25 by Year
(£’m)
70,000
60,000
50,000
40,000
30,000
20,000
10,000
0
2021/22 2022/23 2023/24 2024/25
Public Private Mixed Funding
2.14 Over 115 schemes included within the pipeline, representing nearly 50% of total planned
investment between 2021/22 and 2024/25 represent private corporate or project finance
opportunities for institutional investors.13
Chart 8: Opportunities for Private Corporate or Project Finance Linked to Planned Investment
in the Pipeline from 2021/22 to 2024/25 (£’m)
N/A
£78,334m Yes
£98,563m
No
£23,298m
13
As part of the Pipeline commission the IPA requested that contracting authorities confirm whether there is an opportunity
for institutional investors to provide private corporate or project finance in relation to their scheme(s). Of the 528 projects,
programmes and other investments included within the Pipeline 116 schemes (representing 49.2% of total planned investment
up to 2024/25) confirmed that there is an opportunity for private corporate or project finance.
Analysis of the National Infrastructure and Construction Pipeline 2021 17Projects, Programmes and Other Investments Delivered through Modern Methods
of Construction
2.15 Of the 528 projects, programmes and other investments included within the investment
section of the pipeline, 143 will include delivery through MMC. This ranges from digital design
to offsite and volumetric construction and represents £79 billion of investment out of the total
£200 billion planned to 2024/25.14 Table 4 below sets out the level of investment including
elements delivered through MMC by sector.
Table 4: Planned Investment in the Pipeline from 2021/22 to 2024/25 to Include Delivery via
MMC (£’m)
Sector 2021/22 2022/23 2023/24 2024/25 Total 2021/22
to 2024/25
(£’m) (£’m) (£’m) (£’m) (£’m)
Transport 12,037.3 11,722.8 11,663.2 12,261.7 47,685.0
Utilities 5,499.9 5,526.0 5,298.6 4,433.0 20,757.5
Social Infrastructure 3,123.8 1,809.2 1,753.7 1,747.1 8,433.7
Digital Infrastructure 239.3 399.6 374.9 463.9 1,477.8
Flood and Coastal Erosion 1.2 1.2 1.1 1.0 4.6
Science and Research 86.0 122.8 94.6 89.4 392.8
Total 20,987.5 19,581.6 19,186.1 18,996.2 78,751.4
14
This figure includes schemes that are in early stages of delivery such as scoping, development design as well as planning
and consents. Where these schemes are marked as utilising MMC this denotes the fact that they are currently utilising digital
design techniques. This does not, in all instances, guarantee that the scheme will be delivered via offsite and/or volumetric
construction techniques.
18 Analysis of the National Infrastructure and Construction Pipeline 2021Example planned investments and programmes included in the pipeline
North
• Transpennine Route Upgrade
• Square Kilometre Array
• Kendal Flood Risk
Management Project
Midlands and East of England
• Wellingborough Prison
• Midlands Mainline Programme
• Lowestoft Flood Risk
Management Project
London
• Crossrail
South and West • Thames Tideway Tunnel
• East West Rail • UK Holocaust Memorial
• Hinkley Point C
• NeuConnect
Analysis of the National Infrastructure and Construction Pipeline 2021 19Projected Investment
Over the Next 10 Years
3.0 The National Infrastructure and Construction Pipeline published in December in 2017 set
out for the first time, a projection of public and private infrastructure investment levels over
a 10 year period. This was later refreshed in the 2018 Pipeline. This report provides a further
update to the projection to the year 2030/31. The IPA estimates that total infrastructure
investment over the next 10 years will be nearly £650 billion.15
3.1 This projected element of the pipeline supplements the current planned investment within
the investment section of the pipeline workbook in order to set out estimated future planned
and projected investment for the next decade. This is designed to provide a more
comprehensive view of the medium to long term trajectory of infrastructure investment.
The IPA is unable to provide an exact profile of future investment as this will become known
once new public sector schemes are approved through a future spending review and private
sector investment is brought to market. The IPA would anticipate that future approved
investment will bring annual average investment over the period 2021/22 to 2024/25 up to
c£60bn, in line with forecasts from previous iterations of the pipeline. This would form a part
of wider public sector gross investment of £100 billion a year as set out in the National
Infrastructure Strategy.16
3.2 Chart 9 provides a breakdown of investment in line with the methodology for calculation,
the projection set out in Annex A.
Chart 9: Estimated Public and Private Investment from 2021/22 to 2030/31 by Sector (£’m)
Regulated Utilities
Economic Infrastructure (Public)
£96,945m £253,987m
Social Infrastructure (Public)
£89,241m
Private Investment
Across all Sectors
£208,360m
15
This figure represents future capital investment on projects and programmes and so is different from the £600 billion
investment referenced in the National Infrastructure Strategy which represents total public sector gross investment,
an element of which is capital.
16
https://www.gov.uk/government/publications/national-infrastructure-strategy
20 Analysis of the National Infrastructure and Construction Pipeline 2021Regional Analysis of the Investment
in the Pipeline from 2021/22 to 2024/25
4.0 This chapter provides an overview of the analysis of the distribution of the planned
infrastructure investment in the pipeline from 2021/22 to 2024/25 in each region of England.17
This builds on the regional analysis first provided in the National Infrastructure and
Construction Pipeline 2017, updated in 2018. The analysis is as complete as possible based on
the information available, but it is not exhaustive and so should be taken as an indication of
investment in each region only. A more detailed explanation of the methodology is in Annex B
and an explanation of developed responsibilities for infrastructure in Scotland, Wales and
Northern Ireland is in Annex C.
4.1 The analysis of planned investment by region provides an indication of where construction
activity will be taking place, rather than where improvements to infrastructure and public
services will be felt. Due to the nature of many energy and transport infrastructure projects,
investments made in one region will deliver benefits to citizens in multiple other regions, and
often across the whole of the UK. Job creation and contract opportunities for the supply chain
are also spread more widely across regions as illustrated in the case studies below.
4.2 The IPA’s analysis of regional investment in the Pipeline indicates average annual per
capita investment of £689 across England over the period 2021/22 to 2024/25. Of this private
sector investment makes up £356 of average annual per capita investment and central
government investment equates to £333 average annual per capita investment.
4.3 The regional investment within the pipeline is provided as an annual average in order to
ensure easier comparisons to future editions of the pipeline which will include planned
investment for the remaining years of the Spending Review period through each iteration.
17
The regional analysis of the investment in the Pipeline is carried out on the planned investment in the Pipeline only and so
excludes projected investment in the Pipeline.
Analysis of the National Infrastructure and Construction Pipeline 2021 21Case Study:
HS2 Regional Supply
Chain Benefits
HS2 and its supply chain are section of the HS2 route. The EKFB Joint
Venture (Eiffage, Kier, BAM Nuttall,
supporting more than 16,000 jobs
Ferrovial) – building the section from the
and creating over Long Itchington Wood site in Warwickshire
500 apprenticeships. south to the Chiltern tunnel portals, has said
it will recruit over 4,000 roles in the next two
HS2 Phase One is predicted to create years, many based in Milton Keynes, as work
400,000 supply chain contract opportunities, ramps up in the area.
with an estimated 95% expected to be won
by UK-based businesses, and 60% by small to Elsewhere, Explore Manufacturing in
medium-sized enterprises. Companies Worksop, Nottinghamshire, won a contract
spanning from Wales to West Bromwich and to supply major bridges to the project; as a
Carlisle to Cambridgeshire have been result the company recruits a minimum of 4
awarded these contracts, supporting jobs far apprentices each year and it will create 35
and wide across the UK. new jobs. Thomson Habitats, based in
Cardiff, has employed new staff to deliver
For example, HS2’s main works contractor newly awarded HS2 contracts, with 35 people
for the West Midlands, the Balfour Beatty working on the HS2 project and the potential
VINCI Joint Venture (BBV JV), along with its for more job opportunities next year.
supply chain partners, has said it expects to
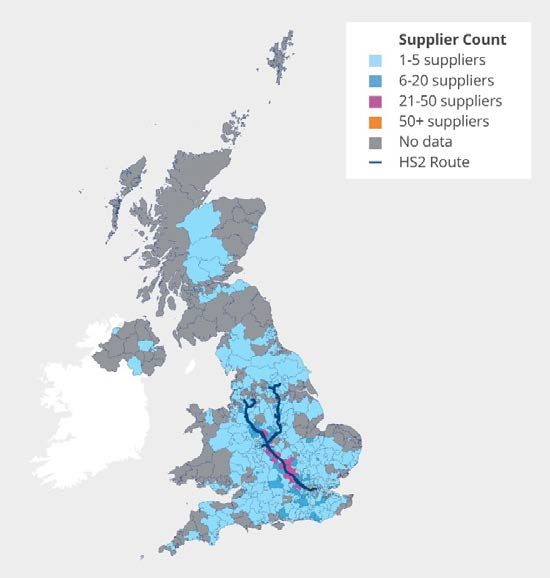
be one of the biggest recruiters in the West The map on the following page shows the
Midlands over the next two years, with up to location of firms contracted to supply HS2
7,000 skilled jobs required to complete its around the UK.
22 Analysis of the National Infrastructure and Construction Pipeline 2021Analysis of the National Infrastructure and Construction Pipeline 2021 23
Case Study:
     Hinkley Point C18

     The power station’s reliable,                                            The project is addressing specific skills
                                                                              shortages through new Centres of
     low-carbon electricity will play a
                                                                              Excellence training. Over 750 apprentices
     vital role for the environment, the                                      have now been trained, providing ongoing
     economy and citizens through                                             workforce development and opportunities
     creating jobs and skills across                                          for local people to retrain and upskill.
     the whole of the UK.                                                     The project also provides benefits including
                                                                              reducing emissions, reducing the volumes
     Thus far 11,769 jobs have been created or                                of materials used, managing water
     safeguarded on-site with a target of 25,000                              resources effectively, reducing and reusing
     during the build and 71,000 in total. To date,                           waste, and protecting and increasing
     64% of contracts have been awarded to UK                                 biodiversity.
     based companies (3,600 businesses). Of
     these 14% are based in the North of
     England. The latest projections show
     approximately £2bn will be invested
     across the North alone, supporting almost
     8,000 jobs.

     Limitations of the Methodology18
     4.4 This analysis does not provide an exhaustive view. It only includes investment that is
     currently captured in the pipeline; for example, the pipeline does not currently include all local
     authority infrastructure investment or investment in rolling stock by train operating
     companies. For roughly 20% of the pipeline we have either not developed a regional allocation
     methodology yet, or the investment is in the devolved administrations or overseas, hence this
     investment has not been included in the regional analysis.

     4.5 Our methodology presents investment in each region based on the location of the asset.
     This does not always show where the benefits of infrastructure are felt across the whole
     country, for example investment in electricity generation that will benefit all regions.
     This regional analysis also does not show where the wider socio-economic benefits of
     investment are felt across the country.

     18
          Hinkley Point C, Socio-Economic Impacts Report, 2021.

24   Analysis of the National Infrastructure and Construction Pipeline 2021
Workforce Demand Analysis
from 2021/22 to 2024/25
5.0 This chapter provides an estimate of future workforce demand to deliver the planned
investment within the pipeline. This analysis is derived by taking on-site labour data from
samples of historic projects and programmes delivered across different sectors and schemes
of varying capital intensity and applying them to the planned investment within the pipeline.
Workforce Requirement to Deliver Planned Investment in the Pipeline from 2021/22 to
2024/25
5.1 IPA estimates developed through analysis and modelling suggest that over 425,000
individuals will be required, annually on average, over the period 2021/22 to 2024/25 to deliver
the £200 billion of planned investment within the pipeline.19 Chart 10 below provides the
annual profile of the workforce to deliver this planned investment.
Chart 10: Estimated Annual Workforce Requirement to Deliver Planned Investment in the
Pipeline from 2021/22 to 2024/25
700,000
600,000
500,000
400,000
300,000
200,000
100,000
0
2021/22 2022/23 2023/24 2024/25
Economic Infrastructure Social Infrastructure Energy Utilities
19
A granular profile of workforce requirements over the period 2021/22 to 2024/25 and broken down to 100 individual trade skills is
provided within the Pipeline workbook.
Analysis of the National Infrastructure and Construction Pipeline 2021 255.2 The IPA’s estimates of future workforce requirements are based solely on the planned
investment within the pipeline. We are unable to estimate the workforce requirements
for projected investment over the next 10 years until there is greater certainty of the precise
schemes that will utilise it.
5.3 The IPA anticipates that future workforce requirements will increase as new public sector
schemes are approved via a future Spending Review and new private sector projects are
brought to market. For this reason the IPA will continue to provide an update of future
workforce requirements to deliver the pipeline as part of future publications.
Limitations of the Analysis
5.4 This analysis does not provide an exhaustive view of future workforce demand and should
be treated as an indication of potential workforce demand. The analysis does not account for
variations in the complexity of projects, for example where significant tunnelling and boring
works are required in relation to a road or rail scheme. In addition, this analysis is limited in the
extent to which it considers the adoption of new technologies that may reduce or influence
the makeup of the types of skills to deliver projects and programmes in the future.
26 Analysis of the National Infrastructure and Construction Pipeline 2021Annex A: Methodology and Assumptions Used for
10 Year Projection of Investment
6.0 The year projection is based on two approaches.
6.1 Firstly, it projects public investment in economic infrastructure and social infrastructure,
assuming investment growth will continue along the pipeline growth rate trend from 2016/17
to 2022/23.
6.2 Secondly, the calculation projects private investment in regulated utilities and other
sectors (digital communications, transport, water and waste). This projection is based on the
following methodologies:
■ Projected investment in regulated utilities is modelled on the average level of annual
investment based on previous control period, assuming Government annual efficiency
targets of 1.15%. This projection does not represent the level of future price control
periods, which are not yet determined. Planned investment in the non-regulated utilities
identified in the pipeline post 2024/25, such as Thames Tideway Tunnel, have been
included in the ten year projection, but no further future forecast has been made.
■ Investment in electricity generation is based on projected energy demand scenarios and
IPA modelling.
■ Project investment in the oil and gas sector has been forecast to 2030/31 by the industry
regulator, the Oil & Gas Authority (OGA). The OGA projection extends the forecasted
investment in 2025/26 to 2030/31 in real terms.
■ Projected investment in all other sectors is based on the average level of investment in the
pipeline between 2016/17 and 2022/23, which has been projected to 2030/31 in real terms.
Analysis of the National Infrastructure and Construction Pipeline 2021 27Annex B: Methodology Used for
Regional Analysis of Investment to 2024/25
Regional Allocation where the Asset Location is Known
7.0 Projects in the National Infrastructure and Construction Pipeline are allocated to
individual regions (as defined by the ONS), based on the location of the built asset, when the
asset is located within one region.
7.1 The allocation of assets to a region, where possible, helps users to filter the data by region
to find specific local schemes, or to search for national programmes. It also helps inform maps
such as the one included in this document.
7.2 Using this basic methodology, around 40% of the pipeline is allocated to a specific region.
Many projects cannot be allocated in this way, because they are national, cross region or are
broader investment programmes.
7.3 This basic allocation of projects and programmes to specific regions is not based on the
analysis of the benefits that assets will deliver. For example, the pipeline does not currently
reflect benefits to the supply chain of the construction and maintenance of an asset.
7.4 This allocation also does not address benefits to users of infrastructure assets once in
use. In some, but not all cases, the location of the asset will be the same as where benefits are
felt. For example, investment in public services infrastructure, such as schools and hospitals,
largely benefit the communities in which the constructed asset is based.
Additional Regional Allocation
7.5 The IPA has worked with other Government departments and regulators to allocate a
greater proportion of the pipeline to individual regions, where this cannot be done based
simply on the location of an asset. The IPA has applied a methodology that allows investment
in national and multi-regional programmes to be allocated appropriately between regions.
Using this approach, this report provides analysis that altogether allocates over 80% of the
value of the pipeline between 2021/22 and 2024/25 to specific regions. A detailed explanation
of how this is done is provided below.
Methodology applied for the IPA’s Regional Analysis for Sectors Other than Transport
7.6 Where possible, the total investment for the asset continues to be allocated to the region
in which an asset is located. For example, investment in the Geological Waste Disposal
Facility is allocated to the North West and Hinkley Point C is allocated to the South West.
Apart from transport, nationwide investment in multi-regional programmes (e.g. full fibre roll
out) is shared out according to the population or number of households in each region.
The methodology is broken down by sector in the table below.
28 Analysis of the National Infrastructure and Construction Pipeline 20217.7 In addition, for specific utilities sub-sectors, investment has been regionally allocated
based on household consumption. The methodology is broken down by sector as seen below:
• Communications (Broadband)
Allocated per household • Energy (Electricity generation, oil and gas)
• Utilities (Electricity transmission, Gas distribution, smart metres)
• Communications (Digital economy, mobile connectivity)
• Education (Balance of spend identified in investing in Brtain’s Future, Grammar Schools expansion,
Multi-academy Trust (MAT) allocations, College Capital Investment Fund (CCIF), National Colleges
Allocated per person
Capital Investment Fund and further education.
• Energy (Nuclear Decommissioning Authority)
• Science and Research
Methodology Applied to the Transport Sector
7.8 Transport investment supports the movement of people and goods, with journeys
routinely crossing regional (and national) boundaries. Many of our biggest transport projects
cross regional boundaries, particularly on the strategic rail and road networks. The regional
allocation of spending and the task of apportioning benefits of projects is therefore not
straightforward. Issues include:
■ Investments physically located in one geographic region often benefit those who live in
other regions. For example, investments in London’s transport network will benefit not only
London residents but also the almost 1 million people who work in London but live
elsewhere, in addition to business and leisure visitors to the city.
■ Key parts of our transport network serve as international travel ‘hubs’ for the whole of the
country. For various geographic reasons, many of these are concentrated in London, the
South East and the East of England. Transport spending that supports travel to and from
these ‘hubs’ benefits the whole country through the international travel and trade that it
helps facilitate.
■ As large transport investments often involve substantial spending over a long construction
period and long-term impacts, the regional distribution of spending at a particular point in
time will not necessarily match the regional distribution of benefits in that period or the
benefits over the lifetime of the investment.
Where possible, transport investment has been allocated to the region where the asset is
located. For cross-regional and unallocated investment, it has been allocated using the
methods set out in the table below.
The analysis uses Network Rail capital investment in renewals and enhancements as proportions.
Rail Investment is allocated to the region in which an asset is located. For projects that are cross-regional,
investment is apportioned according to track length (kilometres) within the appropriate regions.
The analysis includes capital investment in the Roads Investment Strategy. Where possible, investment is
allocated to the region in which an asset is located. For investment in maintenance and other unallocated
Strategi Roads
spend, investment is apportioned according to the distribution of road traffic journeys across regions on
the Strategic Road Network.
For the integrated transport block, local authority major, local spend on buses, and walking and cycling,
where funding has been allocated to a region, the analysis assumes the benefits of spend are where t the
Local Transport local authority or local economic partnerships are based.
Where later years are allocated spending across regions on a per capital basis. This does not necessarily
reflect future regional investment allocations.
7.9 Based on this methodology, IPA’s analysis of regional transport investment suggests
average annual per capita investment of £295 across all English regions over the period
2021/22 to 2024/25.20
A full breakdown of average annual per capita transport investment across statistical regions for the period 2021/22 to 2024/25
20
can be found in the pipeline workbook.
Analysis of the National Infrastructure and Construction Pipeline 2021 29Annex C:
Devolved Infrastructure Investment
8.0 The National Infrastructure and Construction Pipeline contains projects and programmes
distributed across the UK, but the majority of the value of the pipeline relates to activity in
England. This is because most infrastructure spending in Scotland, Wales and Northern
Ireland is the responsibility of each devolved administration, and therefore is not included
within the pipeline.
8.1 The split between the responsibility of the UK government and each of the devolved
administrations for infrastructure policy and funding varies according to the distinct
devolution settlement in place, set out below. Each devolved administration produces its
own infrastructure planning setting out spending in economic infrastructure:
■ The Northern Ireland Executive’s Investment Strategy for Northern Ireland 2011-2021 sets
out the forward programme for investment in public infrastructure. Details of Government
funded infrastructure contracts that have not yet entered procurement are also updated
quarterly in the Infrastructure Investment Pipeline.21
■ The Scottish Government published an Infrastructure Investment Plan with a Project
Pipeline in 2015 with an updated Project Pipeline in December 2020.22
■ The Welsh Government published an Infrastructure Investment Plan in 2012 with an
updated Project Pipeline published in November 2019.23
Sector Devlolved administration
Scotland Northern Ireladn Wales
Road Devolved responsibility Devolved responsibility Devolved responsibility
Rail The Scottish government is Devolved responsibility Not devolved
responsible for internal services.
The UK government is responsible
for cross-border daytime services.
Airports Devolved responsibility. Devolved responsibility Devolved responsibility
The regulation of air services is a
reserved matter.
Ports Devolved responsibility, with some Devolved responsibility Devolved responsibility,
minor exceptions with some minor exceptions
Energy Not devolved Not devolved Not devolved
Communications Not devolved Not devolved Not devolved
Water Devolved responsibility Devolved responsibility Devolved responsibility
Flood Defence Devolved responsibility Devolved responsibility Devolved responsibility
Waste Devolved responsibility Devolved responsibility Devolved responsibility
Housing Devolved responsibility Devolved responsibility Devolved responsibility
21
https://www.infrastructure-ni.gov.uk/publications/investment-strategy-northern-ireland-2011-2021 [
22
https://www.gov.scot/publications/infrastructure-investment-plan-2015-project-pipeline-update-march-2020/#history
23
https://gov.wales/wales-infrastructure-investment-plan-project-pipeline-2019
30 Analysis of the National Infrastructure and Construction Pipeline 2021You can also read