Anthropogenic Climate Change and the Record-High Temperature of May 2020 in Western Europe
←
→
Page content transcription
If your browser does not render page correctly, please read the page content below
Anthropogenic Climate Change
and the Record-High Temperature
of May 2020 in Western Europe
Nikolaos Christidis and Peter A. Stott

                                                  The extremely warm May of 2020 in western
                                                  Europe was favored by persistent high pressure,
                                                  but human influence is also estimated to have
                                                  made such events 40 times more likely.

                                                  E
                                                        xtremely warm temperature anomalies over west-
                                                        ern Europe in May 2020 (Fig. 1a) were character-
                                                        ized by summer-like extremes, with several French
                                                  cities recording temperatures above 30°C for the first
                                                  time in May, while in Spain temperatures locally ex-
                                                  ceeded 35°C. The event was linked to an omega block-
                                                  ing ridge pattern associated with significant warm
                                                  advection over the region. Anomalies of the 500-hPa
                                                  geopotential height (Z500) from the NCEP–NCAR re-
                                                  analysis (Kalnay et al. 1996) illustrate the prevalent an-
                                                  ticyclonic conditions over western Europe in May 2020
                                                  (Fig. 1b). The anticyclonic pattern was embedded in a
AFFILIATIONS: Christidis and Stott—Met            Rossby wave train extending over the whole Northern
Office Hadley Centre, Exeter, United Kingdom      Hemisphere (see the online supplemental material),
                                                  which was also linked to the severe heatwave in Siberia
CORRESPONDING AUTHOR: nikos.christidis@           (Ciavarella et al. 2021). Interestingly, the month of May
metoffice.gov.uk
                                                  also had record warmth on a global scale (Di Liberto
DOI: 10.1175/BAMS-D-21-0128.1
                                                  2020). Here we present an attribution study that as-
                                                  sesses how anthropogenic forcings may have changed
A supplement to this article is available         the likelihood of extreme May temperatures in western
online (10.1175/BAMS-D-21-0128.2)                 Europe (10°E–5°W, 35°–55°N), both in the general case
©2021 American Meteorological Society             (i.e., under any possible synoptic conditions; uncondi-
For information regarding reuse of this content
                                                  tional analysis) and under the influence of a persistent
and general copyright information, consult the
AMS Copyright Policy.                             anticyclonic circulation pattern (conditional analysis).

         AMERICAN METEOROLOGICAL SOCIETY                                     J A N UA RY 2 0 2 2   S1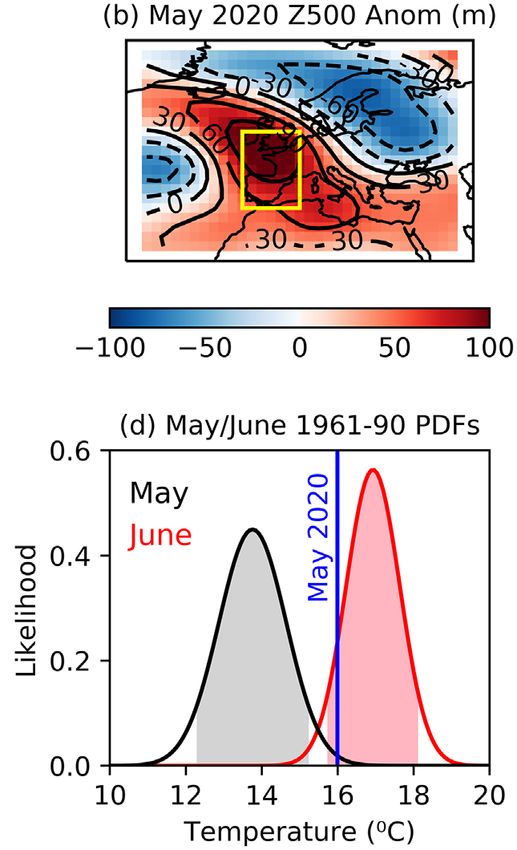
Observed analysis
                                                                          and CMIP6 data.
                                                                          We use the HadCRUT4 obser-
                                                                          vational surface temperature
                                                                          dataset (Morice et al. 2012) to
                                                                          compute regional mean May
                                                                          temperature anomalies. As
                                                                          in other attribution studies
                                                                          (Bindoff et al. 2013), we define
                                                                          anomalies relative to a period
                                                                          earlier than the common 1961–
                                                                          90 (here we use years 1901–30
                                                                          as a baseline), since the earlier
                                                                          baseline is closer to the pre-in-
                                                                          dustrial climate and thus al-
                                                                          lows us to capture most of the
                                                                          anthropogenic effect. Had-
                                                                          CRUT4 time series since 1900
Fig. 1. Spatial patterns of the (a) temperature anomalies and (b) Z500 are illustrated in Fig. 1c and
anomalies relative to 1961–90 for the month of May 2020 constructed demonstrate that May 2020 is
with HadCRUT4 and NCEP–NCAR reanalysis data respectively. The yel- the warmest May in the record.
low box marks the western European region considered in this study,
                                                                          We also construct distribu-
selected as a European area that includes the warmest observed anom-
                                                                          tions of monthly actual tem-
alies. (c) Time series of the May mean anomalies relative to 1901–30 av-
eraged over the western European region. Time series were produced peratures over a recent period
with HadCRUT4 data (black) and CMIP6 simulations with (red) and with- with NCEP–NCAR reanalysis
out (blue) human influence. The smoothed mean of the ALL simulations data for May and June (Fig. 1d).
is marked by the thick white line. (d) Normal distributions of the 1961– The distributions reveal that
90 actual mean temperature in western Europe for the months of May the May 2020 temperature is
(black) and June (red) constructed with NCEP–NCAR reanalysis data. The
                                                                          extreme for the month of May,
colored areas lie between the 5th and 9th percentiles. The vertical blue
line marks the May 2020 temperature.                                      but typical for June, which
                                                                          could manifest a change in
          seasonality in a warming climate (Christidis et al. 2007; Ruosteenoja et al. 2015).
             We next compute temperature anomalies with data from 11 models (see the supplemen-
          tal material) that contributed to the phase 6 of the Coupled Model Intercomparison Project
          (CMIP6; Eyring et al. 2016). We select models that provide ensembles of simulations with
          all historical forcings (ALL) and natural forcings only (NAT) that enable us to compare the
          likelihood of extremes in the real world and in a hypothetical natural world without the ef-
          fect of human activity, following the popular risk-based attribution framework (Stott et al.
          2016). The ALL simulations were extended to 2100 with the “middle-of-the-road” emissions
          scenario SSP2–4.5 (Riahi et al. 2017). We use in total 56 ALL and 62 NAT simulations. We
          apply standard evaluation tests for multimodel ensembles (Christidis et al. 2021; also see the
          supplemental material), which show that the modeled historical trends of the regional May
          mean temperature are consistent with HadCRUT4, but the modeled variability is somewhat
          larger. We therefore bias-correct the modeled data following the approach of Christidis and
          Stott (2021), whereby we remove the smoothed ensemble mean from the individual ALL time
          series, adjust their variability, and reintroduce the ensemble mean. After bias correction the
          modeled variability and temperature distribution agree well with HadCRUT4 (supplemental
          material). We highlight the bias correction as a caveat in our analysis, which may adversely
          affect future likelihood estimates, if future changes in variability are incorrectly represented
          by the models. Nevertheless, neither the observations nor the models suggest major changes
        AMERICAN METEOROLOGICAL SOCIETY                                               J A N UA RY 2 0 2 2   S2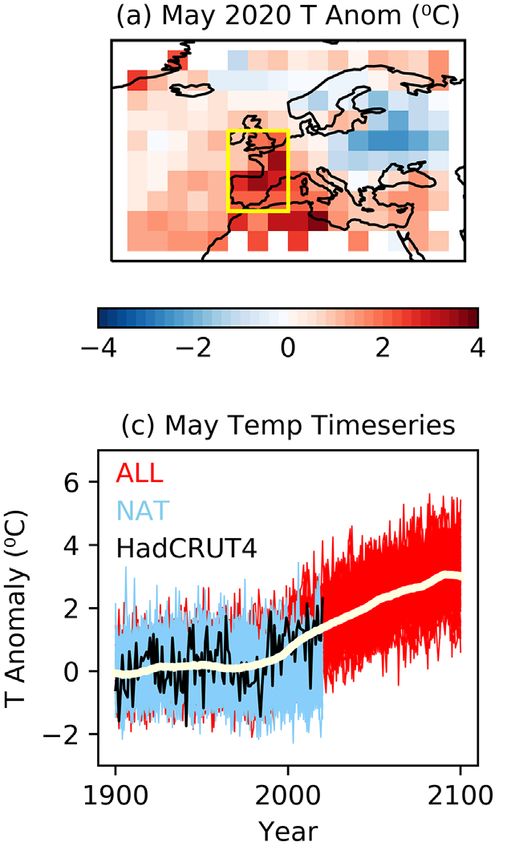
in variability with time. Time series of the model simulations are depicted in Fig. 1c. Unlike
the largely stationary NAT climate, the ALL experiment shows a steady temperature increase
since the late twentieth century, leading to a warming of over 2°C by 2100 under SSP2–4.5.
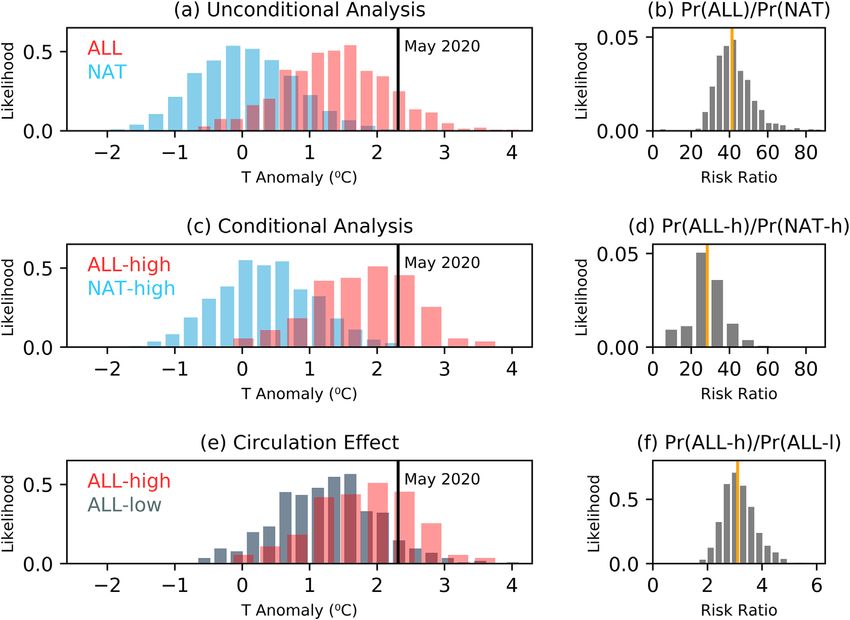
Unconditional attribution.
We first compare the present-day likelihood of exceeding the 2020 observed anomaly (2.3°C)
irrespective of the atmospheric circulation with what it might have been in the NAT climate.
We construct the ALL distribution of May mean temperature anomalies using simulated data
in years 2015–25 (56 simulations × 11 years). As the natural climate is stationary in the long
run, we utilize simulated NAT anomalies of all available years. We find a major shift of the
distribution toward warmer temperatures (Fig. 2a), leading to an estimated increase in the
likelihood of the 2020 event of about 40-fold (Fig. 2b, Table 1). Its return time (inverse prob-
ability) is estimated to decrease from several centuries in the NAT world to about a decade
in the present climate (Table 1), while by 2100 such an event could occur almost every year
(estimate based on ALL data in years 2090–2100). As in previous work, extreme probabilities
are calculated with the generalized Pareto distribution and associated uncertainties with a
simple Monte Carlo bootstrap procedure (Christidis et al. 2013).
The available CMIP6 models contributed unequal number of simulations to our analysis,
which introduces an uncertainty to our results. For example, the large number of CanESM5
simulations gives more weight to a model with a high climate sensitivity. We assess the associ-
ated uncertainty by removing the CanESM4 simulations from the ALL and NAT ensembles and
repeating the analysis. We find that the ALL return time (best estimate) increases from 8.9 to
Fig. 2. (a) Normalized distributions of the May mean temperature anomaly with (pink) and without (blue) human
influence from the unconditional analysis. The vertical black line marks the May 2020 anomaly. (b) Risk ratio showing
the increase in probability due to human influence. The vertical orange line marks the best estimate (50th percen-
tile). (c),(d) As in (a),(b), but for the conditional analysis with probabilities estimated for months with a similar circu-
lation to May 2020. (e) Normalized distributions of the May mean temperature in the present-day climate for seasons
with high (pink) and low (gray) correlations to the May 2020 circulation pattern. (f) Risk ratio showing the increase
in probability due to the atmospheric circulation effect.
AMERICAN METEOROLOGICAL SOCIETY J A N UA RY 2 0 2 2 S3Table 1. Attribution results. Best estimates of the return time, the risk ratio, and their associated 5%–95% uncer- tainty range (in brackets). Results shown for the unconditional analysis, the analysis conditioned on the circulation pattern and for the assessment of the circulation effect. Return times are shown with (ALL) and without (NAT) the effect of human influence. Conditional estimates use modeled months with high (>0.6) and low (
Discussion.
                 Using a suite of 11 state-of-the-art climate models we show that the unprecedented May tem-
                 perature of 2020 in western Europe is becoming increasingly common under the influence of
                 anthropogenic forcings. There are of course uncertainties in model-based assessments (e.g.,
                 biases, model limitations, future emission scenarios), but the level of agreement with simpler
                 approximate probability estimates from observations is reassuring. The models suggest that
                 the return time of May heatwaves with temperatures at least as high as in 2020 has been
                 reduced from centuries to under a decade, although the precise estimated change is sensi-
                 tive to the ensemble used, as already discussed. While spring heatwaves may generally be
                 expected to have less adverse impacts than summer heatwaves, continuous warming in west-
                 ern Europe means that May would gradually bear a closer resemblance to summer months
                 with possibly serious socio-economic repercussions (e.g., increased heat stress and mortality
                 spikes, strain on energy and water availability, increased wildfire risk, agricultural losses,
                 etc.). Therefore, attribution studies like ours provide valuable information to help communi-
                 ties reduce their vulnerability to anthropogenic climate change.

                 Acknowledgments. This work was supported by the Met Office Hadley Centre Climate
                 Programme funded by BEIS and Defra.

References
Bindoff, N. L., and Coauthors, 2013: Detection and attribution of climate change:        Eyring, V., S. Bony, G. A. Meehl, C. A. Senior, B. Stevens, R. J. Stouffer, and K. E.
    From global to regional. Climate Change 2013: The Physical Science Basis. T. F.          Taylor, 2016: Overview of the Coupled Model Intercomparison Project Phase
    Stocker et al., Eds., Cambridge University Press, 867–952.                               6 (CMIP6) experimental design and organization. Geosci. Model Dev., 9,
Christidis, N., and P. A. Stott, 2021: Extremely warm days in the UK in winter 2018/19       1937–1958, https://doi.org/10.5194/gmd-9-1937-2016.
    [in “Explaining Extremes of 2019 from a Climate Perspective”]. Bull. Amer.           Kalnay, E., and Coauthors, 1996: The NCEP/NCAR 40-Year Reanal-
    Meteor. Soc., 102 (1), S39–S44, https://doi.org/10.1175/BAMS-D-20-0123.1.                ysis Project. Bull. Amer. Meteor. Soc., 77, 437–471, https://doi.
—, —, S. Brown, D. J. Karoly, and J. Caesar, 2007: Human contribution to the                 org/10.1175/1520-0477(1996)0772.0.CO;2.
    lengthening of the growing season during 1950–1999. J. Climate, 20, 5441–            Morice, C. P., J. J. Kennedy, N. A. Rayner, and P. D. Jones, 2012: Quantifying un-
    5454, https://doi.org/10.1175/2007JCLI1568.1.                                            certainties in global and regional temperature change using an ensemble
—, —, A. Scaife, A. Arribas, G. S. Jones, D. Copsey, J. R. Knight, and W. J.                 of observational estimates: The HadCRUT4 dataset. J. Geophys. Res., 117,
    Tennant, 2013: A new HadGEM3-A based system for attribution of weather                   D08101, https://doi.org/10.1029/2011JD017187.
    and climate-related extreme events. J. Climate, 26, 2756–2783, https://doi.          Riahi, K., and Coauthors, 2017: The Shared Socioeconomic Pathways and their
    org/10.1175/JCLI-D-12-00169.1.                                                           energy, land use, and greenhouse gas emissions implications: An overview.
—, A. Ciavarella, and P. A. Stott, 2018: Different ways of framing event attri-              Global Environ. Change, 42, 153–168, https://doi.org/10.1016/j.gloenv-
    bution questions: The example of warm and wet winters in the UK similar to               cha.2016.05.009.
    2015/16. J. Climate, 31, 4827–4845, https://doi.org/10.1175/JCLI-D-17-0464.1.        Ruosteenoja, K., J. Räisänen, A. Venäläinen, and M. Kämäräinen, 2015: Projec-
—, M. McCarthy, and P. A. Stott, 2021: The increasing likelihood of tempera-                 tions for the duration and degree days of the thermal growing season in
    tures above 30 to 40°C in the United Kingdom. Nat. Commun., 11, 3093,                    Europe derived from CMIP5 model output. Int. J. Climatol., 36, 3039–3055,
    https://doi.org/10.1038/s41467-020-16834-0.                                              https://doi.org/10.1002/joc.4535.
Ciavarella, A., and Coauthors, 2021: Prolonged Siberian heat of 2020 almost              Stott, P. A., and Coauthors, 2016: Attribution of extreme weather and climate-re-
    impossible without human influence. Climatic Change, 166, 9, https://doi.                lated events. Wiley Interdiscip. Rev.: Climate Change, 7, 23–41, https://doi.
    org/10.1007/s10584-021-03052-w.                                                          org/10.1002/wcc.380.
Di Liberto, T., 2020: May 2020: Global temperatures tie for record hottest. Cli-
    mateWatch Magazine, 15 June 2020, https://www.climate.gov/news-features/
    understanding-climate/may-2020-global-temperatures-tie-record-hottest.

                 AMERICAN METEOROLOGICAL SOCIETY                                                                              J A N UA RY 2 0 2 2         S5
You can also read