APPENDIX A: BENEFIT COST ANALYSIS TECHNICAL MEMORANDUM - BROKEN ARROW CORRIDOR SAFETY IMPROVEMENT PROJECT - City of Broken Arrow
←
→
Page content transcription
If your browser does not render page correctly, please read the page content below

APPENDIX A: BENEFIT COST
ANALYSIS TECHNICAL
MEMORANDUM
BROKEN ARROW CORRIDOR
SAFETY IMPROVEMENT PROJECT
EXECUTIVE SUMMARY
 A benefit-cost analysis (BCA) was conducted for Broken Arrow Corridors Safety Improvement
 Project for submission to the U.S. Department of Transportation (USDOT) as a requirement of a
 discretionary grant application for the FY 2020 RAISE Transportation Grants program. The
 analysis was conducted in accordance with the benefit-cost methodology as outlined by USDOT
 in the Benefit-Cost Analysis Guidance for Discretionary Grant Programs, released in February
 2021. The period of analysis corresponds to 25 years and includes 5 years of construction and
 20 years of benefits after operations begin in 2027.
 Broken Arrow Corridors Safety Improvement Project will increase the safety and quality of life
 for cyclists, pedestrians, and motorists along the 9th Street corridor in the City of Broken Arrow,
 Oklahoma. The project includes four primary components:
 1. Construct Americans with Disabilities (ADA)-compliant sidewalks and ramps;
 2. Construct a multi-use trail and greenery;
 3. Street reconstruction, including street widening to accommodate increased traffic; and
 4. Improve curb and gutter, enclosed storm sewers, and traffic signals.

 Costs
 The capital cost for this Project is expected to be $40.67 million in undiscounted 2019 dollars
 through 2027. At a 7 percent real discount rate, these costs are $27.55 million. The Operations
 and Maintenance (O&M) costs associated with this project are estimated to be $33,518 annually
 until the project goes into effect when costs will be reduced to $8,792 annually. Repair and
 Rehabilitation costs are assumed to be $0. Project costs by year and cost category are shown in
 Table ES-1.
 Table ES- 1: Project Capital Cost Summary, in millions

 Cost Category 2021 2022 2023 2024 2025 2026 2027 Total

 Preliminary Engineering $0.97 $1.46 $0.68 $3.11

 Right of Way $0.71 $0.73 $1.44

 Utility Relocation $0.65 $0.66 $1.31

 Bridge & Ramp $4.37 $5.83 $10.20

 Roadway $6.31 $14.57 $20.88

 Inspections $0.52 $1.46 $1.75 $3.73

 Total $0.97 $1.46 $1.39 $1.34 $5.56 $13.56 $16.32 $40.67

 Total, Discounted 7% $0.91 $1.27 $1.13 $1.05 $3.96 $9.06 $10.16 $27.55

2021 RAISE GRANT APPLICATION – Broken Arrow Corridors Safety Improvement Project i
Benefits
In 2019 dollars, the Project is expected to generate $31.59 million in discounted benefits using a
7 percent discount rate. These monetizable benefits are derived from safety benefits of avoided
collisions, travel time savings, emissions reduction, increased fuel consumption savings,
increased health and mobility benefits realized from increased non-motorized activity, and
residual value of the roadway and bridge ramps. This leads to an overall project Net Present
Value of $4.04 million in 2019 discounted dollars and a Benefit Cost Ratio (BCR) of 1.15. The
overall project benefit matrix can be seen in Table ES- 2.
Table ES- 2: Project Impacts and Benefits Summary, in millions

Current Baseline & Change to Impact Type Monetized Page Reference
Problem to be Addressed Baseline/Alternative Results (at 7% in BCA
 discount rate)

 Improved roadway
 conditions allow for ▪ Reduction in total
The Project focuses on a safer, more efficient crashes along project
corridor in Broken travel throughout the extent with
Arrow with unsafe project extent and new dedicated turn lanes, $11.51 6
travel conditions for shared multi-use trails bridge ramps, and
pedestrians and cyclists and sidewalks lead to new pedestrian and
 more bike-ped trips and cyclist paths
 fewer crashes

 ▪ Improved traffic
 New auxiliary turn lanes
The Project area throughput will yield
 and center left-turn lane
experiences significant travel time savings $16.30 10
 will improve congestion
congestion throughout each
 mitigation efforts
 corridor

 Congestion mitigation
 ▪ Lowered fuel
The Project area components will lower
 consumption will
experiences idling as a total fuel consumption $1.02 12
 decrease costs spent
result of congestion by vehicles in the
 on transportation
 Project area

The Project area Increased travel speeds ▪ Reduced emissions
experiences slow, will lower the emissions will improve
 $0.38 8
inefficient speeds as a output per vehicle in the environmental
result of congestion Project area sustainability

The Project area has no Project improvements
 ▪ Commuter mobility
existing ways to will contribute to more
 benefits for bicyclists $0.006 14
commute or travel diverse mobility options
 and pedestrians
recreationally for users

The Project area does Project improvements
 ▪ Improved health
not contribute will install infrastructure
 benefits from $0.09 13
positively to personal capable of supporting
 increased recreation
health of potential users health benefits

2021 RAISE GRANT APPLICATION – Broken Arrow Corridors Safety Improvement Project ii
Current Baseline & Change to Impact Type Monetized Page Reference
Problem to be Addressed Baseline/Alternative Results (at 7% in BCA
 discount rate)
 and active
 commuting

 ▪ Residual value
 The Project will develop accrued from the
There is no existing
 assets for which the remaining value on
infrastructure in the
 Broken Arrow can the trails at the end $2.11 9
area for Broken Arrow
 leverage financial of the analysis period
to capture value on
 benefits given the assets’
 useful lives

Broken Arrow must
 The Project will lower ▪ Operations and
conduct costly
 the annual operations maintenance cost $0.18 10
maintenance on these
 and maintenance costs savings
corridors

The generation of benefits from the current state to the proposed Project condition is shown
below in Table ES- 3.
Table ES- 3: Project Impacts Under Build vs. No-Build Conditions

Category Unit No-Build Build Change

Vehicle-Miles Traveled VMT 213,381,959 213,381,959 -

Vehicle-Hours Traveled VHT 7,245,008 5,365,246 (1,879,762)

Fuel Consumed Gallons 9,227,337 7,762,056 (1,465,281)

Fatalities # - - -

Injuries # 561 261 (300)

Property Damage Only # 1,181 549 (632)

CO2 Emissions Tons 194.2 172.8 (21.4)

NOx Emissions Tons 14.9 14.4 (0.5)

PM2.5/PM10 Emissions Tons 1.5 1.3 (0.2)

Sox Emissions Tons 0.4 0.4 0.0

2021 RAISE GRANT APPLICATION – Broken Arrow Corridors Safety Improvement Project iii
Table of Contents
 Executive Summary ..................................................................................................................... i
 Costs ........................................................................................................................................i
 Benefits ................................................................................................................................... ii

 1 | Introduction .......................................................................................................................... 1
 1.1. BCA Framework ................................................................................................................1
 1.2. Report Contents ...............................................................................................................2

 2 | Project Overview................................................................................................................... 2
 2.1. Description .......................................................................................................................2
 2.2. General Assumptions........................................................................................................3
 2.3. Base Case and Build Case..................................................................................................3

 3 | Project Costs ......................................................................................................................... 4
 3.1. Capital Costs .....................................................................................................................4
 3.2. Operating and Maintenance Costs....................................................................................4

 4 | Project Benefits ..................................................................................................................... 5
 4.1. Demand Projections .........................................................................................................5
 4.2. Safety ...............................................................................................................................6
 4.3. Environmental Sustainability ............................................................................................8
 4.4. State of Good Repair ......................................................................................................10
 4.4.1. Residual Value .................................................................................................. 10
 4.4.2. Operations and Maintenance Savings............................................................... 10
 4.5. Economic Competitiveness .............................................................................................10
 4.5.1. Travel Time Savings .......................................................................................... 10
 4.5.2. Fuel Consumption Savings ................................................................................ 12
 4.6. Quality of Life .................................................................................................................13
 4.6.1. Health Benefits ................................................................................................. 14
 4.6.2. Recreational Benefits ....................................................................................... 14

2021 RAISE GRANT APPLICATION – Broken Arrow Corridors Safety Improvement Project iv
4.6.3. Commuter Benefits .......................................................................................... 14

5 | Summary of Results ............................................................................................................ 15
 5.1. Evaluation Measures ......................................................................................................15
 5.2. BCA Results ....................................................................................................................15
 5.3. Sensitivity Analysis..........................................................................................................16

List of Figures
Figure 1: Project Improvements ................................................................................................. 3

List of Tables
Table ES- 1: Project Capital Cost Summary, in millions................................................................ i
Table ES- 2: Project Impacts and Benefits Summary, in millions ................................................ ii
Table ES- 3: Project Impacts Under Build vs. No-Build Conditions............................................. iii
Table 1: Capital Cost Breakdown, in millions.............................................................................. 4
Table 2: Project Benefits ............................................................................................................. 5
Table 3: Average Daily Traffic .................................................................................................... 6
Table 4: Crashes from 2015 - 2019.............................................................................................. 6
Table 5: Safety Benefits Assumptions ........................................................................................ 7
Table 6: Safety Benefits, in millions ............................................................................................ 7
Table 7: Safety Monetization Values .......................................................................................... 8
Table 8: Assumptions to Environmental Sustainability Benefit .................................................. 9
Table 9: Environmental Sustainability Benefit, in thousands ..................................................... 9
Table 10: Residual Value Benefit, in millions ............................................................................ 10
Table 11: Operations and Maintenance Savings, in millions .................................................... 10
Table 12: Speed Flow Curve Inputs ........................................................................................... 11
Table 13: Time Travel Savings Benefit, in millions .................................................................... 12
Table 14: Travel Time Savings Assumptions ............................................................................. 12
Table 15: Fuel Consumption Savings, in millions ...................................................................... 13
Table 16: Fuel Consumption Savings Assumptions ................................................................... 13
Table 17: Quality of Life Benefits, in millions ........................................................................... 13
Table 18: Benefit Cost Analysis Results, in millions .................................................................. 15
Table 19: Sensitivity Analysis Results, NPV in millions ............................................................. 16

2021 RAISE GRANT APPLICATION – Broken Arrow Corridors Safety Improvement Project v
1 | INTRODUCTION A benefit-cost analysis (BCA) was conducted for Broken Arrow Corridors Safety Improvement Project for submission to the U.S. Department of Transportation (USDOT) as a requirement of a discretionary grant application for the RAISE 2021 program. The following section describes the BCA framework, evaluation metrics, and report contents. 1.1. BCA Framework A BCA is an evaluation framework to assess the economic advantages (benefits) and disadvantages (costs) of an investment alternative. Benefits and costs are broadly defined and are quantified in monetary terms to the extent possible. The overall goal of a BCA is to assess whether the expected benefits of a project justify the costs from a national perspective. A BCA framework attempts to capture the net welfare change created by a project, including cost savings and increases in welfare (benefits), as well as disbenefits where costs can be identified (e.g., project capital costs), and welfare reductions where some groups are expected to be made worse off as a result of the proposed project. The BCA framework involves defining a Base Case or “No-Build” Case, which is compared to the “Build” Case, where the grant request is awarded, and the project is built as proposed. The BCA assesses the incremental difference between the Base Case and the Build Case, which represents the net change in welfare. BCAs are forward-looking exercises which seek to assess the incremental change in welfare over a project lifecycle. The importance of future welfare changes is determined through discounting, which is meant to reflect both the opportunity cost of capital as well as the societal preference for the present. The analysis was conducted in accordance with the benefit-cost methodology as recommended by the USDOT in the 2021 Benefit-Cost Analysis Guidance for Discretionary Grant Programs. This methodology includes the following analytical assumptions: Defining existing and future conditions under a No-Build base case as well as under the Build; Estimating benefits and costs during project construction and operation, including 20 years of operations beyond the Project completion when benefits accrue; Using USDOT recommended monetized values for reduced fatalities, injuries, property damage, travel time savings, and emissions, while relying on best practices for monetization of other benefits; Presenting dollar values in real 2019 dollars. In instances where cost estimates and benefits valuations are expressed in historical or future dollar years, using an appropriate inflation rates to adjust the values; Discounting future benefits and costs with a real discount rate of 7 percent consistent with USDOT guidance. 2021 RAISE GRANT APPLICATION – Broken Arrow Corridors Safety Improvement Project 1
1.2. Report Contents
Section 2 of this Appendix contains a description of Broken Arrow Corridors Safety Improvement
Project elements, information on the general assumptions made in the analysis, and a
description of the base case compared to the build case. Section 3 provides a summary of the
anticipated project costs. Section 4 reviews the expected economic benefits the project would
generate, including a review of the assumptions and methodology used to calculate these
benefits. Finally, Section 5 reports the high-level results of the benefit-cost analysis.

2 | PROJECT OVERVIEW
2.1. Description
Broken Arrow Corridors Safety Improvement Project intends to develop critical infrastructure
improvements in the City of Broken Arrow, Oklahoma. The Project will greatly improve safety
and mobility options for motorists, pedestrians, and cyclists while improving the flow of people
and goods to urban and rural areas along the 9th Street Corridor, a secondary arterial in Broken
Arrow. Currently, the Corridors do not provide proper safety for pedestrians and cyclists, and in
turn have caused serious and deadly accidents. The Corridor is in desperate need of
improvement to provide pedestrian safety, mobility, and economic access within the City.
The Project is located adjacent to important local centers of economic activity, essential services,
recreational opportunities, and growing neighborhoods. Stonewood Hills is located adjacent to
the Broken Arrow Expressway (SH-51), features the area’s largest Bass Pro Shops, a series of
developing land tracts, and one of the area’s largest conference centers and hotel complexes.
Additional hotels are anticipated to open in future years, as Stonewood Hills is projected to grow
in economic activity as real estate in the area continues to develop. Nearby, the Shops at Broken
Arrow along the eastern edge of the project corridor feature almost 20 different retail outlets.
The Project area also includes important access to schools, nursing homes, and government
services. Finally, the Project is adjacent to the Rose District, a Qualified Opportunity Zone home
to residents of lower median income and a higher portion of those living in poverty.
The Project represents a crucial opportunity for Broken Arrow and the federal government to
make important safety, financial, and mobility connections for the residents of and visitors to
Broken Arrow. The significant enhancements along the corridor are an improvement to the long-
term quality of life for everyone in the City of Broken Arrow.

2021 RAISE GRANT APPLICATION – Broken Arrow Corridors Safety Improvement Project 2
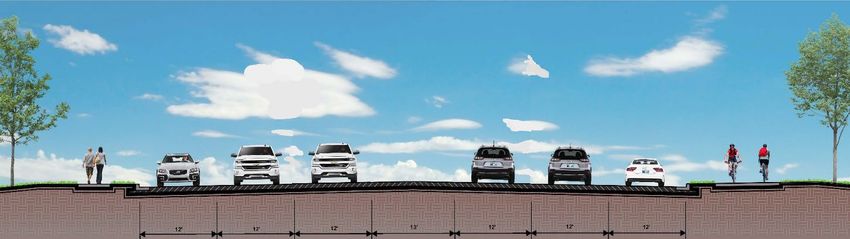
Figure 1: Project Improvements

2.2. General Assumptions
For project investments, dollar figures in this analysis are expressed in constant 2019 dollars
(2019$). The real discount rate used from this analysis was 7.0 percent, consistent with USDOT
2021 Benefit-Cost Analysis Guidance for Discretionary Grant Programs.
For the project, the evaluation period includes the 5-year design/construction period during
which capital expenditures are undertaken, plus 20 years of operations beyond the project
completion within which to accrue benefits.
All benefits and costs are conservatively assumed to occur at the end of each year for purposes
of present value discounting. Benefits accruing from the improvements are assumed to begin in
the calendar year following construction’s completion.
For the purposes of this study, it has been assumed that design of the project begins as early as
2021, while construction will begin in 2023 and continues through 2027; it is assumed that the
project would be fully complete and operational midway through 2027. The analysis period,
therefore, begins in 2023 when construction starts and continues through 20 years of
operations, or through 2046.

2.3. Base Case and Build Case
For the purposes of this BCA, the no-build/base case assumes that none of the contemplated
corridor improvement projects would be completed, and that the existing inefficient roadway
designs and poor pedestrian and cyclist travel infrastructure would remain in its current
condition. The no-build/base case would include none of the proposed project enhancements
and would retain the same higher rate of $33,518 in annual O&M costs throughout the analysis
period.

2021 RAISE GRANT APPLICATION – Broken Arrow Corridors Safety Improvement Project 3
3 | PROJECT COSTS
3.1. Capital Costs
Capital costs for this project are primarily associated with the actual construction of the roadway
improvements, bridge ramps, and sidewalks and multi-use paths. Construction costs will entail
the paving and installation of multi-use trails along both the east and west sides of 9th, installing
bridge ramps across the Broken Arrow Expressway on 9th, and adding auxiliary and dedicated-
left turn lanes on 9th. capital costs associated with the Project come out to $40.67 million in
undiscounted 2019 dollars and $27.55 in discounted 2019 dollars. Table 1 shows the full cost
breakdown.
Table 1: Capital Cost Breakdown, in millions

Cost Category 2021 2022 2023 2024 2025 2026 2027 Total

Preliminary Engineering $0.97 $1.46 $0.68 $3.11

Right of Way $0.71 $0.73 $1.44

Utility Relocation $0.65 $0.66 $1.31

Bridge & Ramp $4.37 $5.83 $10.20

Roadway $6.31 $14.57 $20.88

Inspections $0.52 $1.46 $1.75 $3.73

Total $0.97 $1.46 $1.39 $1.34 $5.56 $13.56 $16.32 $40.67

Total, Discounted 7% $0.91 $1.27 $1.13 $1.05 $3.96 $9.06 $10.16 $27.55

Source: City of Broken Arrow 2021

3.2. Operating and Maintenance Costs
The trail enhancements proposed under this project are expected to lead to a reduction in
operating and maintenance costs from an annual rate of $33,518 in the no-build scenario to
$8,792 after the Project opens (all values in undiscounted 2019 dollars) based on historical data
from the City. There will be no repair and rehabilitation costs to the project. The lifecycle O&M
costs will be discussed in Section 4.2.

2021 RAISE GRANT APPLICATION – Broken Arrow Corridors Safety Improvement Project 4
4 | PROJECT BENEFITS
The benefits of Broken Arrow Corridors Safety Improvement Project include travel time savings,
reduced fuel consumption, reduction in damage to property and humans resulting from crash
incidents, mobility and health improvements, and residual value accrued on the assets.
The analysis uses standardized factors provided by governmental and industry sources to
efficiently determine the monetized value of user and social benefits resulting from the project
improvements. Table 2 shows Broken Arrow Corridors Safety Improvement Project’s long-term
benefits aligned to the benefit categories.
Table 2: Project Benefits

Criteria Benefit (Disbenefit Description Monetized (7% Discount
 Category) Millions)

 Economic Travel Time Savings Reduction in travel time $16.30
 Competitiveness for motorists due to
 roadway improvements

 Reduced Fuel Improved throughput will $1.02
 Consumption reduce idling and money
 spent on automobile fuel

 Safety Reduced Collisions Reduction in traffic $11.51
 fatalities/injuries, and
 PDO crashes

Environmental Reduced Emissions Reduction in three types $0.38
Sustainability of vehicle emissions

 State of Good Repair Residual Vale and Accrues value of trail $2.11
 Operational Savings assets over the analysis
 period and operational
 savings

 Quality of Life Health and Mobility Health benefits realized $0.09
 Benefits from the improved
 lifestyle of those that
 switch to bicycle travel
 rather than automobile,
 and that use the new
 facilities for recreation

Source: WSP 2021

4.1. Demand Projections
The BCA analysis calculates current and future demand for the 9th street corridor throughout the
analysis period. The demand projections provide the foundation for which the analysis of the
numerous benefits of the Project is built.

2021 RAISE GRANT APPLICATION – Broken Arrow Corridors Safety Improvement Project 5
To estimate demand along the Project corridor, data was need for the average daily traffic and
population in the area. Average daily traffic amounts from 2019 are provided by StreetLight Data
for five segments of 9th street. The traffic movements are averaged across segments and
doubled to account for traffic flow in each direction. The average daily StreetLight Data traffic
data is listed in Table 3 below by segment.
Table 3: Average Daily Traffic

 Roadway Segment Average Daily Traffic

 177th & 61st E Ave 13,489

 North of the Ramps on 177th 31,286

 Broken Arrow Expressway (Exits) 7,374

 South of the Ramps on 177th 29,031

 177th & 71st E Ave 20,831

Source: StreetLight Data
To project demand growth over the Project life, the analysis uses population data for Tulsa
County, OK to establish a growth rate. The population data is sourced from available US Census
data on Data.Census.gov from 2010 to 2019. The population of Tulsa County grew 0.82% from
605,418 in 2010 to 651,552 in 2019. The same growth rate is applied to the Street Light average
daily traffic and annualized by an annualization factor of 260 days to calculate the traffic demand
for each year of the analysis period.

4.2. Safety
The safety benefits assessed in this analysis include a reduction in fatalities and injuries, as well
as a reduction in other property damage crash costs resulting from the project.
Safety benefits are primarily derived from the roadway crashes that will be avoided from the
added auxiliary and left turn lanes as well as multi-use path and sidewalk construction efforts
that give motorists a safer way of turning onto and off of Broken Arrow’s busiest highway: The
Broken Arrow Expressway. The recent crash history from 2015-2019 is shown in Table 4.
Table 4: Crashes from 2015 - 2019

 Crash Severity Total Crashes

 O 179

 C 36

 B 47

 A 2

2021 RAISE GRANT APPLICATION – Broken Arrow Corridors Safety Improvement Project 6
Crash Severity Total Crashes

 K 0

 Injured Severity Unknown 0

 Total Crashes 254

Source: Oklahoma Department of Transportation (ODOT)
The crash data is converted into Injuries Per Year by allocating crashes based on the percentage
of auto vs. truck drivers and the respective occupancy. The Injuries Per Year amounts are
reduced by a Crash Modification Factor which accounts for the safety improvements
implemented along the roadway. The Safety assumptions are highlighted in Table 5.
Table 5: Safety Benefits Assumptions

 Assumptions Value Source

 Auto Traffic Percentage 97% ODOT HPMS Data

Truck Traffic Percentage 3% ODOT HPMS Data

 Crash Modification Factors

 Four to Five Lane Conversion 0.35 CMF Clearinghouse

 Provide Bike Lane 0.65 CMF Clearinghouse

 Install Safety Edge Treatment 0.60 CMF Clearinghouse

 Average Crash Modification Factor 0.54

The annual reductions in crashes are monetized using USDOT values for crashes of different
types (shown in Table 7). The project lifecycle’s safety benefits are expected to total $33.72
million in 2019 undiscounted dollars, and $11.51 million in 2019 dollars at a 7 percent
discounted rate, as shown in Table 6.
Table 6: Safety Benefits, in millions

 Benefit Undiscounted Discounted (7%)

 Fatality Reduction $0 $0

Incapacitating Injury Reduction $3.20 $1.10

 Non-incapacitant Injury Reduction $20.48 $6.99

Possible Injury Reduction $8.01 $2.73

2021 RAISE GRANT APPLICATION – Broken Arrow Corridors Safety Improvement Project 7
Benefit Undiscounted Discounted (7%)

Property Damage Reduction $2.03 $0.69

 Total Safety Benefits $33.72 $11.51

Source: WSP 2021

Table 7: Safety Monetization Values

 Variable Unit Value Source

No Injury - O 2019$ $3,200 US DOT Guidance,
 February 2021

Possible Injury - C 2019$ $72,500 US DOT Guidance,
 February 2021

Non-Incapacitating - B 2019$ $142,000 US DOT Guidance,
 February 2021

Incapacitating - A 2019$ $521,300 US DOT Guidance,
 February 2021

Killed - K 2019$ $10,900,000 US DOT Guidance,
 February 2021

Injured Severity Unknown 2019$ $197,600 US DOT Guidance,
 February 2021

Unknown If Injured (# 2019$ $150,200 US DOT Guidance,
Incidents Reported) February 2021

4.3. Environmental Sustainability
The environmental sustainability benefits associated with the Project are an overall reduction in
vehicle emissions. Project improvement to the corridor will increase travel speeds closer to the
free flow speed of 40 mph. The free flow travel speed of 40 mph creates fuel efficiency when
compared to traveling at reduced speeds, which reduces emissions.
Four forms of emissions were identified, measured and monetized, including: carbon dioxide
(CO2), nitrous oxide (NOx), particulate matter (PM2.5 and PM10), and sulfur dioxide (SO2). The
analysis utilized the speed curve data and USDOT provided emissions values to calculate the
emissions output of a single vehicle traveling at the anticipated travel speed for each year of
operations. The emissions results were applied to the daily traffic amounts, then annualized, to
determine the expected emissions output for all vehicles using the corridor under both the Build
and No-Build scenarios.

2021 RAISE GRANT APPLICATION – Broken Arrow Corridors Safety Improvement Project 8
The assumptions used in the estimation of emissions reduction benefits are summarized in Table
8.
Table 8: Assumptions to Environmental Sustainability Benefit

 Variable Unit Value Source

 $50 (in 2020) -
Cost of CO2 emissions
 $84 (in 2050)

 $15,700 (in 2020) -
Cost of NOx emissions
 $18,000 (in 2050)
 US DOT Guidance,
 2019$ per metric ton
 February 2021
 $729,300 (in 2020) -
Cost of PM2.5 emissions
 $852,700 (in 2050)

 $40,400 (in 2020) -
Cost of SOx emissions
 $48,200 (in 2050)

 Varies by year, vehicle California Air Resources
Emissions per VMT for
 Grams per VMT type, speed, and emission Board EMFAC Database,
NOx, PM2.5, and SOx
 type 2017

CO2 emissions per gallon
 $8,887
of gasoline
 US EPA, Greenhouse Gas
 Lbs. per gallon
 Equivalencies Calculator
CO2 emissions per gallon
 $10,180
of diesel

The environmental sustainability benefits from a reduction in emissions are listed in Table 9.
Table 9: Environmental Sustainability Benefit, in thousands

 Benefit Undiscounted Discounted (7%)

CO2 Emissions Reduction $1.40 $0.56

NOx Emissions Reduction $383.20 $156.38

SOx Emissions Reduction $3.80 $1.47

PM2.5/10 Emissions Reduction $496.69 $221.96

Total Emissions Reduction $885.08 $379.37

Source: WSP 2021

2021 RAISE GRANT APPLICATION – Broken Arrow Corridors Safety Improvement Project 9
4.4. State of Good Repair
4.4.1. RESIDUAL VALUE
State of Good Repair and Residual Value benefits are derived from the value remaining on the
bridge ramp and roadway’s lifecycle values at the end of the analysis period. The design life of
the ramps are assumed to be 50 years (bridge structures) and 30 years for the roadway (asphalt
pavement). At the end of the project analysis period, Broken Arrow will realize the additional
benefit of the residual value of the ramps and roadway that still exist. The original value of the
ramps will be $10.20 million (2019 dollars), amounting to $0.98 million (2019 dollars, discounted
at seven percent) in residual value benefits through the end of the analysis period. The original
value of the roadway will be $20.88 million (2019 dollars), amounting to $1.12 million (2019
dollars, discounted at seven percent) in residual value benefits through the end of the analysis
period The full benefits are shown in Table 10.
Table 10: Residual Value Benefit, in millions

 Benefit Expected Lifespan Capital Cost Value in Final Year

 Undiscounted Discounted (7%)

 9th Bridge Ramps 50 $10.20 $6.12 $0.98

 9th Roadway 30 $20.88 $6.96 $1.12

Source: WSP 2021

4.4.2. OPERATIONS AND MAINTENANCE SAVINGS
Operations and maintenance (O&M) savings are derived from the project’s improvements
requiring less in annual maintenance fees than the No-Build scenario. The Project would require
$8,792 annually in O&M once implemented, whereas the No-Build scenario would continue to
require $33,518 in annual fees for upkeep on the corridor. The Project’s lifecycle O&M benefits
are the difference between the Build and No-Build scenario and are listed in Table 11.
Table 11: Operations and Maintenance Savings, in millions

 Benefit Undiscounted Discounted (7%)

 Change in O&M Costs $0.51 $0.18

Source: WSP 2021

4.5. Economic Competitiveness
4.5.1. TRAVEL TIME SAVINGS
The Broken Arrow Corridors Safety Improvement Project will contribute to economic
competitiveness by alleviating ongoing traffic congestion issues along the 9th Street corridor.
Despite being a corridor with one of the highest Average Annual Daily Traffic (AADT) of any

2021 RAISE GRANT APPLICATION – Broken Arrow Corridors Safety Improvement Project 10
arterials in Broken Arrow, the road does not have the current lane capacity to support efficient
movement of people or goods. The Project would expand the roads’ capacities and connect
residents and visitors to key centers of employment and commercial activity with improved
throughput and improved travel time reliability. The Project is also adjacent to the Rose District,
a prominent commercial area designated as a Qualified Opportunity Zone, and may impact real
estate prices along the corridor, but these benefits were not measured in the BCA.
Travel time savings are calculated using a speed flow curve. The travel speeds under the Build
and No-Build conditions are converted to travel time over the 1-mile segment of 9th street, with
the difference representing the savings offered by the Build over the No-Build. The speed curve
calculation utilizes the inputs shown in Table 12.
Table 12: Speed Flow Curve Inputs

 Input Unit Value Source

Free Flow Speed MPH 40 ODOT

Average Daily Traffic Vehicles per day 35,390 StreetLight

Average Daily Traffic Percentage 0.85% Census Data
Growth Rate

Roadway Capacity

 Build Vehicles per day 54,300 ODOT

 No-Build Vehicles per day 32,400 ODOT

Roadway Length Miles 1 ODOT

To calculate current and future roadway capacity, ODOT provided the study, “Highway Capacity
Manual Intersection Capacity Analysis Summary”, outlining level of service at five intersections
along 9th street. The study provided traffic scenarios for current No-Build, “Do Nothing 2020”,
future No-Build, “Do Nothing 2045”, current Build, “Study for 2020”, and future Build, “Study for
2045”. The different scenarios received level of service estimates for the timing categories, “AM
Peak Hour”, “PM Peak Hour”, and “Saturday Peak Hour”. The demand projection analysis
averaged the levels of service by time to find the expected level of service under Build and No-
Build conditions. The average level of service under both conditions, D, was converted to
capacity using the Standard Roadway Capacities table. In the Build condition, the capacity for a
7-lane arterial (two way left) at level of service D is 54,300, whereas under the No-Build
condition, a 5-lane arterial (two way left) at level of service D is 32,400.
Using the speed flow curve, the travel time savings per vehicle is multiplied by the yearly
expected average annual daily traffic amount and separated between auto and truck traffic. The
savings are monetized by applying the anticipated occupancy of auto and truck traffic and the
respective monetization factor.
The Project anticipates $56.24 million of travel time benefits in undiscounted 2019 dollars and
$16.30 million in discounted 2019 dollars from time savings due to improved throughput and

2021 RAISE GRANT APPLICATION – Broken Arrow Corridors Safety Improvement Project 11
travel time reliability. The full benefits are shown in Table 13 with assumptions shown in Table
14.
Table 13: Time Travel Savings Benefit, in millions

 Benefit Percent of Traffic Undiscounted Discounted (7%)

 Travel Time Savings – Auto 97% $54.51 $15.80

Travel Time Savings – Truck 3% $1.74 $0.50

 Total 100% $56.24 $16.30

Source: WSP 2021

Table 14: Travel Time Savings Assumptions

 Variable Unit Value Source

 Value of Travel Time 2019$ per person hour $16.50 US DOT Guidance,
 Savings - Personal, Local February 2021

Value of Travel Time 2019$ per person hour $27.90 US DOT Guidance,
Savings - Business, Local February 2021

 Value of Travel Time 2019$ per person hour $17.90 US DOT Guidance,
 Savings - All Purposes, February 2021
 Local

Value of Travel Time 2019$ per person hour $30.80 US DOT Guidance,
Savings – Truck Drivers February 2021

 Passenger Vehicle Passenger(s) 1.67 US DOT Guidance,
 Occupancy February 2021

 Truck Occupancy Passenger(s) 1 US DOT Guidance,
 February 2021

4.5.2. FUEL CONSUMPTION SAVINGS
The Project’s congestion mitigation will also improve the amount of fuel consumed for motor
vehicles along the corridor. Vehicle Miles Traveled (VMT) is expected to remain the same after
the Project is completed, however the average speed is anticipated to rise, resulting in improved
throughput, reduced congestion, and a lower overall amount of vehicle idling. VMT reductions
were divided by the quotient of Energy Information Administration (EIA) fuel efficiency rates and
EIA fuel efficiency factors for automotive vehicles and trucks to determine the overall fuel
consumption savings between the Build and No-Build cases. These factors will contribute to a
lower amount of fuel consumed over the course of the Project’s lifecycle. The Project anticipates
realizing $3.64 million in undiscounted 2019 dollars and $1.02 in discounted 2019 dollars. Full
benefits, assumptions, and sources are below in Table 15 and Table 16.

2021 RAISE GRANT APPLICATION – Broken Arrow Corridors Safety Improvement Project 12
Table 15: Fuel Consumption Savings, in millions

 Benefit Undiscounted Discounted (7%)

 Fuel Savings $3.64 $1.02

Source: WSP 2021

Table 16: Fuel Consumption Savings Assumptions

 Variable Unit Value Source

 Value of Travel Time 2019$ per person hour $16.50 US DOT Guidance,
 Savings - Personal, Local February 2021

Value of Travel Time 2019$ per person hour $27.90 US DOT Guidance,
Savings - Business, Local February 2021

 Value of Travel Time 2019$ per person hour $17.90 US DOT Guidance,
 Savings - All Purposes, February 2021
 Local

 Value of Travel Time 2019$ per person hour $30.80 US DOT Guidance,
 Savings – Truck Drivers February 2021

4.6. Quality of Life
This project will create quality of life benefits including improved health and recreation.
Health benefits are calculated for cyclists and pedestrians, both commuter and recreational, who
are shifting routes to or will be using for the first time the new multi-use path or sidewalk.
Mobility benefits are calculated for commuters and recreational pedestrians and cyclists along
the trails. The Project improves users’ quality of life further through improving aesthetics and the
natural environment, but these benefits have not been quantified. The Project’s location amidst
centers of employment and commercial centers, as well as essential services like schools and
nursing homes, make these quality of life improvements essential.
Table 17 illustrates the quantified benefits relating to health and mobility, which total $0.28
million in undiscounted benefits over the life of the project. More detail on the methodology
used to derive these estimates is below.
Table 17: Quality of Life Benefits, in millions

 Benefit Undiscounted Discounted (7%)

 Health Benefits $0.04 $0.006

Environmental Sustainability and $0.24 $0.09
Mobility Benefits

 Total Quality of Life Benefits $0.28 $0.10

2021 RAISE GRANT APPLICATION – Broken Arrow Corridors Safety Improvement Project 13
Source: WSP 2021

4.6.1. HEALTH BENEFITS
Health benefits apply to cyclists who would otherwise not use a bicycle under existing
conditions. These cyclists realize benefits by increased daily physical activity, which has been
shown to improve the health and reduce future medical costs. The NCHRP 552 guidelines
identified ten studies which estimated the overall health benefit of increased physical activity.
These benefits ranged from $19 to $1,175 per new cyclist per year, with a median value of $128
(all values in 2006$). These values were adjusted to 2019$, resulting in a value of $155.58 per
cyclist. The NCHRP 552 guidelines state that this benefit exists once per year for each daily new
user. The benefit is thus defined as:
 Health Benefit= b_n*H
Where
 b_n = volume of daily new bicyclists (commuter and recreational)
 = per-capita health benefit, 2019$
The number of users were calculated by leveraging USDOT and NCHRP values associated with
new bike and pedestrian infrastructure attracting existing and new cyclists and pedestrians to
the infrastructure for both recreational and commuting purposes. These new corridor users
were then multiplied by the overall project corridor distance to estimate overall VMT added
from pedestrians and cyclists.

4.6.2. RECREATIONAL BENEFITS
The NCHRP 552 guidelines also identified benefits specifically for new recreational users of
bicycle facilities. These benefits result from the time spent performing recreational activity, since
this represents a revealed preference in how recreational cyclists choose to spend their time.
This time is assumed to be one hour per bicyclist including preparation and clean-up time. The
value of time for this benefit is assumed to be lower than the value of time used for commuters
or the population at large. The NCHRP 552 guidelines indicate a value of $10 per hour in 2006
dollars, which becomes $12.17 per hour in 2019 dollars for cyclists, and commuter benefits were
$16.60 per hour for cyclists and $0.18 per person-mile for pedestrians.

4.6.3. COMMUTER BENEFITS
USDOT BCA guidance from February 2021 identified benefits specifically for new users of bicycle
and pedestrian facilities that take advantage of this new infrastructure as part of their
commutes. These benefits result from the time spent commuting using active transportation
means instead of by transit or motor vehicles, since this represents a revealed preference in how
active transportation users choose to travel. The value of time for this benefit is assumed to be
greater than the value of time used for recreational users or the population at large. USDOT BCA
guidance indicates a value of $16.60 per hour for cyclists and $0.18 for pedestrians.

2021 RAISE GRANT APPLICATION – Broken Arrow Corridors Safety Improvement Project 14
5 | SUMMARY OF RESULTS 5.1. Evaluation Measures The benefit-cost analysis converts potential gains (benefits) and losses (costs) from the Project into monetary units and compares them. The following common benefit-cost evaluation measures are included in this BCA: Net Present Value (NPV): NPV compares the net benefits (benefits minus costs) after being discounted to present values using the real discount rate assumption. The NPV provides a perspective on the overall dollar magnitude of cash flows over time in today’s dollar terms. Benefit Cost Ratio (BCR): The evaluation also estimates the benefit-cost ratio; the present value of incremental benefits is divided by the present value of incremental costs to yield the benefit-cost ratio. The BCR expresses the relation of discounted benefits to discounted costs as a measure of the extent to which a project’s benefits either exceed or fall short of the costs. 5.2. BCA Results The table below presents the evaluation results for the project. Results are presented in undiscounted and discounted at 7 percent as prescribed by the USDOT. All benefits and costs were estimated in constant 2019 dollars over an evaluation period extending 20 years beyond system completion in 2027. The total benefits from the project improvements within the analysis period represent $31.59 million when discounted at 7 percent. The total capital costs are calculated to be $27.55 million when discounted at 7 percent. The difference of the discounted benefits and costs equal a net present value of $4.04 million, resulting in a benefit-cost ratio (BCR) of 1.15. The BCA results are summarized in Table 18. Table 18: Benefit Cost Analysis Results, in millions Benefit Undiscounted Discounted (7%) Total Benefits $108.35 $31.59 Total Costs $40.67 $27.55 Net Present Value (NPV) $67.68 $4.04 Benefit Cost Ratio (BCR) 2.66 1.15 Internal Rate of Return (IRR) 8.3% 1.3% Source: WSP 2021 2021 RAISE GRANT APPLICATION – Broken Arrow Corridors Safety Improvement Project 15
5.3. Sensitivity Analysis
This analysis relies on many assumptions that, while based on the best available knowledge, are
uncertain. This sensitivity analysis evaluates the impact of adjusting key assumptions on the BCR
and NPV. Table 19 demonstrates that even with significant changes in key assumptions, the
Project’s benefits still exceed the costs.
Table 19: Sensitivity Analysis Results, NPV in millions

 Benefit BCR NPV Change in NPV

 No Change to Assumptions 1.15 $4.04 -

Increase to CMF Factor from 0.54 to 0.95 -$1.29 -132%
0.75

 Reduction to Value of Time by 16% 1.05 $1.40 -65%

Reduction of AADT Growth Rate to 0.84 -$4.35 -208%
half

 Increase to Capital Costs by 20% 0.97 -$1.05 -126%

Source: WSP 2021

2021 RAISE GRANT APPLICATION – Broken Arrow Corridors Safety Improvement Project 16
17
You can also read