Immunisation Coverage (Primary Series) and Children's Interactions with the Health System - An Overview - Counties Manukau ...
←
→
Page content transcription
If your browser does not render page correctly, please read the page content below
Immunisation Coverage
                  (Primary Series)
             and Children’s Interactions
              with the Health System

An Overview

                                    1
 Prepared: Population Health Team       Counties Manukau Health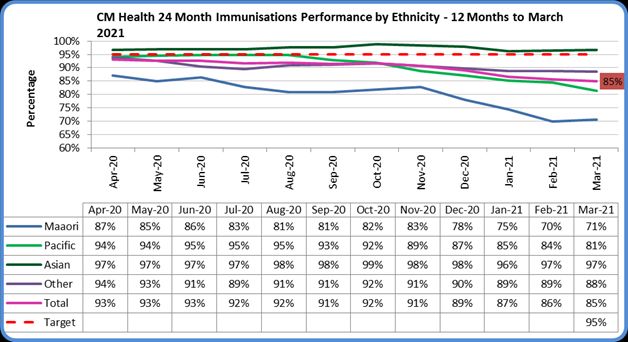
Disclaimer

Information within the report may be freely used provided the source is acknowledged.

Every effort has been made to ensure that the information in this report is correct.

Counties Manukau Health and the authors will not accept any responsibility for information which is incorrect,
or any actions taken as a result of the information in this report.

Published in August 2021

By Counties Manukau Health

Private Bag 94052

South Auckland Mail Centre

Manukau City

New Zealand

ISBN 978-0-9876500-9-2

Suggested citation:

Chan WC, Papaconstantinou D, Oulaghan B, Lee M, Anderson P (2021) Immunisation Coverage (Primary
Series) and Children’s Interactions with the Health System.

Double vowels are used rather than macrons where appropriate in Te Reo Maaori words in keeping with the
Tainui convention, as mana whenua of the Counties Manukau district.

Acknowledgements

The authors would like to acknowledge the helpful peer review and feedback of Dr Gary Jackson.

                                                Page 2 of 34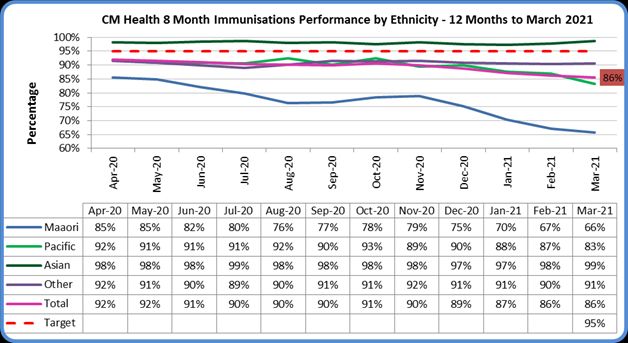
Immunisation coverage (primary series) and
children’s interactions with the health
system
Wing Cheuk Chan, Dean Papa, Bede Oulaghan, Mildred Lee, Pip Anderson July 2021
Summary and recommendations
Childhood vaccination coverage in Counties Manukau is currently well below the target of 95% for all
ethnic groups. The purpose of this report is to explore data currently available to help understand the
opportunities for action to increase childhood vaccination coverage in CM Health.
Coverage
Counties Manukau (CM) Maaori and Pacific children’s immunisation coverage fell significantly over the 12-
month period to March 2021 across all age milestones. For the 12-month period to March 2021, 936
children had not met their 8-month immunisation milestone, 718 of them Maaori and Pacific (76%).1 CM
Maaori and Pacific children’s immunisation coverage at the 8-month milestone fell from 85% and 92% in
April 2020 to 66% and 83% respectively in March 2021 (Figure 1). Consistent with the fall in coverage
across a number of primary series immunisation milestones for children, there had also been a fall of 20%
in the number of vaccines administered to children under 5 in 2020 compared to 2019 (Figure 4).
However, there was modest increase of 7% in the number of vaccines administered the first 3 months of
2021 compared the corresponding period in 2020.
Vaccine timeliness
A high proportion of the immunisation coverage gap is related to delays in getting timely vaccination as
per the immunisation schedule as opposed to outright refusal. For example, 21% more Maaori children
were up-to-date at the 8 month milestone as compared to the 6 month milestone (Table 21). Given that
there are no more vaccines on the schedule from 5 to 11 months, this 21% is straight catch-up. The delays
in vaccination result in lower uptake of time sensitive vaccines such as rotavirus vaccines where the
second dose needs to be given before the age of 25 weeks.
Health service contacts
The vast majority of children who did not meet the 8-month immunisation milestones had some contact
with the publicly funded health system. Out of a retrospective cohort of children born between 1st July
2019 and 31st July 2020 (13 month period), who were domiciled in CM in 2020 and did not meet the 8-
month immunisation milestone n=1,241: 83% were enrolled in a PHO (n=1,032), 72% had received a
community pharmaceutical dispensing (n=896), 59% had a general medical subsidy (GMS) claim (n=729),
and 15% had attended a hospital ED service (n=188) (Table 11).
Recommendation
Given the high level of health service coverage, health professionals should take the opportunity
to reinforce the vaccination messages at every service encounter.
The latest phone and address details from the last health service contact should be accessible to
support a recall or an outreach service as required.
1
Immunisation coverage report 12-month sourced from MOH “tier_1_stats_12_month_april-mar_202021”
https://www.health.govt.nz/our-work/preventative-health-wellness/immunisation/immunisation-
coverage/national-and-dhb-immunisation-data
Page 3 of 34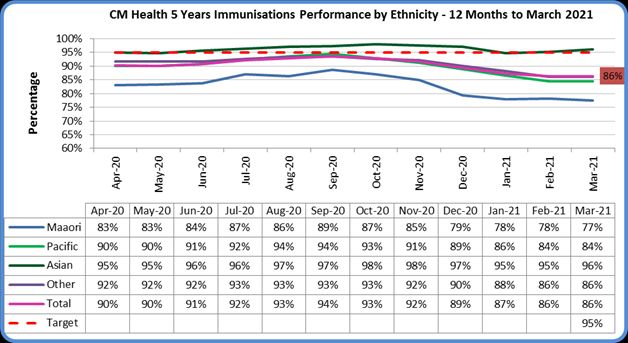
Every Well Child or health service contact should be used to optimise PHO enrolment and
reinforce the immunisation message in a customised way. For example, using recent publicly-
funded health service contacts could provide a much more targeted approach in optimising PHO
enrolment coverage for the whole of population (including women of reproductive age).
Messages and processes to support PHO enrolment and immunisation can be further reinforced
during the antenatal period.
Consistent messages regarding immunisation should be delivered by lead maternity carers and
Well Child providers particularly for births that occur outside the publicly-funded hospital
A look-up system to check and update eligibility of publicly funded health service that is accessible
at point of care, without needing a person to prove eligibility on multiple occasions and in
different settings would improve people’s experience with publicly funded service.
PHO enrolment
PHO enrolment is strongly associated with immunisation coverage (Table 16). In particular, early PHO
enrolment before 7 weeks (Table 30) and PHO enrolment with no subsequent enrolment gaps are strongly
associated with better immunisation coverage (Table 28). Only 18% of CM children enrolled in a PHO in
the first week of life (Table 30). However, about 10% of children who enrolled in a PHO before 7 weeks
were subsequently disenrolled. Maaori (16%) and Pacific (13%) children had higher subsequent
disenrollment rates (Table 33). This finding is mostly likely because the requisite forms had not been
completed by the 12-week point. These PHO enrolment gaps are strongly associated with poorer
immunisation coverage (Table 31). Other factors identified with higher immunisation coverage include
being born in a publicly-funded hospital2, or having a prior hospitalisation event (Table 15). Not being born
in a publicly-funded hospital in New Zealand is associated with poorer PHO enrolment rates (Table 18).
This group may include children who were born overseas, and/or born at home, or a privately funded
facility in New Zealand.
Of the 1,241 children who did not meet the 8-month immunisation milestone, 209 (17%) were not
enrolled in a PHO. However, 90% of these children not enrolled in a PHO had other health service
activities as recorded by the MOH datasets (Table 12) suggesting there was one or more potential
immunisation opportunities. Of note, Maaori and Pacific children had a higher activity rate at 98%, and
93% respectively.
Recommendation
The automatic PHO enrolment system at birth should be implemented and supported by lead
maternity carers.
Establish IT systems to support PHO enrolment at various points of care from a range of health
service providers to further optimise PHO enrolment coverage.
The processes of PHO enrolment at birth need to be timely and good quality to limit subsequent
PHO enrolment gaps. Business rules in relation in the temporary PHO enrolment of the new-born
children in New Zealand should be fine-tuned to support this.
The grace period of the preliminary PHO enrolment for the new-born could be lengthened, with
automatic validation of eligibility.
Automatic alerts to be set up so that if a non-PHO enrolled person is required to pay a higher co-
payment fee then a targeted approach to enrolment occurs. Business rules could be more person-
centric e.g. consider if a child is not yet enrolled, attended a GP clinic more than two times, a
business rule mandates compulsory enrolment?
2
As recorded in the NMDS, effectively excluding home births, new arrivals from overseas, or births in privately
funded hospital not reporting to the MOH hospital records.
Page 4 of 34 Specific barriers to access primary health care in the context of Covid-19 era should be addressed,
e.g. children being excluded from attending vaccination appointment if a child has respiratory
symptoms. In addition, work should be undertaken with primary care to address some of the
specific concerns raised from prior qualitative interviews and published reports, e.g. some clinics
do not make people feel welcome in attending.
Outreach Immunisation service
The number of vaccines administered by the Outreach Immunisation Service, (OIS, Plunket) fell by 39%
from 6,245 in 2019 to 3,903 in 2020 (Figure 5). For children who were referred to the OIS services, primary
care delivered more vaccines to those children than the OIS service (Table 7). Overall, OIS administered
about 3.7% of total number of vaccines for CM children under 5 in 2020, and accounted for about 12.9%
of vaccinations for Maaori and 4.4% for Pacific children (Table 4). Kidz First hospital provided about 1.0%
of total vaccinations volumes for CMDHB children under 5, and accounted for about 2.1% of Maaori and
1.4% of Pacific child vaccinations in 2020.
Recommendation
1. Given the high PHO enrolment and high level of primary health care contacts in the first year
of life, optimising vaccination delivery by primary health care is likely to be the most
sustainable option in providing a comprehensive set of health services required by a child
(including immunisation).
2. Interventions that aim to improve immunisation coverage should be child and whaanau
centric and consider the wider health needs of a child and family.
3. Active use of whole of system data, including the use of the most recently updated phone and
address details of a child may improve the reach and efficiency of an outreach service.
Page 5 of 34Contents
Summary and recommendations .................................................................................................................... 3
Coverage ...................................................................................................................................................... 3
Vaccine timeliness ....................................................................................................................................... 3
Health service contacts ............................................................................................................................... 3
PHO enrolment ............................................................................................................................................ 4
Outreach Immunisation service .................................................................................................................. 5
Introduction ..................................................................................................................................................... 7
Vaccination Coverage in CMDHB..................................................................................................................... 8
Vaccination activities: number of vaccines administered ......................................................................... 10
The impact of immunisation schedule changes on the number of vaccines and the number of discrete
immunisation episodes required before 5 years of age............................................................................ 11
Non-primary care providers of vaccinations: Outreach Immunisation Service (OIS) ............................... 12
Linking OIS referral data to NIR data ......................................................................................................... 14
Factors associated with meeting vaccination milestones ............................................................................. 17
Birth locations and prior hospitalisation ................................................................................................... 21
PHO enrolment status ............................................................................................................................... 22
Answering some key policy questions........................................................................................................... 23
Is poor immunisation coverage related to delays or outright refusal? ..................................................... 23
Delayed immunisation may lead to missing out on time-sensitive vaccines? .......................................... 28
Are there people in the NIR that may not be trackable? .......................................................................... 29
Is early PHO enrolment associated with better immunisation coverage and is PHO enrolment gap a
concern? .................................................................................................................................................... 30
Does PHO enrolment timelines and PHO enrolment vary by ethnicity? .................................................. 32
Page 6 of 34Introduction
Counties Manukau District Health Board (CMDHB) is recognised as having a young, socioeconomically
deprived and ethnically diverse population. Counties Manukau has a large birth cohort with approximately
8,000 births/year. The estimated resident population released by Stats NZ indicates the 0-4 year old
population in CM Health is made up of 23% Maori, 28% Pacific, 30% Asian, and 19% NZ European/Other,
with a high proportion of children living in decile 9 and 10. It is estimated that 57,400 children aged 0-14
years in CM Health live in decile 9 and 10 areas.
The current immunisation schedule is reasonably complex. In 2020, an additional vaccination event at 12
months was added to the schedule so that now vaccination events, for under 5 year olds are scheduled to
occur at 6 weeks, 3 months, 5 months, 12 months, 15 months and 4 years.
Table 1: New Zealand Immunisation Schedule from 1 October 2020
Age Diseases covered and vaccines
6 weeks Rotavirus (start first dose before 15 weeks)
Diphtheria/Tetanus/Pertussis/Polio/Hepatitis B/Haemophilus influenzae type b
Pneumococcal
3 months Rotavirus (second dose must be given before 25 weeks)
Diphtheria/Tetanus/Pertussis/Polio/Hepatitis B/Haemophilus influenzae type b
5 months Diphtheria/Tetanus/Pertussis/Polio/Hepatitis B/Haemophilus influenzae type b
Pneumococcal
12 months Measles/Mumps/Rubella
Pneumococcal
15 months Haemophilus influenzae type b
Measles/Mumps/Rubella
Varicella (Chickenpox)
4 years Diphtheria/Tetanus/Pertussis/Polio
Childhood vaccination coverage in Counties Manukau is currently well below the target of 95% for all
ethnic groups. There is particular concern regarding Maaori coverage with a large equity gap across all
milestone ages. The reasons for the decreasing vaccination coverage are multifactorial with systemic
issues such as socioeconomic factors, access issues, practice level factors, attitudes held about vaccination
by both health practitioners and caregivers, health literacy and now COVID-19, all playing a role.
The purpose of this report is to explore data currently available to help understand the opportunities for
action to increase childhood vaccination coverage in CM Health.
Page 7 of 34Vaccination Coverage in CMDHB
For the 12-month period to March 2021, 936 children had not met their 8 month immunisation milestone,
718 of them Maaori and Pacific (76%). CM Maaori and Pacific children’s immunisation coverage
significantly fell over the 12-months to March 2021 across all three of the commonly reported primary
series immunisation milestones. Over the same period, by comparison, Asian immunisation coverage in
CM remained consistently high.
CM Maaori and Pacific children’s immunisation coverage at 8 months of age fell from 85% and 92% in
April 2020, to 66% and 83% in March 2021 respectively (Figure 1). Over the same time period, there was a
modest fall of 1% in the New Zealand European and Other group, while Asian immunisation coverage
remained consistently high at 99%. Overall immunisation coverage for CM children at the 8 month
milestone fell from 92% in April 2020 to 86% in March 2021.
Figure 1: CM Health immunisation coverage at 8 month milestone by ethnicity – 12 months to March 2021
Data source: NIR, by Bede Oulaghan
Page 8 of 34At the 24 month milestone, CM Maaori immunisation coverage fell from 87% in April 2020 to 71% in
March 2021 (Figure 2). Pacific children fell from 94% to 81%. The New Zealand European and Other
groups fell from 94% to 89%. Asian immunisation coverage remained consistently high over the period of
a year at 97%.
Figure 2: CM Health immunisation coverage at 24 month milestone by ethnicity – 12 months to March 2021
At the 5 year milestone, CM Maaori immunisation coverage fell from 83% in April 2020 to 77% in March
2021 (Figure 3). Pacific children coverage fell from 90% to 84%. New Zealand European and Other groups
fell from 92% to 86%. Asian immunisation coverage remained consistently high over the period of a year
at 96%.
Figure 3: CM Health immunisation coverage at 5 year milestone by ethnicity – 12 months to March 2021
Page 9 of 34Vaccination activities: number of vaccines administered
Milestone indicators are relatively late indicators of vaccination activities as all the children have to reach
the milestone age of interest in order to be reported by the indicator. A direct count of all vaccinations
may provide more insights into recent trends.
Overall, there was about a 20% fall in the number of vaccinations administrated in 2020 compared to
2019 for children aged under 5 (Figure 4). In particular, there was a fall in vaccination activities in August
2020 associated with the level 3 lock down in the Auckland region. In the first 3 months of 2021, there was
an increase of 7% in the number of vaccines administered compared to the corresponding 3-month period
in 2020. However, there was only a 3% increase in number of vaccines administered for Maaori (and 7%
increase for Pacific children). The more recent increase in vaccination numbers is not yet fully reflected in
the milestone tables as those (who had received the more recent vaccinations) would not have reached
the milestone age cut off points.
Figure 4: Number of vaccinations for children under 5 in Counties Manukau by ethnicity from 2019 to 2020
Page 10 of 34The impact of immunisation schedule changes on the number of vaccines and the number
of discrete immunisation episodes required before 5 years of age
In 2020, there were two changes made in the NZ immunisation schedule. The pneumococcal vaccine is no
longer required at 3 months. For each child, the total doses of pneumococcal vaccines required has
reduced from four to three. However, the number of discrete immunisation episodes before age 5 has
increased from five to six, because both pneumococcal vaccine and MMR are now expected to be
administrated at 12 months (a new time slot). At 15 months, Haemophilus influenzae type b; varicella
vaccine and MMR vaccines are on the schedule and at 4 years the combo vaccine of diphtheria, tetanus,
acellular pertussis, polio is still expected to be given. In summary, immunisation is expected to occur at 6
weeks, 3 months, 5 months, 12 months, 15 months and 4 years.
Despite the expected increase of unique vaccination encounters required for each child in 2020, because
of the changes in the immunisation schedule, there was a fall in the number of unique vaccination
encounters in 2020 compared to 2019 by 16% (based on unique dates of vaccination for each child)3
(Table 2). Maaori had one of the highest drops (20%) in the number of unique vaccination encounters.
Table 2: Number of unique vaccination encounters (dates) for CM children aged between 0 and 4 from 2019 to 2020 (full year)
Year Maaori Pacific Indian Chinese Other NZ Euro Overall
Asian and others
2019 8,199 17,352 8,696 5,599 3,878 11,740 55,464
2020 6,540 14,972 7,888 4,369 3,435 9,548 46,752
% change -20% -14% -9% -22% -11% -19% -16%
However, more recent data for the first 3 months of 2021 suggested there had been an increase in the
number of unique vaccination encounters with Maaori and Pacific children in the first 3 months of 2021
(Table 3).
Table 3: Number of unique vaccination encounters (dates) for CM children aged between 0 and 4 in the first 3 month of the year
(Jan to March 2019 to 2021)
Year Maaori Pacific Indian Chinese Other NZ Euro Overall
Asian and others
2019 1,951 3,746 2,033 1,376 877 3,019 13,002
2020 1,575 3,493 1,914 936 820 2,242 10,980
2021 2,033 4,578 2,563 1,122 1,073 3,065 14,434
change in the first 3
months between 2020 29% 31% 34% 20% 31% 37% 31%
and 2021
3
As per the immunisation schedule, often there is a set of vaccines that are needed to be given at the same time,
e.g. at 6 weeks, “Rotavirus”, “Diphtheria/Tetanus/Pertussis/Polio/Hepatitis B/Haemophilus influenzae type b” and
“Pneumococcal” are often given at the same time, (as the same vaccination encounter).
Page 11 of 34Non-primary care providers of vaccinations: Outreach Immunisation Service (OIS)
Plunket is the largest provider of Outreach Immunisation Service (OIS) for CM. Papakura Marae, Southseas
and Raukura Hauora all have small OIS contracts but deliver very few vaccinations. There has been a drop
in vaccines administered by Plunket since late 2019, in particular noting a fall in vaccines given in April
2020, associated with level 4 lock down in Auckland and staffing issues related to outreach services.
Figure 5: Number of vaccinations for CM children under 5 administered by CMDHB Plunket OIS service
The OIS provided by Plunket administered about 3.1% of all vaccinations for CM children under 5 in the
first 3 months of 2021. This compares to 4.7% in whole year of 2019 and 3.7% in 2020. Overall, there was
a 39% fall in vaccination volumes from 6,245 in 2019 to 3,903 in 2020. The outreach service administered
10.1% of Maaori vaccinations in the first 3 months of 2021 and 4.1% of vaccinations for Pacific children.
Table 4: Percentage of vaccinations for CM children under 5 delivered by Plunket by ethnicity
NZ
Other
Year Maaori Pacific Indian Chinese European Overall
Asian
and other
2019 15.4% 5.8% 0.4% 0.2% 0.4% 1.2% 4.7%
2020 12.9% 4.4% 0.3% 0.1% 0.3% 1.0% 3.7%
2021 10.1% 4.1% 0.6% 0.1% 0.6% 0.7% 3.1%
Page 12 of 34Kidz First also provides vaccinations opportunistically, for young children while they are in hospital. In
addition to the primary series Kidz First also offered influenza vaccination in 2020 (but not in 2019 and not
yet in the first 3 months in 2021), which is included in these numbers. Their volumes are generally lower in
the summer months where hospitalisation rates are lower.4 Overall, Kidz First provides about 1.0% of the
total vaccinations volumes for CMDHB children under 5, and accounts for about 2.1% of Maaori and 1.4%
of Pacific children’s vaccination volumes in 2020.
Figure 6: number of vaccinations for CM children under 5 administered by Kidz first
4
In addition, 2020 saw a low rate of paediatric admissions due to a reduction of infectious disease. This has reversed
in 2021.
Page 13 of 34Linking OIS referral data to NIR data
The following analyses were undertaken by Bede Oulaghan (from the Health Intelligence & Informatics
team) matching OIS data with the NIR data and PHO enrolment data.5
For the 8 month cohort, there were 2,045 referrals made to OIS in 2020 for 1,981 unique individuals
(NHIs) as recorded as at 23rd March 2021. Referrals are predominately for Maaori and Pacific children
accounting for 92% of all referrals (Table 5).
Table 5: Number of referrals to OIS by ethnicity (as recorded by OIS service on a spreadsheet)
Ethnicity Number of referrals % of referrals
Maaori 1,008 49%
Pacific 682 33%
Asian 142 7%
Other 213 10%
Total Referrals 2,045
Out of the 2,045 referrals made to the OIS service, 38% were recorded as immunised as at 23rd March
2021. About 16% were either recorded as being not contactable or having moved out of Counties
Manukau health area. About 32% of referrals made in 2020 were still under the service of OIS as at 23rd
March 2021. Of note, even in this selected cohort only 6% outright declined immunisation.
Table 6: Outcomes of referrals to OIS in 2020 as recorded by OIS.
Number of % of
Outcome as recorded by OIS
referrals referrals
Immunised 786 38%
Unable to Contact/Non Responder 168 8%
Moved Out of CMH 154 8%
Declined Immunisations 130 6%
Declined OIS 148 7%
Deceased 3 0%
Still with OIS 656 32%
Total Referrals 2,045
5
Note”: there are a number of challenges with the linkage process and the quality of the OIS data submitted in a
spreadsheet. There may be value in setting up a more systematic and standardised way in better capturing the
relevant data to support service improvement and service delivery. The Health Intelligence team only has access to
the following 5 PHOs, Alliance Health Plus, East Health, National Hauora Coalition, ProCare and Total Healthcare.
People who are enrolled outside of these 5 PHOs will not be mapped.
Page 14 of 34The outcome of being “immunised” as recorded by OIS service, does not necessarily mean that all
immunisations were delivered by the OIS service. The actual immunisation may be administrated by
primary health care practice or by OIS. With linkage to the NIR based on a data extract on 20th April 2021,
Table 7 demonstrated for children who had been referred to the OIS service, majority of the vaccinations
were delivered by primary health care. This may or may not have been due to the efforts made by the OIS
service.
Table 7: Immunisation status and location of vaccinations for (“8 month”) children who were referred to the CM OIS service in
2020
6 weeks: DTaP-IPV- 3 Months: DTaP-IPV- 5 months:
HepB/Hib HepB/Hib DTaP-IPV-HepB/Hib
Immunisation status
and location of Number % Number % Number %
immunisation
Immunised 1,408 71% 1,256 63% 1,121 57%
58% 44% 28%
By GP practice 1,150 (82% of 875 (70% of 553 (49% of imms
imms total) imms total) total)
11% 18% 28%
By OIS (Plunket) 215 (15% of 362 (29% of 559 (50% of imms
imms total) imms total) total)
2% 1% 1%
By Kidz First/CM
43 (3% of imms 19 (1% of 9 (1% of imms
Health
total) imms total) total)
Declined 136 7% 162 8% 183 9%
Rescheduled 0 0% 7 0% 9 0%
No NIR record 437 22% 556 28% 668 34%
Total Unique NHIs 1,9816 1,981 1,981
6
For the 8 month cohort, there were 2,045 referrals made to OIS in 2020 for 1,981 unique individuals.
Page 15 of 34Table 8 and Table 9 describe the vaccinations received by 24 month and 4 year cohorts of children
referred to the OIS service in 2020. Noticeably, more vaccinations were delivered by primary health care
than by the OIS (Plunket) service for children who were referred to OIS. Therefore, the role of outreach
may include a co-ordination/ engagement role of immunisation services with or without actually
delivering the vaccination. The increased percentage of vaccinations undertaken by KIdz First at 4 years of
age is likely to represent the vaccinations done when the children attend a clinic for their B4S check,
rather than this occurring through the hospital.
Table 8: Immunisation status and location of vaccinations for (“24 month”) children who were referred to the CM OIS service in
2020
15 Month MMR / Hib
Immunisation status and location of
Number %
immunisation
Immunised 520 37%
By GP practice 23%
327
(63% of imms total)
By OIS (Plunket) 12%
175
(34% of imms total)
By Kidz First/CM Health 2%
18
(3% of imms total)
Declined 68 5%
Rescheduled 36 3%
No NIR record 787 56%
Total Unique NHIs 1,411
Table 9: immunisation status and location of vaccinations for (“4 year”) children who were referred to the CM OIS service in 2020
4 year DTaP-IPV 4 year MMR
Immunisation status and
Number % Number %
location of immunisation
Immunised 472 46% 415 40%
24% 25%
By GP practice 244 (52% of imms 258 (62% of imms
total) total)
7% 5%
By OIS (Plunket) 75 (16% of imms 59 (14% of imms
total) total)
15% 10%
By Kidz First/CM Health 153 (32% of imms 98 (24% of imms
total) total)
Declined 48 5% 38 4%
Rescheduled 6 0% 5 0%
No NIR record 503 49% 571 56%
Total Unique NHIs 1,029 1,029
Given that vast majority of children who did not meet immunisation milestones often have multiple other
health service contacts (Table 11), and based on the linkage work between OIS referral and NIR records of
vaccination suggest that significant proportions of children referred to OIS are often hard to track, there
may be a role to use the last contact details recorded from administrative records to enable better
tracking of children referred to the OIS.
Page 16 of 34Factors associated with meeting vaccination milestones
A retrospective cohort of children born between 1st July 2019 and 31st July 2020 (13-month period) was
selected to determine what factors are associated with higher vaccination coverage (at the 8 month
milestone mark). Children who had a date of birth between 1st July 2019 and 31st July 2020 as recorded
in one of the MOH datasets are included.7 This method aims to capture the children born outside of a
publicly funded hospital setting including children born overseas and subsequently had health service
utilisation. Consistent with the MOH immunisation reports, Maaori and Pacific children have lower
immunisation coverage compared to other ethnicities.
Table 10: % of CM children born between 1st July 2019 and 31st July 2020 with complete immunisation at 8 month milestone by
ethnicity (deaths excluded)
Other European/
Immunisation milestones Maaori Pacific Indian Chinese Overall
Asian Other
Incomplete at 8 months 498 407 60 24 31 221 1,241
Completed vaccinations
1,384 2,451 1,413 560 581 1,762 8,151
at 8 months
% Complete at 8 months 74% 86% 96% 96% 95% 89% 87%
Total 1,882 2,858 1,473 584 612 1,983 9,392
7
NMDS up to 28 Feb 2021, NNPAC up to 30 Sep 2020, PHO enrolment up to 28 Feb 2021, Pharms up to 31 Dec 2020,
NIR 31st March 2021, GMS 31 Dec 2020, lab 23 Dec 2020
Page 17 of 34Out of the 1,241 children who did not meet the 8 month immunisation milestone, 83% of them had
contact with a PHO, and 72% had received a pharmaceutical dispensing (Table 8). Furthermore, the
relatively high percentage of children who had GMS claims (59%) suggested that either there were PHO
enrolment gaps post-birth or children were commonly receiving primary care services outside the enrolled
practice, for example urgent care practices. Given the concerning proportion of children not meeting
immunisation milestones, but receiving other health services, suggests an opportunity for action. This
could range from directly checking immunisation status then and there, or at least making better use the
latest personal contact details from the more recent administrative health records. It does highlight the
potential value of reinforcing the core immunisation messages from a range of health service providers.
For the 12 month period to March 2021, 1,241 children within the selected cohort had not met their 8
month immunisation milestone, 905 of them Maaori and Pacific (79%). There were 209 children who did
not meet the 8-month immunisation milestone, and also were not enrolled in a PHO.
Table 11: Health service activities of CM children who did not meet the 8 month immunisation milestone (deaths excluded)
Other European/
Health service activities Maaori Pacific Indian Chinese Overall
Asian Other
Number of children with
Incomplete vaccinations 498 407 60 24 31 221 1,241
at 8 months
Contact with PHO 409 337 54 22 22 188 1,032
% Contact with PHO 82% 83% 90% 92% 71% 85% 83%
Had Pharms dispensing 364 309 47 18 17 141 896
% had pharms dispensing 73% 76% 78% 75% 55% 64% 72%
Had GMS claims 292 246 31 15 12 133 729
% had GMS claims 59% 60% 52% 63% 39% 60% 59%
Contact with Hospital ED
73 87 3 3 1 21 188
services
% had Hospital ED events 15% 21% 5% 13% 3% 10% 15%
Contact with secondary
64 60 5 1 0 34 164
outpatient services
% with secondary
13% 15% 8% 4% 0% 15% 13%
outpatient services
Page 18 of 34Out of the 209 children who did not meet the 8 month milestone, and not enrolled in a PHO, 90% had
other health service activities as recorded by the MOH datasets8 (Table 12). Of note, Maaori and Pacific
children had a higher coverage at 98%, and 93% respectively. Systems to look up PHO enrolment status
and support PHO enrolment would be of value at the point of care of each health service to further
optimise PHO enrolment coverage. Overall, there were 21 children with no footprint in MoH databases
which suggested these children might have moved overseas.
Table 12: Number of types of health service received by CM children who did not meet 8 month milestone, and not enrolled in a
PHO
Number of health service Maaori Pacific Indian Chinese Other European/ Overall
types received Asian Other
0 2 5 1 1 3 9 21
1 42 35 3 1 1 7 89
2 15 14 2 4 11 46
3 24 12 1 4 41
4 6 2 1 9
5 2 1 3
% had at least one health
service activity recorded 98% 93% 83% 50% 67% 73% 90%
in MOH datasets
Total 89 70 6 2 9 33 209
8
Health service activities include: GMS claims, hospital based ED events, outpatient events as recorded by NNPAC,
pharmaceutical dispensing, and inpatient events.
Page 19 of 34The majority of children (70%) who did not meet the 8-month immunisation milestone, and were not
enrolled in a PHO, had a birth event in hospital (Table 13). This supports the potential value of automatic
PHO enrolment at birth if the system was to work well. Just under half of the children (42%) had received
at least one pharmaceutical dispensing and 40% generated GMS claims (i.e. attendance at a general
practice). The non-PHO enrolment status would often be noted in these settings since these health service
events are generally charged at a higher rate of patients’ co-payment. Given the high percentage of
children in this subgroup had a range of health service use, there may be value in using the latest contact
details from the prior record to enable better reach of the outreach service.
Table 13: Type of other health services received by children who did not meet the 8 month immunisation milestone, and were not
enrolled in a PHO.
Type of health service Maaori Pacific Indian Chinese Other European/ Overall
received Asian Other
Had pharms dispensing 42 28 2 3 12 87
% had pharms dispensing 47% 40% 33% 0% 33% 36% 42%
Inpatient events (not
12 9 6 27
related to birth)
% had inpatient events 13% 13% 0% 0% 0% 18% 13%
Hospital birth events 76 50 3 6 11 146
% had birth in hospital 85% 71% 50% 0% 67% 33% 70%
GMS claims 34 27 2 1 3 16 83
% had GMS claims 38% 39% 33% 50% 33% 48% 40%
ED 5 9 3 17
% had ED admission 6% 13% 0% 0% 0% 9% 8%
Outpatients (NNPAC
6 2 5 13
non-ED events)
% had outpatient events 7% 3% 0% 0% 0% 15% 6%
Total 89 70 6 2 9 33 209
Page 20 of 34Birth locations and prior hospitalisation
There were 9,448 children with a date of birth between 1st July 2019 and 31st July 2020 domiciled in
Counties Manukau (based on last health service contact).9 7% of the children were not born in a hospital
as recorded in the NMDS. The 7% out of hospital births may include home births, people who were born
overseas, or born in privately funded facilities not (yet) submitting data to the NMDS10.
Table 14: Number of children with a date of birth between 1st July 2019 and 31st July 2020 by DHB, and by birth location, and by
prior hospital event11
Total births % with no
% of births
No prior Had a NMDS in the 13- prior
not at a
NMDS event event month hospital
hospital
DHB of domicile period event
011 Northland 243 2,458 2,701 9% 13%
021 Waitemata 602 7,889 8,491 7% 9%
022 Auckland 485 5,459 5,944 8% 10%
023 Counties Manukau 462 8,986 9,448 5% 7%
031 Waikato 802 5,446 6,248 13% 18%
042 Lakes 111 1,588 1,699 7% 9%
047 Bay of Plenty 370 3,229 3,599 10% 14%
051 Tairawhiti 44 717 761 6% 7%
061 Taranaki 120 1,503 1,623 7% 11%
071 Hawkes Bay 179 2,137 2,316 8% 12%
081 MidCentral 203 2,259 2,462 8% 11%
082 Whanganui 62 892 954 6% 9%
091 Capital & Coast 222 3,285 3,507 6% 8%
092 Hutt 139 2,095 2,234 6% 9%
093 Wairarapa 59 569 628 9% 13%
101 Nelson Marlborough 110 1,559 1,669 7% 15%
111 West Coast 43 329 372 12% 19%
120 Canterbury 470 6,631 7,101 7% 12%
123 South Canterbury 42 631 673 6% 7%
160 Southern 287 3,525 3,812 8% 12%
New Zealand overall 5,055 61,187 66,242 8% 11%
9
56 children had died by the end of the 2020. The 9,448 would also include the children who were born overseas
(during the 13 month period of interest).
10
Some facilities seem to take a year or more to submit data to the NMDS
11
Deaths not excluded.
Page 21 of 34Either prior hospitalisation, or birth in a hospital are associated with better immunisation coverage at 8
months. Out of the children who were born in hospital, 88% had completed set of vaccination as per the
8-month milestone. Children who were not born in hospital and did not have prior hospitalisation had a
much lower vaccination completion at 54% (Table 15).
Table 15: vaccination completion rates at 8 month milestone of CM children born between 1st July 2019 and 31st July 2020 by
prior hospitalisation status
Completed
Incomplete at 8 Number of
Prior hospitalisation status vaccinations at 8
months children
months
Not born in hospital and
not had prior 46% 54% 462
hospitalisation
Not born in hospital but
27% 73% 206
had prior hospital event
Born in Hospital 12% 88% 8,780
Overall 14% 86% 9,448
PHO enrolment status
Children who are not enrolled in a PHO are much less likely to have vaccination completed at 8 months
compared to children who are enrolled. However, only relatively small number of children 389 out of
9,448 (4%) were not enrolled in a PHO.
Table 16: vaccination completion rates at 8 month milestone of CM children born between 1st July 2019 and 31st July 2020 by PHO
enrolment status
Completed Number
Incomplete at 8
PHO enrolment vaccinations at 8 of
months
months children
No 64% (n=249) 36% (n=140) 389
Yes 12% 88% 9,059
Overall 14% 86% 9,448
Over 99% of children enrolled in a PHO are also enrolled on the NIR. However, non-PHO enrolment is
associated with lower NIR enrolment coverage.
Table 17: Association between PHO enrolment and NIR enrolment (CM children born between 1st July 2019 and 31st July 2020)
Number
PHO enrolment Not enrolled in NIR Enrolled in NIR of
children
No 17% (n=66) 83% (n=323) 389
Yes 0.7% 99.3% 9,059
Overall 1.4% 98.6% 9,448
Page 22 of 34Children who are not born in hospital, as recorded in the NMDS, were also less likely to be enrolled in a
PHO. This group may include children who were born overseas, and/or did not have a validated
immunisation record, or children born at home or in a privately-funded facility.
Table 18: Association between PHO enrolment status and location of birth (CM children born between 1st July 2019 and 31st July
2020)
Number
Born in Hospital PHO enrolled Not PHO enrolled of
children
No 88% 12% 668
Yes 97% 3% 8,780
Overall 96% 4% 9,448
Answering some key policy questions
Is poor immunisation coverage related to delays or outright refusal?
Out of the retrospective cohort of children born between 1st July 2019 and 31st July 2020 in New Zealand
(13-month period), 76% overall met the 6 month immunisation milestone (Table 19). However, Maaori
had considerably lower immunisation coverage at the 6 month milestone at 58% nationally, and only at
52% for Maaori children in CM.
Table 19: % of children born between 1st July 2019 and 31st July 2020 in New Zealand meeting the 6 month immunisation
milestone by ethnicity and by DHB
DHB of domicile Maaori Pacific Indian Chinese Other NZ Euro Overall
Asian and others
011 Northland 52% 66% 86% 92% 79% 69% 60%
021 Waitemata 59% 73% 91% 91% 89% 77% 79%
022 Auckland 63% 70% 91% 87% 89% 80% 79%
023 Counties Manukau 52% 71% 92% 91% 90% 78% 74%
031 Waikato 51% 67% 90% 90% 88% 75% 69%
042 Lakes 51% 73% 78% 94% 91% 78% 65%
047 Bay of Plenty 52% 70% 90% 85% 87% 75% 68%
051 Tairawhiti 53% 76% 94% 100% 89% 77% 63%
061 Taranaki 57% 68% 89% 86% 92% 77% 72%
071 Hawkes Bay 56% 75% 91% 100% 87% 80% 70%
081 MidCentral 59% 75% 88% 85% 89% 80% 74%
082 Whanganui 55% 77% 80% 86% 94% 82% 70%
091 Capital & Coast 69% 77% 87% 94% 89% 86% 83%
092 Hutt 70% 80% 89% 89% 89% 88% 82%
093 Wairarapa 72% 71% 100% 100% 100% 84% 81%
101 Nelson Marlborough 70% 73% 94% 90% 92% 82% 80%
111 West Coast 74% 88% 100% 100% 75% 72% 73%
120 Canterbury 73% 82% 91% 92% 91% 85% 84%
123 South Canterbury 73% 68% 86% 89% 79% 87% 84%
160 Southern 72% 84% 87% 82% 92% 86% 84%
New Zealand overall 58% 73% 90% 90% 89% 80% 76%
Page 23 of 34There is no additional vaccination required between 6 and 8 months of age as per New Zealand
immunisation schedule. Therefore, any improvement of coverage at the 8-month milestone mark is
related to children catching up with vaccinations prior to 6 months. While CM Maaori children’s
immunisation coverage remained relatively low at 73% (Table 20), there had been an improvement of
21% within the 2-month period (Table 21) suggesting that delay in getting vaccination in the timely
manner is one of the major factors of Maaori children not meeting the 6 month immunisation milestone.
The relatively low outright refusal to immunisation is also supported by the low New Zealand
immunisation decline rates at around 5%. Within the selected group CM children referred to outreach
services (Plunket), the decline rates ranged from 5 to 9%.
Table 20: % of children born between 1st July 2019 and 31st July 2020 in New Zealand meeting the 8 month immunisation
milestone by ethnicity and by DHB
DHB of domicile Maaori Pacific Indian Chinese Other NZ Euro Overall
Asian and others
011 Northland 78% 79% 96% 92% 90% 83% 81%
021 Waitemata 79% 88% 96% 96% 96% 87% 89%
022 Auckland 79% 85% 96% 93% 93% 87% 88%
023 Counties Manukau 73% 85% 95% 96% 95% 88% 86%
031 Waikato 75% 85% 95% 95% 94% 88% 85%
042 Lakes 69% 89% 83% 100% 94% 86% 78%
047 Bay of Plenty 74% 87% 96% 97% 91% 85% 82%
051 Tairawhiti 76% 86% 94% 100% 89% 85% 80%
061 Taranaki 74% 82% 95% 93% 94% 85% 83%
071 Hawkes Bay 84% 96% 97% 100% 96% 90% 89%
081 MidCentral 75% 85% 96% 89% 95% 88% 84%
082 Whanganui 73% 88% 80% 86% 94% 90% 82%
091 Capital & Coast 82% 88% 91% 97% 96% 92% 90%
092 Hutt 83% 87% 93% 96% 93% 94% 90%
093 Wairarapa 88% 79% 100% 100% 100% 89% 89%
101 Nelson Marlborough 85% 86% 96% 90% 93% 90% 89%
111 West Coast 82% 100% 100% 100% 92% 78% 80%
120 Canterbury 88% 93% 96% 94% 94% 92% 92%
123 South Canterbury 85% 76% 93% 100% 88% 94% 92%
160 Southern 86% 93% 94% 90% 97% 93% 92%
New Zealand overall 78% 87% 95% 95% 95% 89% 87%
Page 24 of 34Table 21: Absolute % improvement of immunisation between 6- and 8-months immunisation milestones of children born between
1st July 2019 and 31st July 2020 (13 month period) in New Zealand
DHB of domicile Maaori Pacific Indian Chinese Other NZ Euro Overall
Asian and others
011 Northland 26% 13% 10% 0% 10% 14% 20%
021 Waitemata 20% 15% 6% 4% 6% 10% 10%
022 Auckland 17% 15% 5% 6% 5% 7% 9%
023 Counties Manukau 21% 14% 4% 5% 5% 10% 12%
031 Waikato 24% 18% 5% 5% 6% 13% 16%
042 Lakes 18% 16% 5% 6% 3% 8% 13%
047 Bay of Plenty 22% 17% 6% 12% 4% 11% 15%
051 Tairawhiti 24% 10% 0% 0% 0% 8% 17%
061 Taranaki 17% 13% 7% 7% 2% 8% 11%
071 Hawkes Bay 28% 21% 5% 0% 10% 11% 18%
081 MidCentral 16% 10% 8% 4% 5% 8% 10%
082 Whanganui 18% 12% 0% 0% 0% 8% 12%
091 Capital & Coast 13% 11% 4% 3% 7% 6% 7%
092 Hutt 12% 8% 4% 8% 3% 6% 8%
093 Wairarapa 16% 7% 0% 0% 0% 5% 8%
101 Nelson Marlborough 15% 14% 2% 0% 1% 8% 9%
111 West Coast 9% 13% 0% 0% 17% 6% 7%
120 Canterbury 15% 12% 5% 1% 4% 7% 8%
123 South Canterbury 13% 8% 7% 11% 9% 7% 8%
160 Southern 13% 9% 6% 8% 5% 7% 8%
New Zealand overall 20% 14% 5% 5% 5% 9% 11%
Page 25 of 34Given the latest immunisation data is only up to 31st March 2021, in order to compare 6, 8 and 12 months
immunisation milestones, an older subgroup of children was selected, namely children born during the 9-
month period between 1 July 2019 and 31 Mar 2020. Given the fall in vaccination numbers in 2020
compared to 2019, this older cohort had experienced a period of higher immunisation activities in the
past compared to the children born more recently. The subgroup of children born during the 9-month
period between 1 July 2019 and 31 Mar 2020, had also seen an improvement in immunisation coverage
between the 6 month and 8 month milestones, particularly ethnic groups with low immunisation coverage
at 6 months (Table 22). For example, there was a 23% improvement in immunisation coverage for CM
Maaori between the 6 and 8 month milestones. However, the improvement of immunisation coverage is
more modest between 8 and 12 month milestones at only 3% for CM Maaori (Table 23).
Table 22: Absolute % improvement of immunisation between 6- and 8-months immunisation milestones of children born between
1 July 2019 and 31 Mar 2020 (9 month period) in New Zealand
DHB of domicile Maaori Pacific Indian Chinese Other NZ Euro Overall
Asian and others
011 Northland 25% 12% 11% 0% 12% 13% 19%
021 Waitemata 21% 15% 7% 5% 7% 10% 11%
022 Auckland 17% 16% 5% 7% 6% 7% 9%
023 Counties Manukau 23% 15% 4% 6% 6% 10% 13%
031 Waikato 25% 17% 5% 7% 6% 13% 16%
042 Lakes 17% 13% 7% 7% 4% 8% 13%
047 Bay of Plenty 23% 16% 8% 12% 3% 11% 15%
051 Tairawhiti 24% 13% 0% 0% 0% 8% 17%
061 Taranaki 20% 10% 10% 0% 3% 8% 11%
071 Hawkes Bay 27% 19% 6% 0% 12% 11% 18%
081 MidCentral 18% 12% 11% 5% 6% 9% 12%
082 Whanganui 19% 17% 0% 0% 0% 8% 13%
091 Capital & Coast 15% 11% 5% 4% 8% 6% 8%
092 Hutt 13% 7% 6% 10% 3% 7% 8%
093 Wairarapa 15% 0% 0% 0% 0% 6% 9%
101 Nelson Marlborough 16% 14% 3% 0% 2% 9% 10%
111 West Coast 10% 13% 0% - 25% 6% 8%
120 Canterbury 15% 12% 5% 1% 4% 8% 8%
123 South Canterbury 12% 0% 9% 0% 12% 8% 8%
160 Southern 13% 7% 7% 7% 6% 8% 9%
New Zealand overall 21% 14% 6% 5% 6% 9% 12%
Page 26 of 34Table 23: Absolute % improvement of immunisation between 8- and 12-months immunisation milestones of children born between
1 July 2019 and 31 Mar 2020 (9 month period) in New Zealand
DHB of domicile Maaori Pacific Indian Chinese Other NZ Euro Overall
Asian and others
011 Northland 2% 3% 0% 0% 2% 2% 2%
021 Waitemata 5% 3% 1% 1% 1% 2% 2%
022 Auckland 6% 2% 1% 1% 1% 2% 2%
023 Counties Manukau 3% 3% 1% 1% 0% 2% 2%
031 Waikato 5% 2% 1% 2% 1% 2% 3%
042 Lakes 8% 6% 0% 0% 4% 1% 5%
047 Bay of Plenty 5% 2% 0% 0% 0% 2% 3%
051 Tairawhiti 5% 7% 0% 0% 0% 1% 4%
061 Taranaki 5% 0% 7% 17% 3% 2% 3%
071 Hawkes Bay 3% 1% 0% 0% 2% 1% 2%
081 MidCentral 9% 2% 0% 0% 2% 2% 4%
082 Whanganui 6% 0% 0% 0% 0% 2% 4%
091 Capital & Coast 5% 4% 4% 1% 1% 1% 2%
092 Hutt 5% 1% 2% 0% 0% 0% 2%
093 Wairarapa 4% 11% 0% 0% 0% 1% 2%
101 Nelson Marlborough 4% 0% 0% 0% 3% 1% 2%
111 West Coast 8% 0% 0% - 0% 1% 2%
120 Canterbury 2% 0% 0% 1% 1% 1% 1%
123 South Canterbury 0% 23% 0% 0% 0% 0% 1%
160 Southern 3% 3% 2% 2% 1% 1% 1%
New Zealand overall 5% 3% 1% 1% 1% 1% 2%
Page 27 of 34Maaori children at 12 months continued to have the lowest immunisation coverage, with 84% of Maaori
children in New Zealand and 80% of CM Maaori children meeting their 12 milestone.
Table 24: % of children born between 1 July 2019 and 31 Mar 2020 in New Zealand meeting the 12 month immunisation milestone
by ethnicity and by DHB
DHB of domicile Maaori Pacific Indian Chinese Other NZ Euro Overall
Asian and others
011 Northland 81% 81% 93% 89% 90% 84% 83%
021 Waitemata 86% 91% 97% 97% 96% 90% 92%
022 Auckland 84% 89% 95% 94% 94% 89% 90%
023 Counties Manukau 80% 89% 95% 96% 94% 90% 89%
031 Waikato 81% 89% 95% 95% 96% 91% 88%
042 Lakes 78% 94% 77% 100% 98% 88% 83%
047 Bay of Plenty 82% 93% 96% 96% 89% 88% 86%
051 Tairawhiti 80% 87% 92% 100% 86% 84% 82%
061 Taranaki 81% 77% 100% 100% 97% 87% 86%
071 Hawkes Bay 87% 97% 95% 100% 96% 91% 90%
081 MidCentral 83% 90% 97% 89% 97% 91% 89%
082 Whanganui 82% 86% 77% 78% 92% 93% 87%
091 Capital & Coast 90% 94% 95% 97% 95% 94% 94%
092 Hutt 90% 89% 94% 96% 96% 95% 93%
093 Wairarapa 92% 89% 100% 100% 100% 91% 91%
101 Nelson Marlborough 91% 89% 94% 88% 95% 91% 91%
111 West Coast 92% 100% 100% - 100% 79% 83%
120 Canterbury 90% 94% 95% 94% 96% 93% 93%
123 South Canterbury 88% 85% 91% 100% 85% 94% 92%
160 Southern 89% 96% 93% 91% 99% 94% 93%
New Zealand overall 84% 90% 95% 95% 95% 91% 90%
Delayed immunisation may lead to missing out on time-sensitive vaccines?
Rotavirus is a time-sensitive vaccine. The first dose must be given before 15 weeks, and the second dose
must be given before 25 weeks. There is increased clinical risk of complication if rotavirus vaccine is given
beyond 25 weeks. Rotavirus vaccines are not included as part of the standard immunisation milestone
coverage calculations. Out of the children born between 1st July 2019 and 31st July 2020 in CM, 356 (4%)
had a “complete” 8 month immunisation milestone, but they did not complete the 2 doses of rotavirus
vaccine (Table 25).
Table 25: number of children born between 1st July 2019 and 31st July 2020 in CM by the number of doses of rotavirus vaccine
received and by the 8-month immunisation milestone status (deaths excluded)
Number of Rotavirus Incomplete at 8-month "Completed" vaccinations at
vaccine milestone 8-month milestone
0 686 135
1 307 221
2 245 7,744
3 2 51
4 1
Total 1,241 8,151
Page 28 of 34Only 72% of CM Maaori children had the 2 doses of rotavirus vaccines, the poor uptake of rotavirus
vaccines is certainly at least partly related to the timeliness of vaccinations.
Table 26: number of rotavirus vaccines received by CM children born between 1st July 2019 and 31st July 2020 by ethnicity
NZ Euro
Other
Number of Maaori Pacific Indian Chinese and Overall
Asian
Rotavirus vaccine others
None 312 240 22 19 24 204 821
One 219 164 47 9 11 78 528
Two or more 1,351 2,454 1,404 556 577 1,701 8,043
% had 1 rotavirus
12% 6% 3% 2% 2% 4% 6%
vaccine
% had 2 or more
72% 86% 95% 95% 94% 86% 86%
rotavirus vaccines
Total 1,882 2,858 1,473 584 612 1,983 9,392
Are there people in the NIR that may not be trackable?
Young children particularly new born babies often have a high need for health service use. A complete
lack of a health service footprint may suggest a child is no longer in New Zealand. Matching children
enrolled in the NIR against health service activities as recorded by the Ministry of Health datasets may
provide an estimate of the proportion of children in the NIR who may no longer be in New Zealand and
who are falsely inflating the incomplete vaccination percentages. About 161 (1.7%) of the CM children
born between 1st July 2019 and 31st July 2020 had no evidence of any health service activity12 (excluding
the initial birth event) and were non-enrolled in a PHO in March 2021. On the other hand, there were 75
children (0.8%) who had health service activity that suggested they live in the CM area, but were not yet
enrolled in the NIR or enrolled in a PHO as at March 2021. Therefore, there is scope to have a targeted
approach by using contact details from the administrative data to inform outreach services.
Table 27: NIR enrolment status of CM children born between 1st July 2019 and 31st July 2020 by HSU activity
HSU activity Not NIR enrolled NIR enrolled Total
No HSU activity 32 161 193
HSU activity 75 9,124 9,199
Total 107 9,285 9,392
12
Health service activity includes inpatient events (other than the index birth event), outpatient events, ED
attendance, community lab claims, community pharmaceutical dispensing, GMS claims.
Page 29 of 34Is early PHO enrolment associated with better immunisation coverage and is PHO
enrolment gap a concern?
Not being enrolled in a PHO is strongly associated with poor immunisation coverage. Early PHO enrolment
is associated with better immunisation coverage only if there is no subsequent PHO enrolment gap.
Children who became disenrolled from a PHO after an initial enrolment are more likely to have poor
immunisation coverage. The subsequent enrolment gap associated with early enrolment is related to the
preliminary enrolment process for newborns. If a completed and signed enrolment form is not submitted
by 12 weeks from birth then the preliminary enrolment will lapse and be removed from the National
Enrolment System (PHO enrolment). The 3 year grace period of PHO enrolment does not apply the
preliminary enrolment of the newborns. For those children who were enrolled with a preliminary status,
primary health care is expected to “pre-calling the newborn at four or five weeks of age for a six week
immunisation appointment and a general health and physical assessment; and recalling the newborn if
she/he did not attend for their six week immunisation and a general health and physical assessment.”13
Table 28 shows the presence and duration of enrolment gaps after initial enrolment is associated with
lower immunisation coverage at the 8-month milestone.
Table 28: Immunisation coverage at 8 month milestone of CM children born between 1st July 2019 and 31st July 2020 by the
degree of PHO enrolment gap
Completed % with completed
PHO enrolment Incomplete at 8
vaccinations at 8 Number of children vaccinations at 8
gap (in weeks) months
months months
No gap 742 7,434 8,176 91%
1 26 166 192 86%
2 30 162 192 84%
3 20 35 55 64%
4 30 33 63 52%
5 18 28 46 61%
6 22 24 46 52%
7 25 15 40 38%
8 22 16 38 42%
9 15 12 27 44%
10 18 13 31 42%
11 16 18 34 53%
12 12 14 26 54%
13 7 7 14 50%
14 8 11 19 58%
15 8 5 13 38%
16 3 6 9 67%
17 10 13 23 57%
Not enrolled in
209 139 348 40%
PHO
Total 1,241 8,151 9,392 87%
13
https://tas.health.nz/assets/Primary-psaap-u14/Enrolment-Requirements-for-Contracted-Providers-and-PHOs-
Version-4.1.pdf Page 11
Page 30 of 34Out of the 868 children with PHO enrolment gaps, 780 (90%) had other health service activities to suggest
that these children exist and had interacted with other part of the health system. About 65% (n=562) had
general medical subsidy (GMS) activity, and 84% had community pharmaceutical dispensing.
Table 29: Health service activities of the 868 children with PHO enrolment gaps
Service contacts HSU activity GMS activity Pharms dispensing
No 88 306 139
Yes 780 562 729
Total number of
children with PHO 868 868 868
enrolment gap
Out of the children who are enrolled in a PHO with no subsequent enrolment gaps, timeliness of PHO
enrolment is associated with vaccination completeness at 8 months (Table 30). This is particularly
important given the first sets of vaccinations are expected to be delivered at 6 weeks of age. In particular,
if PHO enrolment occurred after 7 weeks, a lower immunisation coverage at 8 months is noted. It is worth
noting that an additional 20% of children are enrolled at the week after 6 weeks of birth. Therefore,
reporting PHO enrolment rate before a child turns 7 weeks may be a more pragmatic way to report PHO
enrolment rates for children.14
However, timeliness of enrolment must be matched with the approaches that limit enrolment gaps. For
children enrolment before 7 weeks of birth with subsequent PHO enrolment gaps, is associated with poor
immunisation completeness at the 8-month milestone (only 68% of these children at completed
vaccination at 8 months).
Table 30: Immunisation coverage at 8 month milestone of CM children born between 1st July 2019 and 31st July 2020 enrolled in a
PHO without PHO enrolment gap by the age (in weeks) of first PHO enrolment
Number with Number of children Accumulated % of
Age in weeks % with completed
completed enrolled with no children enrolled
of first PHO vaccinations at 8
vaccinations at 8 subsequent by the defined
enrolment months
months enrolment gaps week
0 1,376 1,478 93% 18%
1 1,232 1,336 92% 34%
2 689 747 92% 44%
3 509 552 92% 50%
4 428 452 95% 56%
5 539 565 95% 63%
6 1,595 1,665 96% 83%
7 328 369 89% 88%
8 110 138 80% 89%
9 or more 628 874 72% 100%
Grand Total 7,434 8,176 91%
14
MOH reports PHO enrolment at the time of 6 weeks of birth (not at end of 6 weeks).
Page 31 of 34Does PHO enrolment timelines and PHO enrolment vary by ethnicity?
While overall PHO enrolment (at some point) is reasonably high at 97% for CM children (born between 1st
July 2019 and 31st July 2020 and having had some health service activities), the continuity of PHO
enrolment varies by ethnicity (Table 31). CM Maaori children have the highest PHO non-enrolment rate at
5%. Furthermore, for those children who were enrolled at some point, CM Maaori (12%) and Pacific (11%)
children are more likely to have subsequent gaps in PHO enrolment. This compares to only 5% in NZ
European children and 4% in Chinese children.
Table 31: PHO enrolment status and PHO enrolment gaps of CM children born between 1st July 2019 and 31st July 2020 and had
some other health service activity
NZ Euro
Other
Description Maaori Pacific Indian Chinese and Overall
Asian
others
Number of
children with HSU 1,804 2,793 1,463 582 604 1,953 9,199
activity
Enrolment in PHO
with no 83% 87% 92% 93% 94% 92% 89%
enrolment gap
Enrolled in PHO
at some point but
12% 11% 7% 4% 4% 5% 8%
with subsequent
enrolment gap
Not enrolled in a
5% 2% 1% 3% 2% 2% 3%
PHO at any point
Enrolled in PHO in
March 2021
(proxy of 91% 94% 97% 97% 97% 96% 95%
currently
enrolled)
Timeliness of PHO enrolment is important, and ideally this should occur as early as possible after birth to
optimise the benefit from subsided access to primary health care including opportunistic and proactive
care. As demonstrated by the analyses enrolment with a PHO before 7 weeks is associated with higher
immunisation rate at 8 months of age. Enrolment in both NIR and PHO would allow a proactive follow up
or reminders for children to receive their scheduled immunisation. However, timely enrolment should also
be of good quality and accuracy to avoid subsequent enrolment gaps.
Page 32 of 34Early PHO enrolment (before 6 weeks) is associated with subsequent enrolment gaps. A subgroup of
children born between 1st July 2019 and 31st July 2020 with evidence of other health service use and
being enrolled in a PHO at some point was analysed. While Maaori (20%) and Pacific (24%) new-borns in
CM are more likely to be enrolled in PHO in their first week of life compared to other ethnicities, they also
mostly likely to have PHO enrolment gaps (Table 32). For example, 5% of Maaori children born between
1st July 2019 and 31st July 2020 enrolled in their first week of life but had a subsequent enrolment gap.
7% of CM children enrolled in a PHO between 1 and 6 weeks had enrolment gaps.
Table 32: Percentages of CM children born between 1st July 2019 and 31st July 2020 by age of PHO enrolment (in weeks), and by
ethnicity and subsequent enrolment gaps15
Age of child of Maaori Pacific Indian Chinese Other NZ Euro Overall
first PHO Asian and
enrolment others
0 week 20% 24% 19% 12% 18% 17% 20%
1 to 6 weeks 55% 61% 70% 76% 72% 69% 65%
7 weeks 6% 4% 3% 3% 4% 4% 4%
8 weeks 2% 2% 1% 1% 1% 2% 2%
9 or more weeks 16% 10% 6% 8% 6% 9% 10%
Total number of 1,720 2,725 1,446 566 594 1,905 8,956
children
15
Percentages refer to the total number of children by ethnicity. Denominator refers to all children who had been
enrolled in a PHO, and had evidence of health service use.
Page 33 of 34You can also read