ASIAN-AMERICANS DIGITAL LIVES AND GROWING INFLUENCE - DIVERSE INTELLIGENCE SERIES | 2018 - EthniFacts
←
→
Page content transcription
If your browser does not render page correctly, please read the page content below

DIVERSE INTELLIGENCE SERIES | 2018

ASIAN-AMERICANS
DIGITAL LIVES AND GROWING INFLUENCE

                                        DIVERSE INTELLIGENCE SERIES | 2018
Copyright © 2018 The Nielsen Company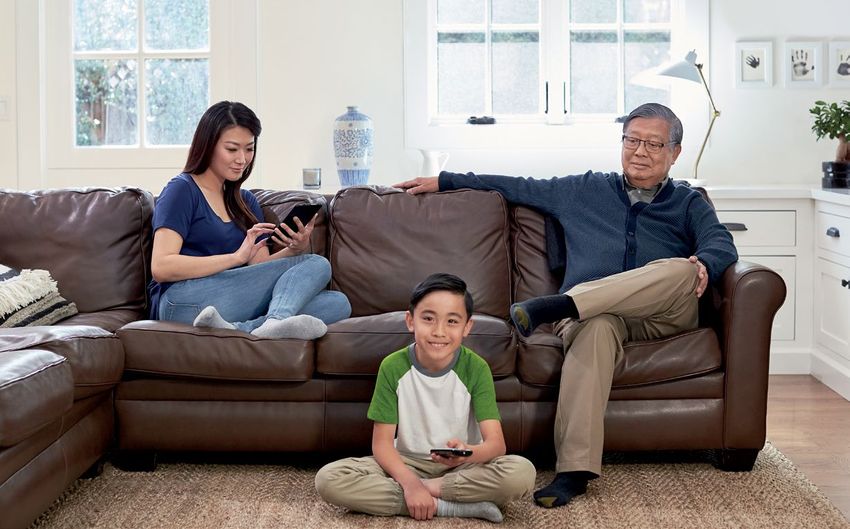
ASIAN-AMERICANS | DIGITAL LIVES AND GROWING INFLUENCE

                                  FOREWORD
                                  As we sit within striking distance of 2020, technology continues to disrupt every
                                  industry, but for Asian-Americans, this is an exciting time. They are embracing
                                  new apps, trying new devices, and creating content on new platforms. Thanks to
  Mariko S. Carpenter
                                  the democratization of media, Asian-Americans are making successful careers—
  Vice President, Strategic
  Community Alliances             building their own powerful brands—as social media influencers and content
                                  creators. Through their smartphones, tablets and multimedia devices, they have
                                  a real-time connection to people and culture in Asia, making Asian-Americans
                                  the true bridge between the East and the West.

                                  Asian-Americans are a consumer group whose buying power has grown
                                  the fastest of all racial groups since 2000, reaching $986 billion in 2017 and
                                  projected to be $1.3 trillion by 2022.* Asian-Americans are expanding their
                                  influence and voicing their preferences as customers, audiences and voters
                                  like never before. Thus, understanding Asian-Americans has become more
  Andrew McCaskill
  Senior Vice President,          important for any organization servicing the American public.
  Global Communications
  and Multicultural               Nielsen’s sixth report on Asian-American consumers, Asian-Americans: Digital
  Marketing
                                  Lives and Growing Influence, reveals an in-depth profile of this consumer group
                                  built on rich data compiled from multiple Nielsen verticals. For brands and
                                  marketers, this report will serve as the tool to connect with Asian-American
                                  consumers, gain their loyalty and grow the business.

                                  The report highlights Asian-American consumers as predictive adopters of new
                                  media and technology—which platforms consumers use to watch their favorite
                                  shows, what they buy online, and which apps they choose to enhance their
                                  everyday lives. Within this diverse group is also a strong and powerful Asian-
  Rebecca K. Roussell             American Millennial generation whose profile differs from their elders and from
  Senior Director,
                                  their non-Hispanic White Millennial counterparts. Asian-Americans are also
  Diverse Intelligence
  Series                          capturing the spotlight and becoming influencers as food bloggers, social media
                                  personalities, and sports stars.

                                  Today’s social and political environment has fueled Asian-Americans to
                                  galvanize towards having better representation and a stronger voice. Asian-
                                  American organizations across all sectors are gaining momentum, particularly
                                  those in the media industry. This is especially important given that what we
                                  see on TV and in film influences how we perceive the world to be. This report
                                  will empower Asian-American organizations with data that demonstrates their
                                  expanding influence.

                                  Nielsen has been a longtime champion of Diversity and Inclusion, ensuring that
                                  our work is reflective of the diverse communities that make up the U.S. market.
                                  We are proud to present this report in support of that commitment.

  *Source: Selig Center for Economic Growth, 2017

2
EXECUTIVE SUMMARY
                                  Growing faster than the general population and maintaining income
                                  and education rates higher than any other racial or ethnic group, Asian-
                                  Americans continue to make gains as tech-enabled influencers with unlimited
                                  potential. Asian-Americans have the added advantage of maintaining
                                  ties with brands based in their native countries that are global leaders
                                  in smartphone manufacturing, social media and online commerce. They
                                  outpace non-Hispanic Whites in ownership of the latest digital devices and
                                  are also more likely to use their digital devices. They are early adopters and
                                  are loyal to the brands they deem perform well. Asian-Americans are also
                                  more likely to use their digital devices to purchase products online, listen
                                  to music and radio, watch TV or movies and carry out other daily lifestyle
                                  functions. With Asian-Americans’ confidence and economic standing poised
                                  to gain even more traction, companies and brands will be wise to heed the
                                  needs and aspirations of these trending, tech-savvy consumers.

                                  Thriving and Diverse. Representing a plethora of ethnic and cultural
                                  traditions, Asian-Americans differ greatly from each other, not only along
                                  lines of ancestral background, nativity and language, but also by economic
                                  status and generation. Asian-American Millennials ages 18 to 34 are very
                                  different from their 35 and older counterparts. The differences are deeper
                                  than just generational. The mindset and backgrounds of younger U.S.-born
                                  versus older foreign-born is also a factor.

                                  Ascendant Ambiculturals.* Millennial Asian-Americans are spearheading a
                                  generational shift toward an increasingly intercultural American mainstream.
                                  Younger Asian-Americans are more likely than their 35 and over elders to
                                  speak English well (92% vs. 73%), and speak English at home (37% vs. 24%).
                                  Asian-Americans 18-34 are also more likely than their older cohorts to be
                                  U.S. born (45% vs. 17%) and identify themselves as being of more than one
                                  race (17% vs. 9%), which will only fuel their propensity to fearlessly explore
                                  and celebrate new hybrids and manifestations of their evolving American and
                                  Asian identities.

                                  An Economic Jolt. Previously, from 2000 through 2017, Asian-American
                                  buying power increased 257%, exceeding the increases in buying power for
                                  all other racial and ethnic groups. Today, Asian-American buying power is
                                  $986 billion and is projected to reach $1.3 trillion in 2022 (a 7% increase).
                                  In addition, the most recent Consumer Expenditure Survey (2015-2016),
                                  indicated that Asian-American households, overall, spent more than the
                                  average U.S. household, reflecting their higher mean household incomes.

*Note: Ambicultural(s) is a registered service mark of EthniFac ts, LLC, and is used with their permission.

Copyright © 2018 The Nielsen Company                                                                               3
ASIAN-AMERICANS | DIGITAL LIVES AND GROWING INFLUENCE

                                Mobile Motivators. Smartphones and other mobile devices are core to
                                the Asian-American lifestyle and identity. Thirty-three percent of Asian-
                                Americans agree that their cell phone is an extension of their personality
                                (over-indexing by 38% to non-Hispanic Whites) and 73% agree text messaging
                                is an important part of their daily life (over-indexing by 17% to non-Hispanic
                                Whites). Asian-Americans also are 68% more likely to use a computer or a
                                smartphone, which further exemplifies their influential digital voice.

                                Globally Connected. Asian-Americans have affinity for apps and
                                communication platforms that allow them to stay in touch with friends and
                                relatives in Asian countries (and elsewhere), where advanced digital devices
                                and tech-driven services have been integrated into many aspects of everyday
                                life for decades. Asian-Americans have three times the active reach for Skype
                                than do non-Hispanic Whites and more than four times the active reach
                                for WhatsApp. Additionally, Asian-Americans use Internet sites and search
                                engines that reflect strong ties to their country of origin or ancestry, including
                                foreign-based shopping, news, music, search and social media platforms
                                such as Sina, WeChat and Baidu from China, Hotstar and The Indian Express
                                from India, Bayan Mall from the Philippines, and Alikpop, which is Korean
                                from the U.S.

                                Millennial Mastery of Online Shopping. Millennial Asian-Americans are
                                particularly avid online shoppers and over-index their non-Hispanic White
                                counterparts on purchasing in many categories. Computer hardware and
                                software, airline tickets and consumer electronics are the categories where
                                Asian-American Millennials over-index non-Hispanic White Millennials
                                the most (by 63%, 53% and 52%, respectively). Clothing/Accessories is the
                                most purchased Millennial Asian-American category with their purchases
                                outpacing their non-Hispanic White Millennial counterparts by 13%.

                                Growing Mainstream Influence. The presence of Asian-Americans on TV
                                and other digital media platforms has increased. Of the top 10 broadcast
                                network TV shows preferred by Asian-Americans, two of them (ABC’s “The
                                Good Doctor” and CBS’ “The Big Bang Theory”) have Asian-Americans in
                                leading roles. Based on N-Score data, Nielsen’s celebrity marketability
                                measurement service, Asian-American actors, actresses, and social media
                                influencers resonate with the general population. In a reflection of the
                                increasing diversity and intercultural attitudes of young Americans,
                                celebrities who launched on YouTube like Michelle Phan, Ryan Higa, Lilly
                                Singh, and Freddie Wong all exceed the norm in likability, dependability,
                                being a good role model, and social media savvy.

4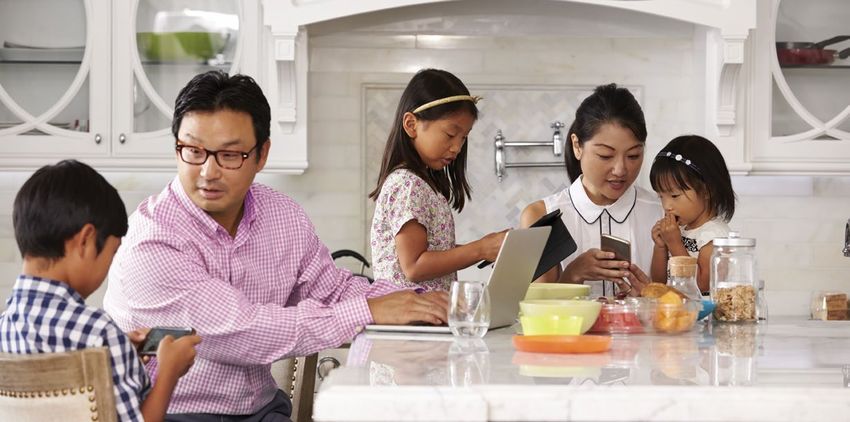
CONTENTS
                              SECTION I
                              ASIAN-AMERICAN ASCENDANCY:
                              THE NUMBERS TELL THE STORY ................................................ 7
                              Income and Education Leaders ........................................................................9
                              Potent Buying Power Growth ........................................................................ 10
                              The Unique Profile of Asian-American Households .................................... 12
                              The Shaping of a Strong and Powerful Millennial Generation ................... 13

                              SECTION II
                              ASIAN-AMERICANS ARE LEADERS
                              IN CONNECTED CONSUMPTION ................................................ 16
                              Asian-American Online Behaviors Are Defining the Future
                              Technology Bellwethers ..................................................................................17
                              Highest Device Ownership and Purchases ...................................................18
                              Early Adopters: Defining the Future of Devices and Technologies ............19
                              A Strong Mobile Connection .......................................................................... 20
                              Internet Is the Primary Source for Entertainment,
                              Services and Connection Source ................................................................... 21

                              Maintaining, Adapting and Adopting Online Connectivity in Daily Life
                              Maintaining Cultural Ties by Staying Connected ..........................................24
                              Smartphone Apps with the Highest Reach Among Asian-Americans ....... 25
                              Unparalleled Networking on Social Media ....................................................27
                              How to Reach Asian-Americans .................................................................... 28

                              Online Spending
                              Top Asian-American Millennial Online Purchasing Categories .................. 30
                              Growth in Online Dollars per Buyer ............................................................. 31
                              Non-Food Home Items Purchased Online ................................................... 32

                              TV Watching
                              Favorite Broadcast Network Programs ........................................................ 34
                              Favorite Cable Programs ............................................................................... 35

Copyright © 2018 The Nielsen Company                                                                                                        5
ASIAN-AMERICANS | DIGITAL LIVES AND GROWING INFLUENCE

                                SECTION III
                                ASIAN-AMERICANS CAPTURING THE SPOTLIGHT ................... 38
                                Pan-Asian Cuisine and Food Bloggers .......................................................... 39
                                Social Media Personalities ............................................................................. 41
                                Asian-American Olympic Preeminence ........................................................ 42
                                Avid Sports Fans ............................................................................................. 43

                                SECTION IV
                                REPRESENTATION MATTERS NOW MORE THAN EVER ............ 46
                                Asian-American Star Power ........................................................................... 47
                                The Path to Equality for Asian-Americans in Hollywood ............................ 48
                                Political Representation Is Imperative ......................................................... 49
                                The Challenge of Economic Disparities ........................................................ 50

                                CONCLUSION ............................................................................. 52
                                METHODOLOGIES ...................................................................... 53

                                EDITOR’S NOTE
                                For the purposes of this report, the term Asian-Americans includes Pacific
                                Islanders. The data is not segmented by ethnicity, unless stated otherwise.

                                Nielsen Measurements: Although the sample design is not controlled by
                                Asian language, we make significant efforts to accommodate non-English
                                speaking respondents, and as such, our Asian panelists include both
                                English and non-English language speaking populations.

6
SECTION I
                                       ASIAN-AMERICAN ASCENDANCY:
                                       THE NUMBERS TELL THE STORY

At Nielsen, data drives everything we do—even art. That’s why we used real data to create this image.
Copyright © 2018 The Nielsen Company                                                                    7
As their buying power increases and they outpace the U.S. general
    population in income, educational attainment and population growth,
    Asian-Americans represent a consumer group integral to any brand
    growth strategy.

        WITH A POPULATION OF 21.8 MILLION,
        ASIAN-AMERICANS CURRENTLY
        REPRESENT 7% OF THE TOTAL U.S.
        POPULATION.
    Since 2006 the Asian-American population has grown 43%, which is a
    more rapid growth than that of any other U.S. race or ethnicity. Much
    of that growth has come from immigration, which has been steadily
    increasing over the past decades. For instance, between 2011 and 2016,
    2.8 million Asian immigrants came to the U.S., representing 35% of the
    total U.S. immigration for that period.

8
INCOME AND EDUCATION
                              LEADERS
                              Asian-Americans have a mean income of $44,887, higher than their non-
                              Hispanic White counterparts ($37,863), according to the U.S. Census. On
                              measures of education, 52% of their population has at least a bachelor’s
                              degree, and 87% of their high school graduates enroll in college, making
                              Asian-Americans the most affluent and most educated of any U.S. race or
                              ethnicity. This higher relative income and education for Asian-Americans
                              holds true among immigrants as well; those Asian immigrants who
                              entered between 2011 and 2016, had a mean income of $31,308 and
                              62% held at least a bachelor’s degree. Additionally, although more than
                              half (56%) of total Asian-Americans are foreign born, 81% of all Asian-
                              Americans speak English well. The industry in which the largest number of
                              Asian-Americans are employed is the professional, scientific, technical and
                              management sector (14%), followed by health care (12%).

                               ASIAN-AMERICAN DEMOGRAPHIC COMPARISONS
                                                     ASIAN-AMERICAN           NON-HISPANIC WHITE            TOTAL U.S.

                MEAN AGE                                 35                            42                      38

                MEAN INCOME (AGES 18+)               $44,887                       $37,863                  $35,006

                COLLEGE ENROLLMENT
                OF HIGH SCHOOL
                GRADUATES (2014-2016)
                                                        87%                           72%                     72%
Source: U.S. Census American Community Survey 2016

Copyright © 2018 The Nielsen Company                                                                                     9
ASIAN-AMERICANS | DIGITAL LIVES AND GROWING INFLUENCE

                                POTENT BUYING POWER
                                GROWTH
                                Due to Asian-Americans’ strong immigration, relative youthfulness (with
                                an average age of 35), and higher educational attainment and income,
                                Asian-American buying power is expected to grow from its current $986
                                billion (representing 6.8% of the total U.S. buying power) to $1.3 trillion
                                (7.7%) in 2022. The 257% increase in Asian-American buying power from
                                2000 through 2017 exceeds the increases in buying power for all other
                                racial and ethnic groups.

                                  NATIONAL BUYING POWER GROWTH, 2000-2017

                                                                                                  257%
                                                                                    203%

                                                        97%               108%
                                   87%

                                  WHITE                 TOTAL         AFRICAN-    HISPANIC          ASIAN-
                                                         U.S.         AMERICAN                     AMERICAN
                               Source: Selig Center for Economic Growth, 2017

10
Asian-American spending is much more focused geographically than that
of the total U.S. consumer market. In 2017, California had the largest Asian-
American consumer market with $323 Billion, and the other 10 states with
the largest Asian-American consumer markets accounted for 75% of Asian-
American buying power.
LARGEST ASIAN-AMERICAN CONSUMER MARKETS
(BUYING POWER, IN BILLIONS)
WASHINGTON $39B
NEW YORK
$88B $26B MASSACHUSSETTS
CALIFORNIA
ILLINOIS $39B $57B NEW JERSEY
$323B $32B VIRGINA
$30B HAWAII
TEXAS $78B
$29B
FLORIDA
Source: Selig Center for Economic Growth, 2017
Copyright © 2018 The Nielsen Company 11ASIAN-AMERICANS | DIGITAL LIVES AND GROWING INFLUENCE
THE UNIQUE PROFILE OF ASIAN-
AMERICAN HOUSEHOLDS
The households of Asian-Americans look very different from other U.S.
households, particularly those of non-Hispanic Whites. Besides having a
higher household income ($110,523 vs. $86,221 for non-Hispanic White only
households), they are more likely to include a married couple (63% vs. 50%),
have children under 18 in the house (39% vs. 26%) and be multigenerational
(27% of individuals vs. 15.3%).* Asian-American households are also larger on
average than those of any other race or ethnicity (2.9 persons vs. 2.3 for non-
Hispanic White only) and less likely to be a non-family household where people
live alone or with others who are not family members (25% vs. 37%).
Asian-American households are the U.S. households most likely to have
internet (93%), and according to the most recent Consumer Expenditure
Study (2015-2016), they spent more money than the average U.S. household,
reflecting their higher mean household incomes.
ASIAN-AMERICAN HOUSEHOLD ANALYSIS
ASIAN-AMERICAN NON-HISPANIC WHITE TOTAL U.S.
HOUSEHOLDS HOUSEHOLDS HOUSEHOLDS
HOUSEHOLDS WITH
ACCESS TO THE INTERNET 93% 86% 85%
MEAN HOUSEHOLD SIZE 2.90 2.30 2.49
MEAN HOUSEHOLD INCOME $110,523 $86,221 $80,720
MEAN ANNUAL HOUSEHOLD
EXPENDITURE $61,400 $57,002 $53,510
Source: U.S. Census American Community Survey 2016
*Note: For the purposes of this report, multigenerational includes those living in households with three or more generations living together; children and their
grandparents living together, with or without the children’s parents; and adult children, age 25+ living with a parent. Based on EthniFacts analysis of 2016 ACS data.
12THE SHAPING OF A STRONG
AND POWERFUL MILLENNIAL
GENERATION
Thriving and ethnically diverse, Asian-Americans differ greatly from each
other, not only in terms of ancestral background and nativity, but also
by generation. The average age of Asian-Americans is 35 years. Those
ages 18 to 34, are very demographically different from their 35 and older
counterparts, and this younger generation is one of the main reasons
Asian-Americans are leaders in everything from technology usage and
media consumption, to e-commerce.
Copyright © 2018 The Nielsen Company 13ASIAN-AMERICANS | DIGITAL LIVES AND GROWING INFLUENCE
The primary differences between the generations pertain to nativity and
language. Forty-five percent of Asian-Americans ages 18 to 34 are U.S.-born,
compared with only 17% of those who are older. Consistent with that are the
differences in knowing and using the English language: 92% of 18-to 34-year-
old Asian-Americans speak English well or very well and 37% speak only
English at home, while only 73% of those 35 and older speak English well or
very well and 24% speak only English at home.
Another difference between the age groups involves race. Among 18-to
34-year-old Asian-Americans, 17% are multiracial, while only 9% of those
who are 35 and older are of two or more races. Perhaps reflecting their own
diversity, younger Asian-Americans are also more likely to enter into an
interracial marriage. Thirty-two percent of married 18-to-34-year-old Asian-
Americans are in an interracial marriage while 26% of those 35 and older are.
Education also differs greatly between the generations. Asian-Americans in
the 18-to-34 age group are much more likely to have at least a bachelor’s
degree (62%) than Asians 35 and older (48%). Additionally, 34% of Asian-
Americans ages 18 to 34 make $50,000 or higher in annual wages or self-
employment income, while, despite longer periods in the workforce, only
32% of ages 35 and older do.
AMBICULTURAL* ASIAN-AMERICAN MILLENNIALS
92%
SPEAK ENGLISH WELL 73%
37%
SPEAK ENGLISH AT HOME
24%
U.S.-BORN 45%
17%
BACHELOR’S DEGREE 62%
OR HIGHER 48%
4%
SELF-EMPLOYED
12%
IN AN INTERRACIAL 32%
MARRIAGE 26%
18-34
17% 35+
MULTIRACIAL 9%
Source: U.S. Census
*Note: Ambicultural(s) is a registered service mark of EthniFac ts, LLC, and is used with their permission.
14SECTION I TAKEAWAYS
Asian-Americans are integral to any brand’s growth strategy. Factors such
1 as the highest income, and the most rapid population and buying power
growth of any U.S. race or ethnicity, make Asian-Americans an important
consumer group to reach.
Asian-American households have higher household incomes, are larger in
2 size and are more likely to include a married couple, have children under 18
in the house, and be multigenerational than other U.S. households.
Asian-Americans differ greatly from each other, not only in terms of
3 ancestral background and nativity, but also by generation. Asian-American
Millennials, ages 18 to 34, are more likely than their 35 and older
counterparts to be U.S.-born, speak English, be in an interracial marriage, to
have a bachelor’s degree or higher and to make $50,000 or more annually.
Copyright © 2018 The Nielsen Company 15SECTION II
ASIAN-AMERICANS ARE
LEADERS IN CONNECTED
CONSUMPTION
16 At Nielsen, data drives everything we do—even art. That’s why we used real data to create this image.ASIAN-AMERICAN ONLINE
BEHAVIORS ARE DEFINING
THE FUTURE
TECHNOLOGY BELLWETHERS
Relative to the general population, Asian-Americans have a voracious
appetite for cutting-edge technology, making them attractive to marketers
building a digital customer base. Perhaps enabled by their higher average
income and educational achievement, or influenced by the fact that many
countries in Asia are technologically advanced, Asian-Americans are
extremely engaged with technology, typically over-indexing against their
non-Hispanic White peers. The success of Asian technology companies
like Samsung, Sony and LG is well documented. Sixty-seven percent of
Asian-Americans agree that they are fascinated by new technology (over-
67% OF ASIAN-
indexing against non-Hispanic Whites by 19%), and 62% enjoy reading
about new technology products (over-indexing by 21%). The majority
AMERICANS AGREE
(61%) of Asian-Americans also say they prefer products that offer the THAT THEY ARE
latest in new technology (over-indexing by 17%), and 35% agree that they
are among the first of their friends and colleagues to try new technology FASCINATED BY
products and that they like to have a lot of gadgets (over-indexing by 37%
and 26%, respectively).* NEW TECHNOLOGY.
* Source: Nielsen Scarborough USA+ 2017 Release 1, Reissue 09-18-2017, Total (Dec 2015 - Apr 2017); Base: Total Adults 18+ Projected: 249,644,942
Respondents: 207,374. Gfk/MRI Attitudinal Insights; Agree completely or somewhat.
Copyright © 2018 The Nielsen Company 17ASIAN-AMERICANS | DIGITAL LIVES AND GROWING INFLUENCE
ASIAN-AMERICAN HOUSEHOLDS
OVER-INDEX AGAINST
NON-HISPANIC WHITES BY:*
105% FOR VOIP
OWNERSHIP
66% FOR SMART
WATCHES
HIGHEST DEVICE OWNERSHIP AND PURCHASES 39% FOR STREAMING
ASIAN-AMERICANS ASSIDUOUSLY RESEARCH TECH PRODUCTS MEDIA PLAYERS
BEFORE BUYING THEM, AS WELL AS INFLUENCE OTHERS REGARDING
TECH PURCHASES. 18% FOR GAME CONSOLES
Asian-Americans take pride in finding the latest digital gadgets and
showing them off to friends and family. Asian-American households
over-index against non-Hispanic Whites by 105% for VoIP (Voice Over
17% FOR SMART TVS
Internet Protocols) ownership, 66% for smart watches, 39% for streaming
media players, 18% for game consoles, 17% for smart TVs, 16% for
smartphones, 13% for HD radios and 4% for computers.* One-third of 16% FOR SMARTPHONES
Asian-Americans (33%) agree that they want others to say “wow” when they
see their electronics (over-indexing non-Hispanic Whites by 44%), according
to Nielsen Scarborough. In addition, 70% agree that technology helps make 13% FOR HD RADIOS
their life more organized (over-indexing by 18%). These drivers are likely
just a couple of the reasons why the majority of Asian-Americans (66%) are
willing to pay more for top-quality electronics (over-indexing by 15%).*
4% FOR COMPUTERS
KNOWLEDGEABLE AND INFLUENTIAL BUYERS
BEFORE BUYING TECHNOLOGY OR ELECTRONICS, AFTER BUYING TECHNOLOGY OR ELECTRONICS,
ASIAN-AMERICANS: ASIAN-AMERICANS:
73% 72% 67% 61% 44% 44%
DO AS MUCH LIKE TO ENJOY LEARNING RECOMMEND GIVE ADVICE TO DISCUSS
RESEARCH AS READ REVIEWS ABOUT TECHNOLOGY IT TO PEOPLE OTHERS LOOKING TO THEIR KNOWLEDGE
POSSIBLE BEFORE BUYING OR ELECTRONIC THEY KNOW BUY TECHNOLOGY OF TECHNOLOGY
TECHNOLOGY OR PRODUCTS FROM OR ELECTRONICS OR ELECTRONIC
ELECTRONICS OTHERS PRODUCTS PRODUCTS WITH
OTHERS
* Source: Nielsen Scarborough USA+ 2017 Release 1, Reissue 09-18-2017, Total (Dec 2015 - Apr 2017); Base: Total Adults 18+ Projected: 249,644,942
Respondents: 207,374. Gfk/MRI Attitudinal Insights; Agree completely or somewhat.
18EARLY ADOPTERS: DEFINING THE FUTURE
OF MEDIA CONSUMPTION
Asian-Americans are becoming the earliest adopters of new ways of viewing
content, outpacing the total population with regard to penetration across
some of the newest technologies. Overall, Asian-Americans spend most of
their media time watching traditional TV (defined as including live television
usage plus any playback viewing, which is primarily on DVR) or using apps or
the internet on their smartphone. Asian-American Millennials (ages 18–34)
spend the majority of their digital time (51%)—and more time than Asian-
Americans of other generations—on apps and the internet on a smartphone.
They also spend more time than older Asian-Americans on watching video on
their smartphone and using game consoles.
Relative to one year earlier, all age groups of Asian-Americans are spending
less time on live and DVR TV. Additionally, total Asian-Americans
(ages 18+), as well as ages 18 to 34 are spending less time on internet on
a computer, and more time on other devices and uses such as multimedia
devices, video on a computer, video on a smartphone, apps
and web on a smartphone.
WEEKLY TIME ON DEVICE, BY AGE
ASIAN-AMERICANS 0:24 0:49
18+ 14:38 1:56 3:06 3:49 1:57 14:18
0:54
0:20 1:32
18-34 6:42 1:43 3:09 4:07 2:38 21:50
1:09
TOTAL U.S. 0:42 0:50
18+ 31:06 3:42 2:16 6:04 2:19 17:13
1:29
0:38 1:20
18-34 16:00 2:05 3:28 3:14 4:40 3:00 18:53
LIVE+DVR/TIME-SHIFTED TV DVR/TIME-SHIFTED TV DVD/BLU-RAY DEVICE GAME CONSOLE MULTIMEDIA DEVICE
INTERNET ON A COMPUTER VIDEO ON A COMPUTER APP/WEB ON A SMARTPHONE VIDEO ON SMARTPHONE
Source: Live + DVR/time-shifted TV, DVR/time-shifted TV, DVD/Blu-ray device, game consoles, multimedia devices 03/27/2017–06/25/2017 via Nielsen NPOWER/
National Panel, Radio 06/16/16–06/21/17 via RADAR 134, Computer 04/01/2017–06/25/2017 via Nielsen Netview and Nielsen VideoCensus, Mobile 04/01/2017–
06/25/2017 via Nielsen Electronic Mobile Measurement
Copyright © 2018 The Nielsen Company 19A STRONG MOBILE CONNECTION
Ninety-four percent of Asian-American households own a cell phone (as
compared to 86% of the total population), and 88% of Asian-Americans
agree that they carry their cell phone everywhere they go, a rate 7% higher
than for non-Hispanic Whites. Thirty-three percent of Asian-Americans
even agree that their cell phone is an extension of their personality (over-
indexing by 38%) and 73% agree that text messaging is an important part
of their daily life (over-indexing by 17%).* 94% OF ASIAN-
The majority (64%) of Asian-Americans think of their mobile phone as a
source of entertainment (over-indexing non-Hispanic Whites by 36%), with
AMERICAN
56% expecting the quality of video on their cell phone to be as good as HOUSEHOLDS
that on their TV (over-indexing by 23%). Sixty-one percent are interested in
watching video clips on their cell phone (over-indexing by 44%), and 33% OWN A CELL
are interested in watching live TV on it (over-indexing by 42%), indicating
that TV content is not what Asian-Americans are shifting away from. PHONE.
Rather, they want more mobile options for watching their favorite shows.
Some Asian-Americans (17%) would even be willing to pay a monthly
subscription fee to receive live TV on their cell phone, a rate 38% higher
than for non-Hispanic Whites. On the whole, though, 88% of Asian-
Americans agree that having one mobile device that can do everything is
very convenient (over-indexing by 11%).*
* Source: Nielsen Scarborough USA+ 2017 Release 1, Reissue 09-18-2017, Total (Dec 2015 - Apr 2017); Base: Total Adults 18+ Projected: 249,644,942
Respondents: 207,374. Gfk/MRI Attitudinal Insights; Agree completely or somewhat.
20INTERNET IS THE PRIMARY ENTERTAINMENT,
SERVICES AND CONNECTION SOURCE
Asian-Americans over-index by 31% against non-Hispanic Whites for
agreeing the internet is a main source of entertainment for them (68%
agree, up from 56% just four years earlier). They also over-index on every
form of online entertainment and over-index by 24% for agreeing that
going online is one of their favorite things to do with their free-time (66%
agreed, vs. 57% in 2013). Aside from watching video clips, movies, TV
shows and sports online, they also listen to music, play games and follow
podcasts online. Asian-Americans ages 18 to 34 also over-index for most
ways of using the Internet or apps, but they under-index against their
non-Hispanic White peers for playing fantasy football, downloading or
purchasing music and listening to an online music service.*
TOP WAYS INTERNET OR APPS WERE USED IN LAST 30 DAYS ON ANY DEVICE
ENTERTAINMENT
VIDEO CLIPS LISTEN TO ONLINE MUSIC SERVICE MOVIES
(YouTube, etc.) (Last.fm, Pandora, Spotify, etc.) (Watch or download)
58% 68% 48% 60% 48% 62%
138 109 133 93 183 127
GAMES WATCH TV PROGRAMS USING
(Play or download)
ONLINE SUBSCRIPTION SERVICE
ASIAN-AMERICAN 18+
ASIAN-AMERICAN 18-34
38% 48% 37% 46%
INDEX: ASIAN-AMERICAN/
NON-HISPANIC WHITE
111 101 152 101
Source: Nielsen Scarborough USA+ 2017 Release 1, Reissue 09-18-2017, Total (Dec 2015 - Apr 2017); Base: Total Adults 18+ Projected: 249,644,942
Respondents: 207,374
* Source: Nielsen Scarborough USA+ 2017 Release 1, Reissue 09-18-2017, Total (Dec 2015 - Apr 2017); Base: Total Adults 18+ Projected: 249,644,942
Respondents: 207,374. Gfk/MRI Attitudinal Insights; Agree completely or somewhat.
Copyright © 2018 The Nielsen Company 21ASIAN-AMERICANS | DIGITAL LIVES AND GROWING INFLUENCE
66% OF ASIAN-
AMERICANS Asian-Americans also are more likely than non-Hispanic Whites to use the
internet to stay connected: 66% of Asian-Americans agree they would feel
AGREE THEY disconnected without the internet (over-indexing by 24%), up from 60%
in 2013. Eighty-six percent of Asian-Americans agree that the internet is a
WOULD FEEL great way to communicate with family and friends (over-indexing by 7%),
while 46% agree (up from 38% in 2013) that the internet is a good way to
DISCONNECTED meet new people (over-indexing by 35%). For Asian-Americans, staying
connected online is not only about social networking and messaging, but
WITHOUT THE also about keeping up with the news and reading the latest blogs. Asian-
Americans ages 18 to 34 also over-index against their non-Hispanic White
INTERNET. peers for most digital connectedness, but they under-index for using the
internet or apps to find local and community events.*
Staying connected and being entertained aren’t the only ways Asian-
Americans use the internet. Those who are 18 and older over-index
against non-Hispanic Whites for every type of online activity, including
using websites and apps for practical tasks such as travel reservations,
banking, shopping, looking up business information, seeking employment,
looking for medical services, taking college courses and finding weather,
traffic and map information. The percentage of Asian-Americans using the
internet for each of these individual reasons has increased since 2013;
only the use for music downloads or purchases has decreased.*
Asian-Americans ages 18 to 34 also over-index against non-Hispanic
Whites of the same age for using the internet or apps for practical tasks.
The exceptions are finding a business address or phone number, and
other unspecified uses, for which they are slightly under par.
* Source: Nielsen Scarborough USA+ 2017 Release 1, Reissue 09-18-2017, Total (Dec 2015 - Apr 2017); Base: Total Adults 18+ Projected: 249,644,942
Respondents: 207,374. Gfk/MRI Attitudinal Insights; Agree completely or somewhat.
22TOP WAYS INTERNET OR APPS WERE USED IN LAST 30 DAYS ON ANY DEVICE
CONNECTEDNESS
SOCIAL NETWORKING INSTANT MESSAGING NATIONAL NEWS
(Facebook, Twitter, LinkedIn, etc.)
83% 92% 68% 77% 44% 45%
116 102 135 116 137 126
LOCAL NEWS BLOGS
(Read or contributed to)
ASIAN-AMERICAN 18+
ASIAN-AMERICAN 18-34
39% 41% 34% 43%
INDEX: ASIAN-AMERICAN/
NON-HISPANIC WHITE
131 116 192 146
SERVICES
SEARCH BANKING WEATHER
(Google, Yahoo!, etc.)
87% 92% 71% 77% 68% 70%
113 102 124 109 114 101
MAPS/GPS SHOPPING
(Google Maps, MapQuest, etc.)
ASIAN-AMERICAN 18+
ASIAN-AMERICAN 18-34
66% 70% 60% 66%
INDEX: ASIAN-AMERICAN/
NON-HISPANIC WHITE
121 107 124 112
Source for both graphics: Nielsen Scarborough USA+ 2017 Release 1, Reissue 09-18-2017, Total (Dec 2015 - Apr 2017); Base: Total Adults 18+ Projected: 249,644,942
Respondents: 207,374
Copyright © 2018 The Nielsen Company 23ASIAN-AMERICANS | DIGITAL LIVES AND GROWING INFLUENCE
MAINTAINING, ADAPTING
AND ADOPTING ONLINE
CONNECTIVITY IN DAILY LIFE
MAINTAINING CULTURAL TIES BY
STAYING CONNECTED
Similar to the mainstream U.S., more Asian-Americans use Google Search,
YouTube, MSN, Facebook, Gmail, Yahoo, Amazon and Microsoft than use
any other websites. Still, how and why Asian-Americans use internet sites
and search engines could be highly influenced by strong ties to the user’s
country of origin or ancestry. Many of the websites used widely among
Asian-Americans are either of Asian origin or specifically designed with
Asian-Americans in mind. The largest ancestry groups within the Asian-
American population are Chinese (19%), Asian Indian (18%), Filipino (13%),
Vietnamese (8%) and Korean (7%). So it follows that many of the popular
websites are from those countries of origin or specifically targeted to
Americans of those ancestries.
Popular sites and apps from China include Sohu and Baidu (search
engines), Sina (a social network), Tencent QQ (an instant messenger),
WeChat (chat app) and Alibaba, Aliexpress and Taobao (online shopping
sites). In addition to the Chinese sites being more technologically
advanced than their U.S. counterparts, the heavy censorship of U.S. sites
in China, means using the Chinese sites allow Asian-Americans to better
communicate with Chinese family, friends and businesses. Another popular
app used to connect with others is Kakao Talk (a Korean chat app).
Indian websites that are popular among Asian-Americans include India
Times and The Indian Express (news sources), as well as Hotstar (an Indian
TV and movie entertainment platform). Other sites that get substantial
traffic from Asian-Americans are Kissasian (a site for Asian movies and TV
shows from many countries), DotPH (a Filipino domain name site), Naver (a
Korean search engine) and AliKpop (a U.S.-originated Korean pop site).*
* Source: Nielsen NetView: Demographic Targeting (Internet Applications Included, Adult Sites Excluded). June 2017. U.S.
24SMARTPHONE APPS WITH THE HIGHEST REACH
AMONG ASIAN-AMERICANS
When it comes to the most popular smartphone apps, Asian-Americans aged
18 and older are closely aligned with the rest of the U.S. population. The five
smartphone apps with the highest active reach among Asian-Americans are
Facebook, YouTube, Google Maps, Facebook Messenger and Apple Music.
APPS WITH HIGHEST ACTIVE REACH FOR ASIAN-AMERICANS*
(AGES 18+)
59%
FACEBOOK
74%
YOUTUBE 57%
54%
GOOGLE MAPS 55%
57%
52%
FACEBOOK MESSENGER
66%
42%
APPLE MUSIC
40%
ASIAN-AMERICAN NON-HISPANIC WHITE
Apps popular globally in Asian countries, such as WeChat and Line, are not included in this measurement. Those listed are based on data collected and apps
*
measured in the U.S.
Source: Nielsen Mobile NetView Smartphone Apps, June 2017.
Copyright © 2018 The Nielsen Company 25ASIAN-AMERICANS | DIGITAL LIVES AND GROWING INFLUENCE
HIGHEST OVER-INDEXING SMARTPHONE APPS TOP 40 HIGHEST REACH*
(ACTIVE REACH, ASIAN-AMERICAN 18+)
INDEX
Asian-American 18+/
Total U.S. 18+
SKYPE 13.6% 247
YELP 20.5% 213
WHATSAPP MESSENGER 24.5% 203
VENMO 9.8% 187
LYFT 10.4% 175
UBER 18.0% 169
GOOGLE HANGOUTS 13.3% 159
Apps popular globally in Asian countries, such as WeChat and Line, are not included in this measurement. Those listed are based on data collected and apps
*
measured in the U.S.
Source: Nielsen Mobile NetView Smartphone Apps, June 2017.
Asian-Americans aged 18 and older over-index against the Total U.S. on
18 of the top 40 smartphone apps they use. Those top apps where Asian-
Americans over-index the most include Skype, Yelp, WhatsApp and Venmo,
which each have more than double the active reach, as well as Lyft, Uber and
Google Hangouts; each with more than 60% higher active reach. Most of their
over-indexing apps help them to stay connected, use shared transportation,
mobile banking, provide user recommendations and entertainment, which
personifies how Asian-Americans have adapted the latest tech conveniences
to meet their lifestyles.
26UNPARALLELED NETWORKING ON
SOCIAL MEDIA
Asian-Americans are extremely active on social media, as evidenced by
their top apps. They over-index against non-Hispanic Whites for all reasons
for visiting or using social-networking sites. The greatest difference when
compared to non-Hispanic Whites is that 28% of Asian-Americans use social
networking sites to meet or network with professional contacts, over-
indexing by 56%. The top reason that Asian-Americans use social-networking
sites, however, is to keep in touch with family and friends. Forty-two percent
like to keep their personal pages updated with information about their life
(over-indexing by 41%), and 55% say instant messaging also keeps them in
touch with friends (over-indexing by 24%). Asian-Americans ages 18 to 34
also over-index against their non-Hispanic White peers for all reasons for
visiting or using social-networking sites, with the exception of meeting or
networking with professional contacts.*
IMPORTANT REASONS FOR VISITING OR USING
SOCIAL NETWORKING WEBSITES: ASIAN-AMERICANS, AGES 18+
INDEX
Asian-American 18+/
Non-Hispanic White 18+
KEEP IN TOUCH WITH FAMILY/FRIENDS
62% 121
FOLLOW THE ACTIVITIES OF MY FRIENDS AND FAMILY
51% 118
RECONNECT WITH PEOPLE FROM MY PAST
43% 120
FIND INFORMATION ABOUT NEWS OR OTHER CURRENT EVENTS
41% 120
FIND LOCAL INFORMATION
38% 118
Source: Nielsen Scarborough USA+ 2017 Release 1, Reissue 09-18-2017: Gfk/MRI Attitudinal Insights Total (Dec 2015–Apr 2017); Base: Total Adults 18+
Projected: 249,644,942 Respondents: 207,374; Gfk/MRI Attitudinal Insights, very important or somewhat important.
* Source: Nielsen Scarborough USA+ 2017 Release 1, Reissue 09-18-2017, Total (Dec 2015 - Apr 2017); Base: Total Adults 18+ Projected: 249,644,942
Respondents: 207,374.
Copyright © 2018 The Nielsen Company 27ASIAN-AMERICANS | DIGITAL LIVES AND GROWING INFLUENCE
HOW TO REACH ASIAN-AMERICANS
Asian-Americans over-index against non-Hispanic Whites for finding
various types of useful information in mobile phone and internet
advertising, while they slightly under-index for TV advertising. The
information source that the largest percentage of Asian-Americans
identify as useful or meaningful is internet advertising. Asian-Americans
ages 18 to 34 similarly over-index against non-Hispanic Whites of the
same age for mobile and internet advertising; they also over-index
against their peers for finding useful information in advertising on TV.*
USEFULNESS OF SOURCES OF PURCHASE
INFORMATION: ASIAN-AMERICANS 18+
PROVIDES MEANINGFUL INFORMATION ABOUT THE PRODUCT
INDEX
Asian-American 18+/
USE OF OTHER CONSUMERS Non-Hispanic White 18+
ADVERTISING ON MOBILE PHONES ............................................................................................................. 24% 140
ADVERTISING ON THE INTERNET .................................................................................................................. 38% 126
ADVERTISING ON TV .................................................................................................................................................. 35% 99
PROVIDES USEFUL INFORMATION ABOUT BARGAINS
ADVERTISING ON MOBILE PHONES ............................................................................................................ 26% 136
ADVERTISING ON THE INTERNET ................................................................................................................... 44% 124
ADVERTISING ON TV ................................................................................................................................................. 39% 99
PROVIDES USEFUL INFORMATION ABOUT NEW PRODUCTS AND SERVICES
ADVERTISING ON MOBILE PHONES ............................................................................................................. 24% 130
ADVERTISING ON THE INTERNET ................................................................................................................... 43% 117
ADVERTISING ON TV ................................................................................................................................................. 49% 94
Source: Nielsen Scarborough USA+ 2017 Release 1, Reissue 09-18-2017: Gfk/MRI Attitudinal Insights Total (Dec 2015–Apr 2017);
Base: Total Adults 18+ Projected: 249,644,942 Respondents: 207,374; Gfk/MRI Attitudinal Insights, very important or somewhat
important.
* Source: Nielsen Scarborough USA+ 2017 Release 1, Reissue 09-18-2017, Total (Dec 2015 - Apr 2017); Base: Total Adults 18+ Projected: 249,644,942
Respondents: 207,374.
2885% OF ASIAN-AMERICANS
HAVE MADE AN ONLINE
PURCHASE IN THE LAST 30
DAYS, 19% HIGHER THAN
NON-HISPANIC WHITES.
ONLINE SPENDING
Asian-Americans are leaders in incorporating digital devices into their
daily routines, and among those ages 18 and older, 86% agree that the
internet is a great way to buy products (over-indexing non-Hispanic Whites
by 10%). Online purchasing is integral to their lives, as evidenced by
the fact that the average amount spent by Asian-Americans on internet
purchases in the last 12 months is $1,151, which is 20% higher than
online spending by their non-Hispanic White counterparts, according
to Nielsen Scarborough. Additionally, Asian-Americans over-index in all
dollar categories over $500 for internet purchases in the last 12 months.
Fifty-three percent of Asian-Americans spent $500 or more online (over-
indexing against non-Hispanic Whites by 37%), and 37% spent $1,000 or
more online (over-indexing by 55%). These numbers are up from 42% and
28%, respectively, in 2013.*
* Source: Nielsen Scarborough USA+ 2017 Release 1, Reissue 09-18-2017, Total (Dec 2015 - Apr 2017); Base: Total Adults 18+ Projected: 249,644,942 Respondents:
207,374. Gfk/MRI Attitudinal Insights; Agree completely or somewhat.
Copyright © 2018 The Nielsen Company 29ASIAN-AMERICANS | DIGITAL LIVES AND GROWING INFLUENCE
TOP ASIAN-AMERICAN MILLENNIAL
ONLINE PURCHASING CATEGORIES
Asian-American Millennials are particularly avid online shoppers and over-index
against their non-Hispanic White counterparts on purchasing in many categories.
Among Asian-American Millennials, the most-purchased category is clothing and
accessories, outpacing non-Hispanic White Millennials’ purchases by 13%. The
categories where Asian-American Millennials over-index against non-Hispanic
White Millennials by the most are computer hardware and software (over-
indexing by 63%), airline tickets (by 53%) and consumer electronics (by 52%).
TOP ITEMS PURCHASED ONLINE BY ASIAN-AMERICANS, BY AGE
(AGES 18+ AND 18-34, PURCHASED IN LAST 12 MONTHS)
INDEX: ASIAN- INDEX: ASIAN-
AMERICAN 18+/ AMERICAN 18-34/
ASIAN - TOTAL U.S. ASIAN- TOTAL U.S.
AMERICAN 18+ NON-HISPANIC AMERICAN 18-34 NON-HISPANIC
(REACH) WHITE 18+ (REACH) WHITE 18-34
CLOTHING OR ACCESSORIES 52% 128 58% 113
AIRLINE TICKETS 41% 167 41% 153
BOOKS 36% 116 38% 104
OTHER TRAVEL RESERVATIONS 32% 136 29% 117
(Hotels, auto rental, etc.)
HEALTH AND BEAUTY ITEMS 26% 159 29% 137
MOVIE TICKETS 26% 175 30% 126
GROCERIES 25% 134 25% 134
CONSUMER ELECTRONICS 23% 134 23% 152
Read as: Fifty-eight percent of Asian-American Millennials (18-34) purchased clothes or accessories online in the past year which is 13% more than their non-Hispanic
White counterparts during the same time period.
* Source: Nielsen Scarborough USA+ 2017 Release 1, Reissue 09-18-2017, Total (Dec 2015 - Apr 2017); Base: Total Adults 18+ Projected: 249,644,942
Respondents: 207,374.
30GROWTH IN ONLINE DOLLARS
PER BUYER
Asian-Americans were early adopters of online shopping, but the growth of
their online consumption is sustained and impactful. The average amount
that Asian-Americans spend online has grown tremendously year over year,
as well as in select non-food home categories in 2017. For example, the
average amount spent on skin care for online shoppers grew 40% in 2017
over the previous year, kitchen gadgets grew 37%, cosmetics grew 47%, and
hair care grew 18%.
TOTAL ONLINE SHOPPING: AGES 18+ WHO BUY GIVEN CATEGORY
(ANNUAL DOLLAR SPEND PER BUYER)
4.8%
$84
9.6%
$80
$71
$65 40% 14.8%
$43
$35
$30 $30
HOUSEWARES PET FOOD SKIN CARE PAPER
AND APPLIANCES PREPARATIONS PRODUCTS
17.5% 46.8% 37%
$24 $28 $24 $22 $20
$16 $16
HAIR CARE COSMETICS KITCHEN
GADGETS
2016 2017
Source: Homescan, Total U.S., 52 Weeks Ending, 1/13/18 vs. YAG (Year Ago)
Copyright © 2018 The Nielsen Company 31ASIAN-AMERICANS | DIGITAL LIVES AND GROWING INFLUENCE
NON-FOOD HOME ITEMS PURCHASED ONLINE
Asian-American households are heavy buyers of non-food items for
the home, utilizing online providers to get exactly what they want with
increased satisfaction and ease of comparison shopping. Asian-Americans
over-index against non-Hispanic Whites for dollars per buyer spent
online on many categories, including hair care, oral hygiene, skin care,
housewares, computer and electronic products, and household supplies.
TOTAL ONLINE SHOPPING: ASIAN-AMERICANS, AGES 18+
(ANNUAL DOLLAR SPEND PER BUYER)
ASIAN - NON-HISPANIC INDEX: ASIAN-AMERICAN/
AMERICAN WHITE NON-HISPANIC WHITE
SKINCARE
PREPARATIONS $43 $32 134
ORAL HYGIENE $33 $23 141
HAIR CARE $28 $24 117
HOUSEWARES AND
APPLIANCES $84 $74 114
COMPUTER/ELECTRONIC
PRODUCTS $93 $84 111
Read as: Asian-Americans spent $43 on skin care preparation products online last year, 34% more than their non-Hispanic White counterparts.
Source: Homescan, Total U.S., 52 Weeks Ending, 1/13/18 vs. YAG (Year Ago)
32TOP NON-GROCERY ITEMS PURCHASED USING THE INTERNET
(PAST 12 MONTHS, AGES 18+)
ANY INTERNET PURCHASE CLOTHING OR ACCESSORIES AIRLINE TICKETS
85% 119 52% 128 41% 167
BOOKS OTHER TRAVEL RESERVATIONS
(Hotels, auto rental, etc.)
36% 116 32% 136 INDEX Asian-American 18+/
Non-Hispanic White 18+
Read as: Eighty-five percent of Asian-Americans made an internet purchase in the last 12 months, and they were 19% more likely to do so than their non-Hispanic
White counterparts.
Source: Nielsen Scarborough USA+ 2017 Release 1, Reissue 09-18-2017, Total (Dec 2015–Apr 2017); Base: Total Adults 18+ Projected: 249,644,942
Respondents: 207,374
Eighty-six percent of Asian-Americans agree that the internet is a great
way to buy products (over-indexing against non-Hispanic Whites by 10%).
In addition, 76% use the Internet to buy hard-to-find products (over-
indexing by 17%).*
Pricing and special offers are an important component of online
purchases. Seventy-two percent of Asian-Americans like to compare prices
across different sites before purchasing something online (over-indexing
by 9%), and 73% prefer purchasing online for a fixed price, as opposed to
bidding auction-style (over-indexing by 13%). While 72% say the offer of
free shipping attracts them to a shopping website (over-indexing by 7%),
one-third of Asian-Americans (33%) say they purchase products online
only when they have a coupon or promotional code for the site (over-
indexing by 10%).*
Retailers and online purveyors should be aware of the tremendous
importance that Asian-Americans place on gathering purchase information
through online means. Ninety percent agree the internet is a great way
to gather information on products and services they are considering
purchasing (over-indexing by 4%). Before purchasing a product online,
75% typically read online reviews submitted by others (over-indexing by
14%). Following a purchase, 32% of Asian-Americans like to share their
opinions about products and services by posting reviews and ratings
online (over-indexing by 23%).*
* Source: Nielsen Scarborough USA+ 2017 Release 1, Reissue 09-18-2017, Total (Dec 2015 - Apr 2017); Base: Total Adults 18+ Projected: 249,644,942
Respondents: 207,374. Gfk/MRI Attitudinal Insights; Agree mostly or somewhat.
Copyright © 2018 The Nielsen Company 33ASIAN-AMERICANS | DIGITAL LIVES AND GROWING INFLUENCE
PRICING AND SPECIAL OFFERS ARE AN IMPORTANT COMPONENT OF
ONLINE PURCHASES FOR ASIAN-AMERICANS.
72% LIKE TO COMPARE PRICES ACROSS DIFFERENT SITES BEFORE PURCHASING
SOMETHING ONLINE
73% PREFER PURCHASING ONLINE FOR A FIXED PRICE, AS OPPOSED TO
BIDDING AUCTION-STYLE
72% SAY THE OFFER OF FREE SHIPPING ATTRACTS THEM TO A
SHOPPING WEBSITE
33% SAY THEY PURCHASE PRODUCTS ONLINE ONLY WHEN THEY HAVE
A COUPON OR PROMOTIONAL CODE FOR THE SITE
* Source: Nielsen Scarborough USA+ 2017 Release 1, Reissue 09-18-2017, Total (Dec 2015 - Apr 2017); Base: Total Adults 18+ Projected: 249,644,942
Respondents: 207,374. Gfk/MRI Attitudinal Insights; Agree mostly or somewhat.
34TV WATCHING
Shopping isn’t the only activity moving online. Sixty-two percent of Asian-
Americans watch or download movies or TV programs from the internet on
their computer, smartphone or tablet (over-indexing by 63%).* As shown
earlier in this report, Asian-Americans of all ages may be spending less time
than one year ago on live and DVR TV, and they may be spending less time
on TV than the total population. Nevertheless, they are all still spending a
high number of hours (most of their digital time) watching TV programming
through traditional means or online streaming.
FAVORITE BROADCAST NETWORK PROGRAMS
Top non-sports broadcast network shows include “The Good Doctor,” “The
Big Bang Theory,” “This Is Us,” “Will and Grace,” “Young Sheldon,” and “NCIS.”
Also in the top ten are competition shows “Dancing With the Stars” and “The
Voice” (both showings), as well as the news show “60 Minutes.” Networks
should take note that the top four Asian-American preferred series include
Asian-Americans: “The Good Doctor,” “The Big Bang Theory,” and “Dancing
With the Stars” have Asian-Americans in prominent roles, while “This Is
Us” has a diverse cast and has episodes that feature Asian performers and
themes.
FAVORITE CABLE PROGRAMS
When watching cable TV, Asian-Americans are often tuned in to a news-type
program. Of the top non-sports cable shows (with five or more telecasts)
among Asian-Americans, six are news related. “The Walking Dead” and “The
Librarians” are the top fictional shows that aren’t movies.
* Source: Nielsen Scarborough USA+ 2017 Release 1, Reissue 09-18-2017, Total (Dec 2015 - Apr 2017); Base: Total Adults 18+ Projected: 249,644,942
Respondents: 207,374.
Copyright © 2018 The Nielsen Company 35ASIAN-AMERICANS | DIGITAL LIVES AND GROWING INFLUENCE
TOP BROADCAST NETWORK SHOWS WITH FIVE OR MORE TELECASTS
(ASIAN-AMERICANS 18+)
ASIAN-AMERICAN
NETWORK PROGRAM VIEWERS (000)
1 ABC The Good Doctor 575
2 CBS The Big Bang Theory 560
3 NBC This Is Us 499
4 ABC Dancing With The Stars 496
5 NBC Will & Grace 454
6 CBS 60 Minutes 431
7 NBC The Voice 430
8 NBC The Voice (Tue.) 417
9 CBS Young Sheldon 402
10 CBS NCIS 401
Source: Nielsen NPOWER Cable Program Rankings 4Q 2017, 09/25/2017–12/31/2017, Live+7 Days (+168 Hours)
TV with Digital | Linear with VOD (Excluding Sports)
TOP CABLE SHOWS WITH FIVE OR MORE TELECASTS
(ASIAN-AMERICANS 18+)
ASIAN-AMERICAN
NETWORK PROGRAM VIEWERS (000)
1 MSNBC Rachel Maddow Show 70
2 AMC Walking Dead 66
3 CNN Erin Burnett Outfront 60
4 CNN Anderson Cooper 360 58
5 CNN Fareed Zakaria: GPS 56
6 CNN Situation Room 56
7 Hallmark Channel Hall Original Movie 55
8 CNN Reliable Sources 55
9 Turner Network Television The Librarians 54
10 AMC Karate Kid Friday 53
Source: Nielsen NPOWER Cable Program Rankings 4Q 2017, 09/25/2017–12/31/2017, Live+7 Days (+168 Hours)
TV with Digital | Linear with VOD (Excluding Sports)
36SECTION II TAKEAWAYS
Relative to the general population, Asian-Americans are extremely engaged
1 with new technology, and over-index for both ownership of most tech
devices and their willingness to pay more for top quality electronics. These
traits make Asian-Americans the ideal consumers for marketers who
understand that diligent product research and referrals heavily influence
their tech purchases.
Asian-Americans are spending more time on multimedia devices, and apps
2 and web on a smartphone. The majority of Asian-Americans think of their
mobile phone as a source of entertainment, and thus expect high quality
video features and desire more mobile options for watching their favorite
shows.
The apps most commonly used by Asian-Americans are the same as those
3 used by the general population, but Asian-Americans over-index the most
for WhatsApp, Skype, Yelp, Venmo, Lyft and Uber.
Asian-Americans are extremely active on social media, and over-index
4 against non-Hispanic Whites for all reasons for visiting or using social
networking sites. They over-index the most in using social networking to
meet or network with professional contacts, but the top reason they use
social networking sites is to keep in touch with family and friends.
The average amount spent by Asian-Americans on internet purchases in
5 the last year is 20% higher than average online spending by non-Hispanic
Whites. Asian-Americans also over-index for dollars per buyer spent online
on many non-food groceries, including hair care, skin care, computer and
electronic products.
Pricing and special offers are an important component of Asian-Americans
6 online purchasing behavior; they over-index for comparing prices across
different sites, preferring to purchase for a fixed price, being attracted by
free shipping and purchasing only when they have a coupon or promotional
code. Asian-Americans also place tremendous importance on gathering
purchase information through online means, and reading and writing
product and service reviews.
Copyright © 2018 The Nielsen Company 37SECTION III
ASIAN-AMERICANS CAPTURING
THE SPOTLIGHT
38 At Nielsen, data drives everything we do—even art. That’s why we used real data to create this image.Asian-Americans are having a huge impact on what America eats, watches,
reads and listens to. From chefs and food bloggers to YouTube stars,
graphic novelists, entrepreneurs, actors and athletes, Asian-Americans
are not only making their mark, but are also remaking the American
mainstream in their image.
PAN-ASIAN CUISINE AND
FOOD BLOGGERS
Asian-Americans have had a tremendous impact on the U.S. food scene,
particularly in the last 15 years. While the history of Asian-American
cuisine goes back to the California Gold Rush, the rise of contemporary
Asian-American cuisine is said to have begun in 2004 with the opening
in New York of Momofuku Noodle Bar by Korean-American chef, David
Chang. Unlike the Asian fusion of the early 1990s, which primarily involved
non-Asian chefs adding Asian ingredients into otherwise Western dishes,
Asian-American cuisine is made by Asian-Americans (of all ancestries) who
came to the U.S. as children or were born to immigrant parents; it is a
unique representation of the life they have lived both as typical Americans
surrounded by numerous cultures and as heirs to the often-idealized
Asian culture of their ancestry. Instead of being westernized Asian cuisine
or Asianized American cuisine, it is a new flavor language spoken well only
by those fluently ambicultural.
Copyright © 2018 The Nielsen Company 39You can also read