Assessing Risk Tolerance for Asset Allocation - Financial ...
←
→
Page content transcription
If your browser does not render page correctly, please read the page content below
Contribution: Assessing Risk Tolerance for Asset Allocation

Assessing Risk Tolerance for Asset Allocation
by William G. Droms, DBA, CFA, and Steven N. Strauss, CPA/PFS

This article proposes a risk tolerance questionnaire that develops asset allocation guidelines as a dual function of risk
tolerance and time horizon. Although no risk tolerance questionnaire by itself can provide a definitive answer to the
asset allocation question, it can be a useful instrument for making a first pass at an optimal solution and can be a
valuable supplement to standard optimization modeling or Monte Carlo simulations. At a minimum, the questionnaire
approach provides a useful starting point for discussion of the implications of a client’s risk tolerance for his or her
asset allocation choices.

William G. Droms, DBA, CFA, is the Powers Professor of Finance in the McDonough School of Business at
Georgetown University and a principal in Droms Strauss Advisors Inc. He has published numerous articles in
professional journals, including the Financial Analysts Journal, Journal of Accountancy, and CPA Journal.

Steven N. Strauss, CPA/PFS, is a principal in Droms Strauss Advisors Inc., and president of Strauss and Company,
CPAs. He is a co-developer of the AICPA PFP Partner and Partner for Windows personal financial planning software
packages.

One of the key steps in investment planning for an investment advisor is the assessment of a client’s risk tolerance so
that a portfolio can be structured that is consistent with the client’s willingness to trade risk for reward. Since the first
published risk tolerance questionnaire appeared nearly 20 years ago, the use of risk tolerance questionnaires by
financial planners and private client investment managers has become increasingly common.1 A review of the
questionnaires currently in use shows that virtually all of them focus on the asset allocation decision—that is, the
process of distributing portfolio investments among the various available asset categories such as money market
instruments, bonds, stocks, real estate and other assets. The result of the risk tolerance questionnaire typically is a
recommended percentage allocation to each of these asset classes.

Virtually all experienced financial planners and investment managers would agree that a questionnaire by itself cannot
possibly lead directly to a definitive asset allocation plan. We certainly would agree with this sentiment. In our practice,
we use our risk tolerance questionnaire as the basis for beginning a dialogue with our clients about their risk tolerance
and return needs. The questions to which we ask them to respond force us to focus on the important aspects of our
clients’ investment concerns and provide a springboard for a detailed discussion of our approach to investment
management and an explanation of our typical asset allocation configurations.

We normally meet with potential new clients at least twice before we assume responsibility for managing their
investments. Typically, we use the first meeting to familiarize ourselves with the client’s financial situation, explain our
investment philosophy and gather detailed information from the client. Clients normally complete the risk tolerance
questionnaire as part of the first meeting or as a “homework assignment” prior to the second meeting. We then use
the second meeting to discuss more detailed information about the types of investments we will be making for them,
the timing of the investments and any other issues of concern to us or the client. The results of the risk tolerance
questionnaire provide a key component of the information we use to begin a relationship with a new client, but these
results contribute only one facet of the client relationship.

This article proposes a new approach to using risk tolerance questionnaires which (1) offers a unique solution to
dealing with the impact of time horizon on risk tolerance and (2) suggests an asset allocation appropriate to investors’
risk tolerance. This questionnaire is a modified version of the questionnaire that appeared most recently in the Journal
of Accountancy.2 The asset allocation guidelines appropriate to an investor’s risk tolerance have been developed over
a period of years for use in the authors’ investment management practice.

A Function of Time Horizon
The typical approach to handling time horizon is to pose a number of questions to potential investors, some of which
deal with time horizon, then score all questions, add up the score and recommend an asset allocation based on the
total score. Some more sophisticated versions may treat time horizon as a separate issue with a separate score, but
the net result is still to add up all the points and base asset allocation recommendations on the total points. The risk

2003_Issues/jfp0303 (1 of 7)
Contribution: Assessing Risk Tolerance for Asset Allocation

tolerance questionnaire described here improves the handling of time horizon by developing asset allocation
recommendations as a function of time horizon, rather than simply including a time horizon question as part of the
questionnaire.3 After answering all of the risk tolerance questions, an investor is asked to identify his or her
investment time horizon as short-term (three years or less), intermediate term (four to seven years), or long-term
(more than seven years).

An investor with a short-term horizon who has the same risk tolerance score as an investor with a long-term horizon is
assigned a much more conservative asset allocation (that is, more debt, less equity) than the long-term investor.
Similarly, two investors with the same time horizon would be assigned different asset allocations depending on their
relative aggressiveness as identified by the risk tolerance questionnaire. For example, a highly risk-averse investor
with a long-term time horizon is offered a mix with 50 percent invested in fixed income securities, while a highly
aggressive investor with a long-term time horizon would be offered an asset allocation mix with a 10 percent allocation
to fixed income investments.

The asset allocation approach developed here is based on two intuitively appealing and generally accepted
assumptions. First, it assumes that the capital asset pricing model (CAPM) is a reasonable description of reality and
that risk and return go hand-in-hand in the capital markets: the only way to increase long-run return is to move out on
the risk spectrum. The CAPM measures risk quantitatively in terms of standard deviation of return; the higher the
standard deviation of return, the riskier the investment. The second assumption is that the capital markets are
reasonably efficient over the long run and that future return spreads will be similar to historical spreads, at least in
direction if not exactly in magnitude. The absolute level of future returns obviously will vary, but one can be
reasonably confident, for example, that bonds will offer higher returns than money market instruments, and stocks will
offer higher returns than bonds. The logical implication of these two assumptions is that any asset allocation model
should take a strategic approach to asset allocation and any resulting portfolio should offer broad diversification
among asset classes.

Exhibits 1 and 2 present some historical return data for the post-World War II period, 1946–2001. This 56-year period
provides some useful insights on investment returns in a long run but still contemporary period, overlapping most
clients’ adult lives. The data show the average annual compound rates of return over this period along with a
cumulative wealth index showing the growth of a $100 investment made at the beginning of the period. The exhibit
also shows the historical return spreads of stocks over Treasury bills (equity risk premium), small stocks over large
stocks (small stock premium), corporate bonds over government bonds (default premium) and long-term government
bonds over Treasury bills (bond horizon premium). These kinds of data are very useful in helping clients explore the
question of what is a reasonable long-term return expectation based on actual historical returns. The long-term results
were particularly helpful during the 1990s “bubble,” when many clients seemed to think that 20 percent-plus each year
was a reasonable return to expect from the stock market. The data may be very helpful in explaining why “mean
reversion” may lead us to a reasonable expectation of stock returns of less than the historical average of 12 percent
for the next few years.

2003_Issues/jfp0303 (2 of 7)
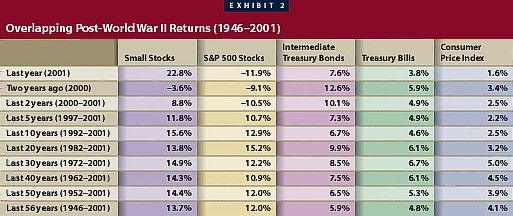
Contribution: Assessing Risk Tolerance for Asset Allocation

Exhibit 2 shows overlapping historical returns for the last 1-, 2-, 5-, 10-, 20-, 30-, 40-, 50- and 56-year periods of the
post-World War II era. These data are useful to illustrate the relative stability of long-run returns compared with the
stock market decline since calendar year 2000, and may help explain to clients why the stock market is still a
reasonable investment option for their long-term investment dollars. The data provide a useful historical perspective
against which to assess the most recent “bursting of the bubble” in the stock market.

Assess Risk Tolerance First
In counseling individual investors, it is often useful to assess their risk tolerance before addressing return objectives.
The most important point for them to understand is that there really is no such thing as a risk-free investment. In
planning an investment portfolio, investors do not have a choice of risky versus risk-free investments. Even if they
choose to leave their funds in the bank or invest all of their money in Treasury bills, they will face serious purchasing-
power risks since these types of investments generally fail to keep pace with inflation on an after-tax return basis.
Such “risk-free” options virtually guarantee loss of purchasing power of investment capital over time. A key part of the
investment asset allocation process is to decide what types of risk the client is willing to accept and the amount of
each type of risk. The overall objective of asset allocation should be to earn the highest possible return available from
investments that are compatible with the investor’s risk tolerance, time horizon, and income and liquidity needs.

2003_Issues/jfp0303 (3 of 7)

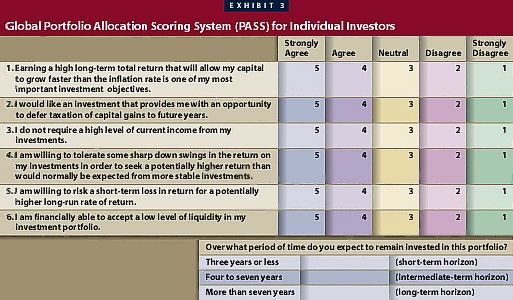
Contribution: Assessing Risk Tolerance for Asset Allocation

The asset allocation model proposed here focuses in six generic categories of investment assets: money market
instruments, U.S. bonds, international bonds, U.S. stocks, international stocks and real estate investment trusts
(REITs). Within the U.S. bond category, allocations are made between Treasury and corporate bonds (municipal
bonds may be substituted for corporates where appropriate). Within the U.S. stock category, allocations are made
among index funds, large-cap growth and value funds (or stocks), and small-/mid-cap growth and value funds (or
stocks).

These asset categories are selected because reliable long-term risk and return statistics are available and because
they reflect the asset categories most readily available to individual investors. The exclusion of investment assets
such as precious metals, hedge funds, futures, options and managed commodity pools is not meant to imply that
these investment categories may not be highly appropriate for a particular client. The approach taken here is
conceptual in nature and is only meant to provide an overall framework for asset allocation. Substitutions for some of
the recommended asset categories may be highly appropriate in consideration of individual client circumstances and
investment objectives.

The six generic categories of investments offer differing types of investment risk/return trade-offs and meet different
investor needs and objectives. Money market instruments offer a very high degree of safety of principal and
immediate liquidity along with a rate of return that is commensurate with inflation. Money market instruments,
however, are subject to a high degree of purchasing power risk. Longer-term fixed income investments offer a high
degree of current yield, reasonable liquidity and, for investment grade bonds, excellent protection of principal if held to
maturity. In addition, long-term bonds offer an effective hedge against deflation because bond prices increase when
interest rates decrease during periods of economic adversity. Of course, on the downside, bond prices fall during
periods of rising interest rates, exposing investors to interest-rate risk. Equity investments in U.S. and international
stocks offer the best opportunity for long-term capital gains but also are generally the riskiest investments from the
perspective of potential for loss and fluctuation in principal values. These investments are the classic hedges against
inflation in that they generally increase in value over long periods of time as the economy expands. Total returns
fluctuate the most for equities and, based on past experience, equity investors must be prepared for the near certainty
that there will be years in which their equity investments will decline in value. In fact, historical data show that although
common stocks provide the highest long-run rates of return overall, they lose money about one-third of the time.
Equity investors must be financially and psychologically prepared for this event.

Real estate investment trusts (REITs) offer equity-like returns but low correlations with the U.S. stock market. REITs
offer participation in a value stock investment that generally offers low correlation with higher-flying growth stocks or
stocks in general. REITs may provide an important “anchor to windward” when other classes of stocks are offering
poor returns. For calendar years 2000 and 2001, for example, the S&P 500 Index returned a cumulative loss of –21.0
percent while the Wilshire REIT index returned a positive total return of 43.4 percent.

An Aggressiveness Index
Exhibit 3 presents the Global Portfolio Allocation Scoring System (PASS) risk tolerance questionnaire that we use in
our investment management practice for taxable accounts. The PASS questionnaire requires investors to score
themselves on a 1-to-5 scale on six risk-and-return objectives. These questions are assigned one to five points for a
maximum possible score of 30; the more points scored, the more the portfolio will be oriented toward equity
investments. Conversely, a low score would orient the portfolio more toward fixed income investments. The PASS
questionnaire is essentially an “aggressiveness index” in that the more aggressive one’s return objectives and the
higher one’s risk tolerance, the more points scored on the questionnaire. The results of the questionnaire underscore
for investors and their advisors that, to earn higher returns, investors must accept higher risks.

2003_Issues/jfp0303 (4 of 7)
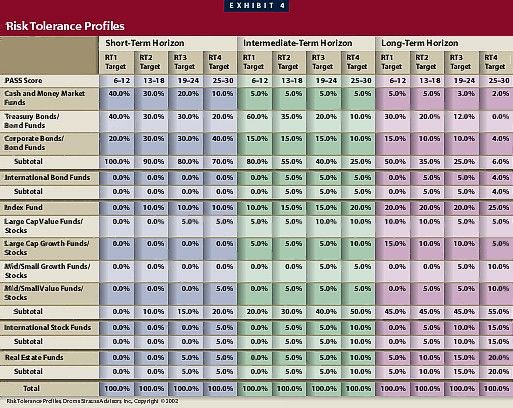
Contribution: Assessing Risk Tolerance for Asset Allocation

All of the questions are structured such that a response of “strongly agree” scores five points and “strongly disagree”
scores one point. A “neutral” response scores three points. The first three questions measure return objectives. The
second three questions deal with different aspects of risk tolerance: fluctuation in returns, probability of losses and
liquidity risk. The last question is unnumbered and unscored. This question asks the client what his or her expected
time horizon is for this portfolio. If a client has more than one portfolio under management, we normally have the client
complete one questionnaire for each portfolio if the objectives and time horizon for the portfolios are not identical.

When our clients complete the PASS questionnaire, they simply circle the appropriate response and then add up the
score. The risk tolerance profiles in Exhibit 4 then provide us with an approximate guide to what might be an
appropriate asset allocation given the client’s return objectives, risk tolerance and time horizon. The final asset
allocation decision for the client is based on the results of the PASS score and all other information we know about
the client that we gather in the interview process. We normally spend at least two hours meeting face to face with a
new client to be sure they understand our approach to investment management and that we understand their financial
situation, goals and risk tolerance. After meeting with the client, the final asset allocation may correspond to one of
our risk tolerance profiles in Exhibit 4, or we may develop a customized asset allocation guideline to reflect the
particular needs of the client. For example, some clients may already have extensive real estate investments and we
would not include REITs in their portfolio. In other cases, a client may already have non-U.S. stock investments
outside of our control and we would not include international stock funds in that client’s portfolio. In all cases, we
consider the impact of assets held outside of our control on the final asset allocation that best fits the needs and
circumstances of the client.

2003_Issues/jfp0303 (5 of 7)
Contribution: Assessing Risk Tolerance for Asset Allocation

The risk tolerance profiles correspond to the PASS questionnaire results and show the client that one way to mitigate
risk is to diversify across asset categories. Four risk tolerance profiles are listed to correspond to the questionnaire
score and the client’s time horizon. For example, the recommended allocation for a moderately conservative investor
(RT2 profile, PASS score of 13–18) with a short-term time horizon is 90 percent in money market and fixed income
securities, and 10 percent in an index fund. The same profile for an investor with a long-term time horizon is 35
percent in U.S. money market and fixed income securities, 5 percent in international bond funds, 45 percent in U.S.
equities (20 percent indexed, 10 percent large-cap growth, 10 percent large-cap value, 5 percent small- or mid-cap
value), 5 percent in international funds and 10 percent in REIT funds. In all cases, for any given risk tolerance level,
the relative aggressiveness of the portfolio increases as the time horizon increases.

Modified Risk Profiles
The risk tolerance profiles can be modified to meet the needs or requirements of individual clients and their advisors.
In our practice, we have two sets of allocation guidelines, one set for taxable accounts and one set for qualified plans.
Qualified plans in the accumulation phase generally have a lower allotment to money market funds, while qualified
plans in the distribution phase generally have approximately one year’s worth of distributions allocated to money
market instruments. For use within our practice, we also use seven risk tolerance profiles rather than the four shown
in the illustration. We also may modify the corporate/Treasury mix depending on the client’s tax status, income needs
and risk tolerance. Finally, we often find that individual client circumstances require that we devise an asset allocation
that does not correspond exactly to any of our preassigned profiles.

The risk tolerance questionnaire developed here for asset allocation provides a unique approach to dealing with the
most difficult issue in asset allocation planning—accounting for an investor’s expected time horizon for investing. As
noted earlier, a simple numerical goals-and-attitude scoring system cannot provide a definitive answer to all of the
important issues that need to be addressed before a final asset allocation is established. But it is a useful instrument
for making a first pass at an optimal solution and can be a valuable supplement to an asset allocation approach using

2003_Issues/jfp0303 (6 of 7)
Contribution: Assessing Risk Tolerance for Asset Allocation

standard optimization modeling or Monte Carlo simulations. At a minimum, the questionnaire approach provides a
useful starting point for a discussion of the implications of a client’s risk tolerance for his or her asset allocation
choices.

Endnotes

    1. A literature review shows that the first published risk tolerance questionnaire appeared in William G. Droms,
       The Dow Jones-Irwin Mutual Fund Yearbook 1984 (Homewood, Ill.: Dow Jones-Irwin, 1984).
    2. James H. Wilson and William G. Droms, “Don’t Put All Your Eggs in One Basket,” Journal of Accountancy,
       January 1999. The Wilson/Droms questionnaire for retirement planning explicitly separates the time horizon
       question and assigns points to an investor’s final score based on years to expected retirement.
    3. The idea of separating time horizon from the “scoring” questions originated from a working group of which the
       author was a member at Foliofn® in Vienna, Virginia. An interactive version of this approach with different
       questions and different recommendations is available at Foliofn.com.

2003_Issues/jfp0303 (7 of 7)
You can also read


