Association between Sleep Quality and Health Related Quality of Life among Adult Patients Attending Primary Health Care Centers in Riyadh, Saudi ...
←
→
Page content transcription
If your browser does not render page correctly, please read the page content below
JMSCR Vol||10||Issue||03||Page 103-112||March 2022
http://jmscr.igmpublication.org/home/
ISSN (e)-2347-176x ISSN (p) 2455-0450
DOI: https://dx.doi.org/10.18535/jmscr/v10i3.18
Association between Sleep Quality and Health Related Quality of Life
among Adult Patients Attending Primary Health Care Centers in Riyadh,
Saudi Arabia
Authors
Ahlam Al Mutairi , Najla Alrumayh2, Bader Al Bader3
1
1
Family Medicine Resident, King Abdulaziz Medical City in Riyadh, Saudi Arabia
2
Family Medicine Resident, King Abdulaziz Medical City in Riyadh, Saudi Arabia
3
Consultant and Assistant Professor of Family Medicine, King Abdulaziz Medical City in Riyadh, College
of Medicine, KSAU-HS
*Corresponding Author
Ahlam Saad Al-Mutairi
Family Medicine Resident, PO Box. 13223-6600, Riyadh 13223, Kingdome of Saudi Arabia
Abstract
Background: Poor sleep quality is associated with various health outcomes, such as cardiovascular
disease, cancer and death. Although the epidemiology of poor sleep has been well described
internationally, few studies investigated its prevalence in Saudi Arabia.
Methods: We conducted a multicenter, cross-sectional study to investigate the prevalence of poor sleep
in three primary healthcare clinics in Riyadh, Saudi Arabia. Sociodemographic and clinical
characteristics were collected along with self-reported sleep characteristics, including subjective sleep
quality, sleep duration and latency, were also recorded. We used the Pittsburgh sleep quality index
(PSQI) to assess sleep quality, with lower scores indicating better sleep quality. We considered an
overall PSQI score > 5 to indicate poor sleep quality. We also evaluated health-related quality of life
(QoL) via the health-related quality-of-life questionnaire short-form SF-12 Health Survey (SF-12).
Results: Between [October], 2020, and [January], 2021, we enrolled 400 participants who met all
eligibility criteria. The median (interquartile range [IQR]) age of participants was 36 (26-46) years, and
206 (52%) were male. We found that 49.5% (95% confidence interval [CI]= 44-55%) of 331 participants
with valid data were considered as poor sleepers (PSQI>5). The median (IQR) PSQI score was 5 (3-8).
Male sex (mean difference [MD]: -0.98, 95% CI = -1.70 to - 0.26, P=0.008), employed participants
(MD: -0.78, 95% CI = -1.51 to - 0.05, P= 0.04) and physically active patients (MD:-1.0, 95% CI = -1.72
to - 0.28, P=0.007) were associated with significantly lower mean PSQI scores. QoL was inversely
associated with PSQI scores (: -0.78 units, 95% CI, -0.95 to -0.61, P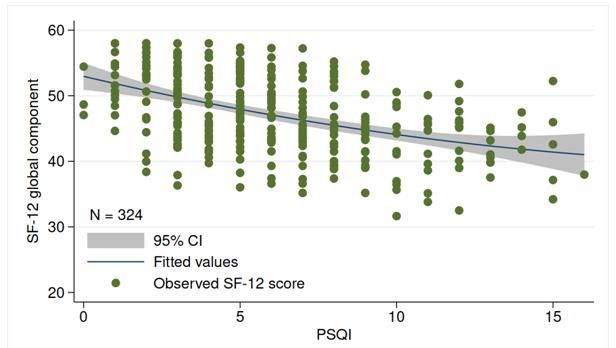
JMSCR Vol||10||Issue||03||Page 103-112||March                                                2022
 Introduction                                             countries[12], and Australia[12] follow similar
 Sleep plays a ubiquitous role in brain function and      trends.
 physiologic processes of almost every system in          While the prevalence of poor sleep and its
 the body[1]. As a result, adequate sleep is crucial to   association with health-related quality of life has
 optimal health and vitality, and sleep quality has       been widely investigated in many countries
 been considered one of the principal factors             worldwide, few studies on that topic have been
 influencing quality of life[1-3].                        performed in the Middle East, particularly in
 In this respect, insufficient sleep also impairs         Saudi Arabia. Therefore, this study aims to
 health-related quality of life, negatively               determine the prevalence of poor sleep and its
 influencing existing medical disorders. This has         association with health-related quality of life in a
 been exemplified by Strine et al., who examined a        population served by the primary care setting in
 sample of nearly 80,000 participants and                 Riyadh, Saudi Arabia.
 concluded that insufficient sleep was associated
 with increased physical and mental distress scores,      Material and Methods
 depressive symptoms, anxiety levels, and pain            Study Design
 intensity[4].                                            This was a multicenter, cross-sectional study
 Over the past decades, a growing body of                 conducted in three primary healthcare clinics in
 evidence suggests an association of sleep duration       Riyadh, Saudi Arabia. Ethics committees from the
 with many disorders, including hypertension,             respective institutions approved the study and
 type-2 diabetes, metabolic syndrome, obesity,            written informed consent was obtained from all
 cardiovascular diseases, and cancer[5]. For              participants. We followed the Declaration of
 instance, a recent study that employed a cohort of       Helsinki, and this study was reported in
 more than 400,000 individuals from the UK with a         accordance with the STROBE guideline[13].
 follow-up of approximately nine years showed             Setting
 that individuals who sleep less than 5 hours per         The three participating centers belong to the
 night were associated with a 25% increase in the         primary care system of Riyadh, covering different
 risk of all-cause mortality compared to those who        regions of the city. The clinics provide general
 sleep 7 hours per night[5]. According to the             outpatient care with various medical specialities,
 authors, there is a U-shaped relationship between        targeting primarily armed forces and their
 sleep duration and the risk of mortality and             families.
 morbidity, which has been strongly supported by          Participants
 independent findings worldwide[6]. Overall,              We included patients of both sexes. Patients had
 individuals at the extreme of the distributions          to be aged 18 or older. We excluded patients with
 (e.g.,  9 h of sleep per night) are at          established cognitive impairment and those with a
 greater risk of mortality and morbidity[6].              previous diagnosis of sleep disorders. Sleep
 Despite the importance of sleep, the prevalence of       disorders were defined as a self-reported presence
 poor sleep is still a serious global concern.            or proven medical history of any of the following
 Approximately 1 in every three individuals in the        conditions: insomnia, sleep apnea, narcolepsy,
 United States suffers from insufficient sleep or         restless leg syndrome (RLS), non-24-Hour sleep-
 poor sleep quality[7]. In Europe, the estimates          wake disorder, and parasomnias.
 indicate a prevalence of poor sleep ranging from         Variables
 30 to 38%[8,9], with cross-national surveys              Sociodemographic and clinical variables
 revealing that 31% of the study participants             The following variables were included in the
 reported waking up at least three nights per week        questionnaire: sex, date of birth, marital status,
 [10]
      . Estimates from China[11], South American          educational level, current employment status, and
                                                          monthly income. We also assessed pre-existing

 Ahlam Al Mutairi et al JMSCR Volume 10 Issue 03 March 2022                                         Page 104
JMSCR Vol||10||Issue||03||Page 103-112||March 2022 medical conditions via self-report and recorded estimate a variable with 50% prevalence. We variables associated with sleep hygiene, such as increased the number of participants to 400 to caffeine intake, smoking, physical exercise, and allow for possible missing data. use of electronic devices at bedtime. Statistical Methods The questionnaire was pilot-tested and We summarized data as mean (standard deviation, standardized based on a preliminary evaluation of SD) for variables with a normal distribution and 10 randomly chosen participants. utilized median (interquartile range, IQR) to Sleep Quality describe variables with a skewed distribution. We used the Pittsburgh sleep quality index (PSQI) Categorical variables were presented as numbers to assess sleep quality in the studied (percentage or exact 95% confidence intervals, population[14]. The PSQI is a self-reported 95% CI). We constructed univariable and questionnaire that captures acute sleep multivariable linear regression models to test the disturbances (previous month). That tool has been association between sociodemographic and widely used to evaluate sleep quality worldwide. clinical characteristics with PSQI and the It contains 19 items measuring different sleep association between PSQI with health-related domains such as subjective sleep quality, sleep quality of life. In multivariable models latency, duration, sleep disturbance, use of investigating the association of PSQI with health- sleeping medications, and daytime dysfunction related quality of life, we included sex, over the last one month. Each domain is scored employment status, and physical exercise only as from 0 to 3, with higher scores representing worse predictors. Those three variables were defined a acute sleep quality. The overall sleep quality can posteriori as the minimum set of confounding range from 0 (high sleep quality) to 21 (low sleep variables. We carefully performed model quality)[14]. As suggested by Shahid et al., we diagnostics and calculated the variance inflation considered an overall PSQI score > 5 as an factor (VIF). All models had a mean VIF < 2.0, indicator of poor acute sleep quality[14]. We used indicating a low risk of multicollinearity. the Arabic PSQI version for this investigation, We performed all analyses in the Statistical which has been validated previously[15]. Package for Social Sciences (version 21, SPSS Health-related quality of life Inc, Chicago, Ill). All tests were two-sided, and P- We also assessed health-related quality of life via values < 0.05 were considered statistically the health-related quality-of-life questionnaire significant. short-form SF-12 Health Survey (SF-12). The SF- 12 contains 12 questions assessing mental and Results physical functioning and overall health-related Characteristics of the studied participants quality of life over the last month. Higher scores Overall, 400 participants completed the survey on the examined subscales suggest a better quality and were included in the analysis. The median of life. The Arabic SF-12 version was used[16]. (IQR) age of participants was 36 (26 to 46) years; Sample Size 206 (52%) were male, with a mean (SD) BMI of We distributed the questionnaire to the 27.6 (5.7) kg/m2. Most participants were participants in each center two days per week. employed (208 of 391, 53%), with approximately Both days and the patients selected to participate two-thirds married (273 of 398, 69%). Table 1 were randomly chosen based on computer- summarizes the demographic and clinical generated lists. Under the assumption of infinite characteristics of the participants. population size and between-institution homogeneity (e.g., intraclass correlation coefficient equal to zero), we calculated that 385 participants would allow a 5% margin of error to Ahlam Al Mutairi et al JMSCR Volume 10 Issue 03 March 2022 Page 105
JMSCR Vol||10||Issue||03||Page 103-112||March                                                        2022
 Table 1 Demographic characteristics of the study sample (N = 400).
                    Variable                                                 Descriptive statistic
                    Education status, No. (%)
                    No formal education (illiterate)                                 5 (1)
                    Primary to secondary education                                 147 (37)
                    Tertiary education                                             248 (62)
                    Monthly income in SAR*, No (%)
                    < 5000                                                         53 (19)
                    5000-10000                                                     96 (35)
                    10001-15000                                                    66 (24)
                    > 15000                                                        59 (21)
                    Marital Status¶, No. (%)
                    Single                                                         109 (27)
                    Married                                                        273 (69)
                    Widow                                                           7 (1.8)
                    Divorced                                                        9 (2.2)
                    Smoking¶, No. (%)                                               68 (17)
                    Coffee/tea drinking†, No. (%)                                  338 (86)
                    Physical exercise‡, No. (%)                                    163 (41)
                    BMI status#, No. (%)
                    Underweight (BMI  5, we

 Ahlam Al Mutairi et al JMSCR Volume 10 Issue 03 March 2022                                              Page 106
JMSCR Vol||10||Issue||03||Page 103-112||March 2022
Table 2 Characteristics of sleep quality and duration in the studied sample (N = 400)
Variable Descriptive statistic
Sleep duration (per 24-hour period), median (IQR) 7 (6 to 8)
Subjective sleep quality*, No. (%)
Very good 172 (43)
Fairly good 164 (41)
Fairly poor 44 (11)
Very poor 19 (5)
Sleep latency¶, No. (%)
0 70 (19)
1–2 145 (39)
3–4 115 (31)
5–6 45 (12)
Sleep efficiency in %†, No. (%)
>85 255 (70)
75–84 46 (13)
65–74 22 (6)JMSCR Vol||10||Issue||03||Page 103-112||March 2022
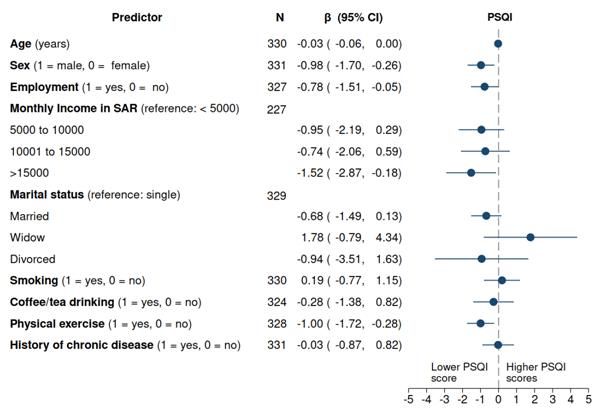
Figure 1. Caterpillar plot showing univariable linear regression coefficients. β denotes the change in the
PSQI score per unit increment in the predictor. SAR denotes Saudi Arabian Riyal. For binary predictors
(e.g., male [1] vs female [0]), β denotes the mean difference between the groups. Circles indicate the β
estimates, and horizontal lines represent their corresponding 95% confidence intervals (CI). Results are
considered statistically significant when 95% CIs do not cross the dashed vertical line at α = 5% (e.g.,
P< 0.05). N denotes the sample size (i.e., the number of patients with complete data) for the analysis.
In a multivariable model (Table 3), only physical active vs sedentary participants, mean difference:
exercise remained a statistically significant -0.97, 95% CI = -1.89 to - 0.07, P = 0.03,
independent predictor of PSQI scores (Physically controlling for all other variables in the model).
Table 3 Multivariable linear regression model for PSQI scores (N = 220)*.
Variable β (95% CI) P
Age (year) -0.020 (-0.0008, 0.04) 0.48
Sex (1 = male, 0 = female) -0.83 ( -1.92, 0.26) 0.13
Monthly income in SAR*, No (%)
< 5000 Reference
5000-10000 -0.016 (-1.58, 1.52) 0.98
10001-15000 0.81 (-0.91, 2.52) 0.35
> 15000 -0.046 ( -1.82, 1.73) 0.96
Marital Status¶, No. (%)
Single Reference
Married -0.26 ( -1.65, 1.12) 0.71
Widow 1.31 ( -2.69, 5.31) 0.52
Divorced -3.96 ( -8.22, 0.30) 0.07
Smoking(1 = yes, 0 = no) 0.61 (-0.61, 1.82) 0.32
Coffee/tea drinking (1 = yes, 0 = no) 0.27 ( -1.34, 1.88) 0.74
Physical exercise (1 = yes, 0 = no) -0.97 (-1.88, -0.07) 0.03
Reported having history of chronic diseases -0.57 (-1.76,0.62) 0.34
(1 = yes, 0 = no)
SAR denotes Saudi Arabian Riyal. β denotes the female [0]), β denotes the mean difference
change in the PSQI score per unit increment in the between the groups.
predictor. For binary predictors (e.g., male [1] vs
Ahlam Al Mutairi et al JMSCR Volume 10 Issue 03 March 2022 Page 108JMSCR Vol||10||Issue||03||Page 103-112||March 2022
The coefficient of determination was 2%, meaning 0.001) in the SF-12 mental component scale
that the predictors explained 2% of the variance (Figure 2). Similar results were observed for the
in PSQI scores in the study sample. SF-12 global component, in which a unit increase
* The total sample size is less than the initial in PSQI was associated with an average reduction
number of participants due to missing data. of 0.78 (95% CI = 0.61 to 0.95, P< 0.001) in the
SF-12 global score. No evidence of an association
Association of PSQI with quality of life was identified between PSQI score and the SF-12
In univariable analyses, quality of life was physical component scale (beta = -0.17, 95% CI =
inversely associated with PSQI scores (Table 4). -0.43 to 0.09, P = 0.19).
Each additional unit in the Pittsburgh Sleep In multivariable analyses, results were similar
Quality Index was associated with an average after adjustment for sex, employment status or
reduction of 1.4 units (95% CI, 1.09 to 1.70, P< physical exercise (Table 4).
Table 4 Association of PSQI with quality of life.
Variable N β (95% CI) P
Univariable model
SF-12 global component 324 -0.78 (-0.95, -0.611) < 0.001
SF-12 mental component 324 -1.40 (-1.70, -1.09) < 0.01
SF-12 physical component 324 -0.17 (-0.43, 0.09) 0.19
Multivariable model*
SF-12 global component 318 -0.72 (-0.90, -0.55) < 0.001
SF-12 mental component 318 -1.32 (-1.63, -1.00) < 0.001
SF-12 physical component 318 -0.13 (-0.40, 0.14) 0.34
β denotes the change in the SF-12 components per unit increment in the PSQI scores. 95% CI denotes 95%
confidence intervals. N denotes the sample size, which may be less than the total number of participants due
to missing data.
* Multivariable linear regression model adjusted for sex, employment status and exercise.
Figure 2. Scatter plot with imposed linear regression line. Results show in inverse association of PSQI with
SF-12 global scores (univariable model). Higher PSQI scores are associated with lower SF-12 global scores
(P< 0.001). 95% CI denotes 95% confidence interval. PSQI denotes. PSQI denotes the Pittsburgh Sleep
Quality Index. SF-12 denotes the 12-Item Short Form Health Survey.
Ahlam Al Mutairi et al JMSCR Volume 10 Issue 03 March 2022 Page 109JMSCR Vol||10||Issue||03||Page 103-112||March 2022
Discussion Despite growing international evidence on the
Principal findings ubiquitous role of sleep quality in human health,
This survey characterized the sleep profile of a over the past decade, few studies have been
young adult population served in the primary care conducted regarding the sleep quality in the
setting in Riyadh, Saudi Arabia. Overall, our general Saudi population, with a scarcity of
results indicated that one in every six patients information regarding the population served in the
reported poor sleep quality. Of note, both primary care setting. Most published
modifiable and non-modifiable factors seemed to investigations have characterized the sleep profile
be associated with sleep quality. In this regard, of Saudi university students and specific disease
women were associated with lower sleep quality populations. For instance, Al-khani et al. (2019)
than men. Conversely, higher monthly income and demonstrated that approximately 63% of medical
practice of physical exercise were correlated with students in Saudi Arabia report poor sleep
better sleep quality. We also found a statistically quality[26]. The authors found that a higher
significant inverse association between health- proportion of "poor sleepers" were among those
related quality of life and PSQI scores. physically inactive than among those physically
active. In the same vein, Darraj et al. (2018)
Comparison with previous studies evaluated a population of Saudi type-2 diabetes
Several large cohort studies from China[17], patients from Jazan[27]. According to the authors,
Europe[18] and the United States[19] have shown the prevalence of poor sleep quality was 55%, and
that sleep deprivation generates deleterious effects women were almost four times more likely to
on metabolism, immune system and quality of report low sleep quality than men[27].
life. Meta-analysis studies concur with this notion. By including a more generalizable and
For example, Itani et al. (2017) evaluated data representative population, the present study
from over 5 million participants via a meta- extends these previous investigations highlighting
analysis of 153 observational studies[20]. Using the favourable impact of physical activity on sleep
primarily information from subjective sleep quality, the positive association between sleep
duration, the authors concluded that short sleep quality and quality of life, and the female gender
duration was associated with a statistically as a prognostic factor for low sleep quality.
increased risk of all-cause mortality, type-II Notably, the importance of a greater awareness
diabetes, arterial hypertension, obesity and regarding sleep medicine in Saudi Arabia,
cardiovascular diseases[20]. particularly among primary care physicians, has
Besides the link between sleep patterns and the been highlighted by recent reports[28,29]. Thus,
development of cardiovascular-related chronic besides providing new data recognizing that poor
diseases, it has been shown that sleep quality can sleep quality can be a public health concern in
influence mental health. By employing a sample Saudi Arabia, our findings reveal a pertinent niche
of over 25,000 participants, Dong et al. reported a for future experimental research in this country,
significant U-shaped association between sleep especially in relation to investigating non-
duration and depression[21]. Furthermore, the data pharmacological interventions [30] that can
from Sella et al. suggested a positive correlation improve sleep quality among Saudi patients
between self-reported sleep quality and quality of served in the primary care setting.
life[22]. Their conclusions have been extensively
substantiated in a wide range of populations, from Limitations
individuals with chronic pain conditions[23], Our investigation has important limitations that
pregnant women[24] to patients with chronic should be acknowledged. First, our survey was
kidney disease[25]. restricted to the Saudi primary care setting and is
not necessarily generalizable to other centres,
Ahlam Al Mutairi et al JMSCR Volume 10 Issue 03 March 2022 Page 110JMSCR Vol||10||Issue||03||Page 103-112||March 2022
particularly to the general population. Second, a 2. Reimer MA, Flemons WW. Quality of life in
significant proportion of participants refrained sleep disorders. Sleep Med Rev 2003; 7:335-
from reporting complete information regarding 49.
some variables, generating missing data in the 3. Watson NF, Badr MS, Belenky G, Bliwise
analysis. Missing data is known to reduce DL, Buxton OM, Buysse D et al.
statistical power and diminish the precision in the Recommended Amount of Sleep for a
estimates (e.g., larger confidence intervals). Third, Healthy Adult: A Joint Consensus Statement
our study was based on a cross-sectional of the American Academy of Sleep Medicine
assessment. Therefore, we could neither infer the and Sleep Research Society. Sleep 2015;
long-term consequences of poor sleep nor 38:843-4.
establish causal effects of low sleep quality on 4. Strine TW, Chapman DP. Associations of
quality of life. Fourth, our analysis was primarily frequent sleep insufficiency with health-
based on self-report questionnaires and described related quality of life and health behaviors.
participants' subjective perceptions rather than Sleep Med 2005; 6:23-7.
laboratory-documented physiological data on 5. Tao F, Cao Z, Jiang Y, Fan N, Xu F, Yang H
sleep quality. et al. Associations of sleep duration and
quality with incident cardiovascular disease,
Conclusions cancer, and mortality: a prospective cohort
The findings of this survey demonstrated that poor study of 407,500 UK biobank participants.
sleep quality is highly prevalent in the primary Sleep Med 2021; 81:401-9.
care setting in Riyadh, Saudi Arabia, with one in 6. Yin J, Jin X, Shan Z, Li S, Huang H, Li P et
every six patients reporting poor sleep quality. al. Relationship of Sleep Duration With All-
Both modifiable (e.g. the practice of physical Cause Mortality and Cardiovascular Events:
exercise ) and non-modifiable (e.g. gender) factors A Systematic Review and Dose-Response
seemed to be associated with sleep quality. Meta-Analysis of Prospective Cohort Studies.
Women were associated with worse sleep quality J Am Heart Assoc 2017; 6.
than men, whereas higher monthly income and 7. Grandner MA. Epidemiology of insufficient
practice of physical exercise were correlated with sleep and poor sleep quality. Sleep and
better sleep quality. More studies are needed to health. Elsevier; 2019. 11-20.
elucidate the long-term consequences of poor 8. Léger D, Poursain B, Neubauer D, Uchiyama
sleep quality in health outcomes and the benefits M. An international survey of sleeping
population-wide and/or targeted interventions to problems in the general population. Curr Med
improve sleep in the Saudi population. Res Opin 2008; 24:307-17.
9. Madrid-Valero JJ, Martínez-Selva JM,
Disclosure Ribeiro do CB, Sánchez-Romera JF,
Authors have no conflict of interest, and the work Ordoñana JR. Age and gender effects on the
was not supported or funded by any drug prevalence of poor sleep quality in the adult
company. population. Gac Sanit 2017; 31:18-22.
10. Ohayon MM. Nocturnal awakenings and
References difficulty resuming sleep: their burden in the
1. Van Someren EJ, Cirelli C, Dijk DJ, Van CE, European general population. J Psychosom
Schwartz S, Chee MW. Disrupted Sleep: Res 2010; 69:565-71.
From Molecules to Cognition. J Neurosci 11. Simonelli G, Marshall NS, Grillakis A, Miller
2015; 35:13889-95. CB, Hoyos CM, Glozier N. Sleep health
epidemiology in low and middle-income
countries: a systematic review and meta-
Ahlam Al Mutairi et al JMSCR Volume 10 Issue 03 March 2022 Page 111JMSCR Vol||10||Issue||03||Page 103-112||March 2022
analysis of the prevalence of poor sleep cross-sectional study. J Affect Disord 2022;
quality and sleep duration. Sleep Health 296:183-8.
2018; 4:239-50. 22. Sella E, Miola L, Toffalini E, Borella E. The
12. Adams RJ, Appleton SL, Taylor AW, Gill relationship between sleep quality and quality
TK, Lang C, McEvoy RD et al. Sleep health of life in aging: a systematic review and
of Australian adults in 2016: results of the meta-analysis. Health Psychol Rev 2021;1-
2016 Sleep Health Foundation national 23.
survey. Sleep Health 2017; 3:35-42. 23. Menefee LA, Frank ED, Doghramji K,
13. Cuschieri S. The STROBE guidelines. Saudi Picarello K, Park JJ, Jalali S et al. Self-
J Anaesth 2019; 13:S31-S34. reported sleep quality and quality of life for
14. Shahid A, Wilkinson K, Marcu S, Shapiro individuals with chronic pain conditions. Clin
CM. Pittsburgh Sleep Quality Index (PSQI). J Pain 2000; 16:290-7.
STOP, That and One Hundred Other Sleep 24. Sut HK, Asci O, Topac N. Sleep Quality and
Scales. Springer; 2011. 279-283. Health-Related Quality of Life in Pregnancy.
15. Suleiman KH, Yates BC, Berger AM, Pozehl J Perinat Neonatal Nurs 2016; 34:302-9.
B, Meza J. Translating the Pittsburgh Sleep 25. Kumar B, Tilea A, Gillespie BW, Zhang X,
Quality Index into Arabic. West J Nurs Res Kiser M, Eisele G et al. Significance of self-
2010; 32:250-68. reported sleep quality (SQ) in chronic kidney
16. Al-Shehri AH, Taha AZ, Bahnassy AA, Salah disease (CKD): the Renal Research Institute
M. Health-related quality of life in type 2 (RRI)-CKD study. Clin Nephrol 2010;
diabetic patients. Ann Saudi Med 2008; 73:104-14.
28:352-60. 26. Al-Khani AM, Sarhandi MI, Zaghloul MS,
17. Zou C, Sun H, Lu C, Chen W, Guo VY. Ewid M, Saquib N. A cross-sectional survey
Nighttime sleep duration, restlessness and on sleep quality, mental health, and academic
risk of multimorbidity - A longitudinal study performance among medical students in
among middle-aged and older adults in Saudi Arabia. BMC Res Notes 2019; 12:665.
China. Arch Gerontol Geriatr 2021; 27. Darraj A, Mahfouz MS, Alsabaani A, Sani M,
99:104580. Alameer A. Assessment of sleep quality and
18. Anujuo K, Agyemang C, Snijder MB, Jean- its predictors among patients with diabetes in
Louis G, van den Born BJ, Peters RJG et al. Jazan, Saudi Arabia. Diabetes Metab Syndr
Contribution of short sleep duration to ethnic Obes 2018; 11:523-31.
differences in cardiovascular disease: results 28. Bahammam AS. Sleep medicine in Saudi
from a cohort study in the Netherlands. BMJ Arabia: Current problems and future
Open 2017; 7:e017645. challenges. Ann Thorac Med 2011; 6:3-10.
19. Ayas NT, White DP, Manson JE, Stampfer 29. Saleem AH, Al Rashed FA, Alkharboush GA,
MJ, Speizer FE, Malhotra A et al. A Almazyed OM, Olaish AH, Almeneessier AS
prospective study of sleep duration and et al. Primary care physicians' knowledge of
coronary heart disease in women. Arch Intern sleep medicine and barriers to transfer of
Med 2003; 163:205-9. patients with sleep disorders. A cross-
20. Itani O, Jike M, Watanabe N, Kaneita Y. sectional study. Saudi Med J 2017; 38:553-9.
Short sleep duration and health outcomes: a 30. Cheung JMY, Jarrin DC, Ballot O, Bharwani
systematic review, meta-analysis, and meta- AA, Morin CM. A systematic review of
regression. Sleep Med 2017; 32:246-56. cognitive behavioral therapy for insomnia
21. Dong L, Xie Y, Zou X. Association between implemented in primary care and community
sleep duration and depression in US adults: A settings. Sleep Med Rev 2019; 44:23-36.
Ahlam Al Mutairi et al JMSCR Volume 10 Issue 03 March 2022 Page 112You can also read