EXPANDING MEDICAID THE ECONOMIC IMPACT OF IN ALABAMA - Public Affairs Research Council of ...
←
→
Page content transcription
If your browser does not render page correctly, please read the page content below
THE ECONOMIC IMPACT OF

EXPANDING MEDICAID
IN ALABAMA
This research was conducted with the generous support of

                       Thank you.
THE ECONOMIC IMPACT OF
 EXPANDING MEDICAID IN
       ALABAMA
©2022 Public Affairs Research Council of Alabama

                Jennifer Green, Director
Center for Economic Development and Business Research
              Jacksonville State University

       Khadijah Edwards, MSHI, Ph.D. Candidate
                 Samford University

                      Ryan Hankins
                   Executive Director
      Public Affairs Research Council of Alabama

          Cover Design: Awful Cool Industries
TABLE OF CONTENTS Executive Summary .................................................................................................................................................. 1 Introduction ................................................................................................................................................................. 2 Methodology ............................................................................................................................................................... 6 Findings ......................................................................................................................................................................... 8 Funding Medicaid Expansion ............................................................................................................................... 17 Conclusion ................................................................................................................................................................ …18 APPENDIX Projected annual costs of Medicaid expansion in Alabama, 2022 to 2027………………………….….… 20 LIST OF TABLES Table 1. Estimated Medicaid Expansion Population by Type of Health Insurance Coverage…… 9 Table 2. Total Estimated Annual Cost of Medicaid Expansion in Alabama…………………………………..10 Table 3. Estimate of Projected Savings in Traditional Medicaid from a Two-Year Increase in the FMAP Rate…………………………………………………………………………………………………………………………………….……. 11 Table 4. Projected Savings from Providing People with Disabilities Full Medicaid Coverage... 13 Table 5. Projected Savings from Providing Pregnant Women with Full Expanded Medicaid Coverage…………………………………………………………………………………………………………………………..………………………. 14 Table 6. Projected Savings in Other Services with Expanded Medicaid……………………………………… 15 Table 7. Projected Annual Savings from Medicaid Expansion……………………………………………………….. 15 Table 8. Projected Annual Net Savings from Medicaid Expansion……………………………………………….. 16 Table 9. Projected Net Economic Impact of Medicaid Expansion………………………………………………... 17 LIST OF FIGURES Figure 1. Medicaid Enrollees, FY 2019…………………………………………………………………………………………………… 4 Figure 2. Medicaid Expenditures, FY 2019…………………………………………………………………………………………… 4 Figure 3. REMI PI+ v2.5 Model Linkages………………………………………………………………………………………………. 7
The Economic Impact of Expanding
                    Medicaid in Alabama

Executive Summary
The Public Affairs Research Council of Alabama and the Center for Economic Development
and Business Research at Jacksonville State University conducted an economic impact
analysis of potential expansion of Medicaid in Alabama to cover adults up to 138% of the
federal poverty level.

We find that expanding Medicaid could:

●   increase Medicaid enrollment by as many as 283,636 people.

●   cost an average of $225.4 million above current Medicaid expenditures over the next
    six years.

●   yield estimated average annual savings of $397.8 million over those same six years,
    more than enough to cover projected costs.

●   create an average of 20,083 new jobs per year over the next six years

●   have an estimated average economic impact of $1.89 billion per year over the next
    six years.

The analysis was based on data drawn from the U.S. Census Bureau and data provided by
state agencies, including the Alabama Departments of Corrections, Human Resources, Public
Health, Medicaid, and Mental Health.

The analysis assumes current state and federal policies remain in place over the next six
years, allowing for phase-outs and other changes already written into law. The analysis also
does not include any potential changes to state and federal Medicaid policy stemming from
the current federal budget reconciliation package introduced in Congress in November 2021.

The analysis was supported by the Daniel Foundation of Alabama, the Community
Foundation of Northeast Alabama, the Community Foundation of Greater Birmingham, the
Mike and Gillian Goodrich Foundation, and the Women’s Foundation of Alabama.

 PARCALABAMA.ORG
                                               1
Introduction
Medicaid is a federal healthcare program administered by the states. Medicaid serves more
than 72.5 million Americans, including parents, children, expectant mothers, senior citizens,
and individuals with disabilities. States must meet minimum service levels and expenditures.
There is substantial variance in eligibility, services provided, and expenditures among the
states.
The Affordable Care Act, passed in 2010, required states to expand Medicaid coverage to all
adults up to 138% of the federal poverty level.1 In return, the federal government would
assume 100% of the costs of the expansion population through 2016 before a gradual step
down to 90% by 2020 and remaining at 90% in future years. This so-called Medicaid mandate
would “expand/extend Medicaid coverage to cover nearly all low-income Americans under
age 65.”2 Expanded Medicaid, together with Medicare, employer-provided insurance, existing
programs for low-income children, and the then-new health insurance exchanges would
provide health insurance to almost all Americans. Indeed, by 2016, national “uninsured rates
dropped to 8.8% in 2016—the lowest level of uninsured individuals in U.S. history since rates
have been tracked.”3
In 2012, the Supreme Court struck down the Medicaid mandate.4 Since that ruling, states have
had the option to expand Medicaid but are not required to do so. Likewise, states that choose
to expand may reverse that decision. To date, 38 states have expanded Medicaid. No state
has reversed its decision.
In all states, territories, and the District of Columbia, the federal government continues to
cover the majority of Medicaid expenses for so-called traditional Medicaid—those populations
enrolled prior to 2014. In fiscal year 2022, the federal government funds an average of 60.15%
of those expenses. In Alabama, the federal share is 72.37%, the fifth highest in the country.5 In
1Technically, the threshold is 133%, however the Act exempts, or disregards, the first 5% of income,
making the effective rate 138%.
2Medicaid.gov. N.d. “Eligibility.” Retrieved from
https://www.medicaid.gov/medicaid/eligibility/index.html
3 Gaille, Louise. 23 February 2018. “13 Biggest Medicaid Expansion Pros and Cons.” Retrieved
from https://vittana.org/13-biggest-medicaid-expansion-pros-and-cons.
4 National Federation of Independent Business v. Sebelius, 567 U.S. 519 (2012).
5 “Federal Financial Participation in State Assistance Expenditures; Federal Matching Shares for
Medicaid, the Children's Health Insurance Program, and Aid to Needy Aged, Blind, or Disabled Persons
for October 1, 2021 Through September 30, 2022.” Federal Register 85:230 (30 November 2020) p.
76586.
PARCALABAMA.ORG
2the 38 states that have chosen to expand Medicaid, the federal government covers 90% of
the cost of those populations added to Medicaid since 2014.
Alabama joins Florida, Georgia, Kansas, Mississippi, North Carolina, South Carolina, South
Dakota, Tennessee, Texas, Wisconsin, and Wyoming as the states that have not expanded
Medicaid and thus do not receive the enhanced federal match rate.6
Medicaid in Alabama
Alabama Medicaid has among the strictest eligibility requirements in the nation. Currently,
Alabama provides Medicaid services to people who meet strict income guidelines based
on the federal poverty line and who meet one or more of these qualifications:
● Under the age of 19
● Caretaker, with extremely low income, of someone under the age of 197
● Pregnant
● Adult aged 65 or over who cannot afford to pay Medicare premium
● Legally blind
● Disabled
● In a nursing home
Each of these programs have varying requirements and income limits.8 It is important to note
that adults who do not fall into one of the categories above, or who do but exceed the
income limits, are not covered. In other words, an adult who is low-income, unemployed, or
even homeless but has no disability or no dependent children is likely not covered by
Medicaid in Alabama.
Most enrollees are children. See Figure 1.9 Most expenditures are for people with disabilities.
See Figure 2.10
6 “Status of State Medicaid Expansion Decisions: Interactive Map.” Kaiser Family Foundation. Retrieved
from https://www.kff.org/medicaid/issue-brief/status-of-state-medicaid-expansion-decisions-
interactive-map/
7 Current income limits of a parent/caretaker are 13% of the federal poverty line.
8“Medicaid Income Limits for 2021” Alabama Department of Medicaid.
https://medicaid.alabama.gov/documents/3.0_Apply/3.2_Qualifying_Medicaid/3.2_Medicaid_Income_L
imits_2021.pdf
9Alabama Medicaid Agency FY 2019 Annual Report Retrieved from
https://medicaid.alabama.gov/documents/2.0_Newsroom/2.3_Publications/2.3.5_Annual_Report_FY19
/2.3.5_FY_19_Annual_Report_Bookmarked_6-29-21.pdf
PARCALABAMA.ORG
3Figure 1. Medicaid Enrollees, FY 2019
Figure 2. Medicaid Expenditures, FY 2019
In fiscal year 2020, Alabama spent $7.7 billion on Medicaid, of which $820 million, or
approximately 11%, was allocated through the General Fund. The Medicaid appropriation
accounts for 31.3% of the General Fund and 7.8% of the combined General Fund and
Education Trust Fund appropriations. About 28% of Medicaid expenses are funded from other
state sources. The vast majority of Medicaid expenses, approximately 71%, is funded by the
federal government.11,12
Medicaid Expansion in Alabama
Although Alabama has not expanded Medicaid, interest in the topic remains high. Many, but
not all, healthcare organizations, hospitals, and providers have expressed support for
expansion, as have various advocacy and interest groups. The Alabama Hospital Association
Alabama Medicaid Agency FY 2019 Annual Report Retrieved from
10
https://medicaid.alabama.gov/
documents/2.0_Newsroom/2.3_Publications/2.3.5_Annual_Report_FY19 /2.3.5_FY_19_Annual_Report_
Bookmarked_6-29-21.pdf
11
“State of Alabama General Fund Fiscal Year 2021 Appropriations as of September 30, 2021.” Executive
Budget Office, Alabama Department of Finance. Retrieved from https://budget.alabama.gov/wp-
content/uploads/2021/10/GF-SEP-FY21.pdf
12 Alabama Medicaid Agency FY 2019 Annual Report Retrieved from
https://medicaid.alabama.gov/
documents/2.0_Newsroom/2.3_Publications/2.3.5_Annual_Report_FY19 /2.3.5_FY_19_Annual_Report_
Bookmarked_6-29-21.pdf
PARCALABAMA.ORG
4has noted that due to the lack of funds, hospitals throughout the state are closing or planning
to close. Eight rural hospitals in Alabama have closed between 2011 and 2020.13 A report
issued by the Center of Healthcare Quality and Payment reform, published before the COVID-
19 pandemic, estimated 30 Alabama hospitals are at risk of closure.14 It has projected that an
expansion to Medicaid in Alabama would aid in keeping hospitals afloat, especially in rural
areas.
The number of uninsured people would also certainly decline with Medicaid expansion.
An estimated 340,000 people in Alabama could access to Medicaid under expansion.
15
Alabama. Depending on how many people newly eligible accept the coverage, Alabama
could see its uninsured rate decline by 43%.16
State and local leaders have expressed varying opinions about expanding Medicaid. The cost
of expansion and the state’s ability to pay for expansion are frequent concerns expressed by
state leaders. These concerns can be seen in recent comments by Governor Kay Ivey, who
said: “It would be irresponsible to think about expanding Medicaid just for the sake of
expanding Medicaid without having a complete and honest discussion about the source of
stable funding to pay the match…it is an option. I’m aware of the interest that’s there. But
there’s a lot of exploring that has to be done on how you pay for it.”17
This analysis was conducted to answer, in part, questions raised by Governor Ivey and other
policymakers. The analysis was conducted by the Public Affairs Research Council and the
Center for Economic Development and Business Research at Jacksonville State University
13“180 Rural Hospital Closures Since January 2005.” The Cecil. G. Sheps Center for Health Services
Research. University of North Carolina. https://www.shepscenter.unc.edu/programs-projects/rural-
health/rural-hospital-closures.
14 “Alabama Rural Hospitals: Caring for Rural Communities.” Alabama Hospital Association. 2021.
Retrieved from https://www.alaha.org/app/uploads/2021/08/Rural-PPT-Aug-2021.pptx.
15Ku, Leighton. Erin Brantkey. “The Economic and Employment Effects of Medicaid Expansion Under
the American Rescue Plan.” May 2021. The Commonwealth Fund. Retrieved from
https://www.commonwealthfund.org/publications/issue-briefs/2021/may/economic-employment-
effects-medicaid-expansion-under-arp.
16Simpson, M. “The Implications of Medicaid Expansion in the Remaining States: 2020 Update.” June
2020. The Robert Wood Johnson Foundation. Retrieved from
https://www.rwjf.org/en/library/research/2020/06/the-implications-of-medicaid-expansion-in-the-
remaining-states--2020-
update.html?cid=xem_other_unpd_ini:quickstrike_dte:20200608_des:medicaid%20exp
17Whites-Koditschek, Sarah. 16 April 2020. “Why Hasn’t Alabama Expanded Medicaid During the
Pandemic?” Retrieved from https://www.al.com/coronavirus/2020/04/why-hasnt-alabama-
expanded-medicaid-during-the-pandemic.html.
PARCALABAMA.ORG
5with support from the Daniel Foundation of Alabama, the Community Foundation of
Northeast Alabama, the Community Foundation of Greater Birmingham, the Mike and Gillian
Goodrich Foundation, and the Women’s Foundation of Alabama.
This report makes no recommendation regarding Medicaid expansion. The analysis is a fiscal
and economic study based on the best and most recent data available and recent changes to
federal law.
Methodology
Jacksonville State University’s Center for Economic Development and Business Research
utilized a proprietary dynamic economic impact model known as REMI PI+ (version 2.5)18 to
perform a macroeconomic impact analysis of the potential Alabama Medicaid expansion over
the six-year period from 2022–2027.
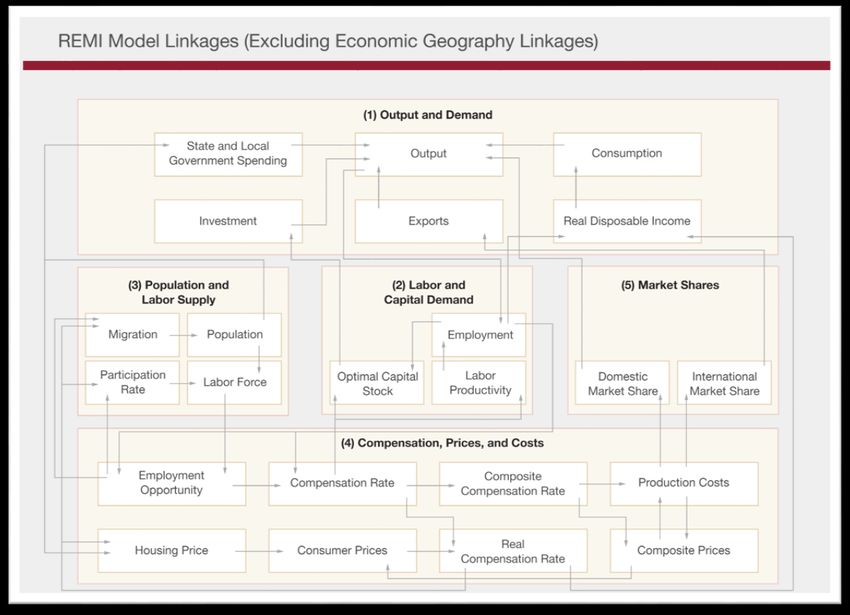
REMI PI+ is a widely used structural economic forecasting and policy analysis model,
integrating several analytic techniques, including input-output, computable general
equilibrium (CGE), econometric, and economic geography methodologies.
The model is dynamic, with forecasts and simulations generated on an annual basis to include
behavioral responses to wage, price, and other economic factors. REMI can be used for
estimating national, regional, and state-level impacts of policy changes, such as the expansion
of Alabama Medicaid analyzed in this study. The dynamic modeling framework supports the
option to forecast how changes in the economy, and adjustments to those changes, will occur
on a year-by-year basis. The three primary advantages of the REMI model over other input-
output models are that “(1) it depicts the role that prices exert on household and business
decisions; (2) prices ‘adjust’ to solve supply and demand imbalances for labor, capital, and
other input markets; and (3) it allows for the estimation of year-by-year (annual) impacts and
forecasts, whereas other models only provide static representations of the economy.”19 Figure
3 illustrates the REMI PI+ model linkages.
18 Regional Economic Models, Inc. 20201. “Models.” Available at https://www.remi.com/model/pi/
19 “Methodology for NRDC Economic Impact Analysis.”
PARCALABAMA.ORG
6Figure 3. REMI PI+ v2.5 Model Linkages
This analysis includes both the new healthcare spending in Alabama and the potential
reduction of state spending on health services if more of those services were covered
through Medicaid expansion.
State-level data are provided by Alabama Medicaid, the Alabama Department of Corrections,
the Alabama Department of Mental Health, and the Alabama Department of Public Health.
Demographic data are provided by the 2019 American Community Survey produced by the
U.S. Census Bureau. Demographic data are restricted to individuals in households ages 19–64
with income at or below 138% the federal poverty level, $25,750 for a family of four in 2019.
We further refined the data to identify the number of individuals with no health insurance,
employer-provided health insurance, health insurance coverage purchased through the
federal marketplace, and the number of individuals with Medicaid coverage. Economic
impacts are reported for new jobs created, population, real gross domestic product (GDP),
personal income, and economic output.
PARCALABAMA.ORG
7The analysis draws upon work done and models used by Becker,20 Miller and Collins,21 and
Striar, Boozang, and Mann.22
Caveats
We presume that current federal and state policies will remain in place over the next six
years.
We do not consider the impact of expected cuts to the Disproportional Share (DSH)
payments from the federal government to the state set to phase out between 2024 and 2028.
We do not consider any possible changes to Medicaid proposed in the current budget
reconciliation legislation.23
We do not explore policy changes that would expand the ability of pharmacists, nurse
practitioners, and other health care providers to provide direct patient care.
Findings
Expanding Medicaid in Alabama will increase state expenditures and the total amount of
federal funding coming into the state. The effects of expansion vary by Medicaid program.
These are discussed below. The largest single change in Medicaid would be the number of
new Medicaid enrollees.
20
Becker, David. “Medicaid Expansion in Alabama: Revisiting the Economic Case for Expansion.” January
2019. University of Alabama at Birmingham.
21
Miller, J. Corey and Sandra Collins. “A Fiscal and Economic Analysis of Medicaid Expansion in
Mississippi Under the Affordable Care Act.” September 2021. University Research Center, Mississippi
Institutions of Higher Learning. Retrieved from
http://www.mississippi.edu/urc/downloads/urcmedicaid2021.pdf
22
Striar, Adam, Patricia Boozang, Cindy Mann. “Assessing the Fiscal Impact of Medicaid Expansion in
Mississippi.” November 2021. Manatt. Retrieved from
https://www.manatt.com/Manatt/media/Documents/Articles/RWJF-CF_Fiscal-Impact-of-Medicaid-
Expansion-in-MS-Nov-2021_b.pdf.
23Park, Edin, et. al. “Build Back Better Act: Health Coverage Provisions Explained.” Georgetown
University Health Policy Institute. November 2021. https://ccf.georgetown.edu/wp-
content/uploads/2021/11/Build-Back-Better-FINAL-Nov19.pdf
PARCALABAMA.ORG
8Expanded Medicaid Enrollment
Based on 2019 ACS estimates in Alabama, there are 650,999 individuals ages 19–64 with
annual incomes below 138% of the federal poverty line who would thus be eligible to enroll in
expanded Medicaid.
Almost 61% of this population receive employer-provided health insurance coverage, 10.9%
purchase health insurance coverage through the federal marketplace, and 13.6% currently
receive Medicaid coverage. The balance, 14.6%, are uninsured.
Eligible to enroll does not mean enrolled. People newly eligible for Medicaid may not know
they are eligible or may not choose to participate. Following the work of the Urban Institute24
and David Becker25, we estimate the take-up percentage, the percent of people newly eligible
for Medicaid who will choose the coverage. We estimate 79% of those uninsured will enroll in
Medicaid. For the population that have employer-provided health insurance, the take-up rate
is estimated to be 15%. For those who purchase health insurance coverage from the federal
marketplace, the take-up rate is 85%. Finally, 100% of those people currently in Medicaid,
although perhaps in a limited form or for a limited time, such as pregnant women, will receive
enhanced services in the expanded Medicaid. Compiling these numbers, our estimated
Medicaid expansion population totals 283,636 people. See Table 1 below.
Table 1. Estimated Medicaid Expansion Population by Type of Health Insurance Coverage
Estimated Potential Expansion Population 650,999
Employer-
Type of Coverage Uninsured Marketplace Medicaid
Provided
Percent of Potential Expansion Population 14.6% 60.8% 10.9% 13.6%
Potential Expansion Population by Coverage 95,361 396,067 71,203 88,368
Projected Take-Up Rate 79.0% 15.0% 85.0% 100.0%
Projected Expansion Population 75,335 59,410 60,523 88,368
Total Projected Expansion Population 283,636
24 The Health Insurance Policy Simulation Model. The Urban Institute.
ttps://www.urban.org/research/data-methods/data-analysis/quantitative-data-
analysis/microsimulation/health-insurance-policy-simulation-model-hipsm
25Becker, D.J. 2019. “Medicaid Expansion in Alabama: Revisiting the Economic Case for
Expansion.” Alabama Hospital Association. Retrieved from https://www.alaha.org/wp-
content/uploads/ 2019/02/MedicaidExpansionUpdateJan31.pdf.
PARCALABAMA.ORG
9Expanded Medicaid Costs
Adding 283,636 people to the Alabama Medicaid rolls would increase annual Medicaid costs
by an average of $225.4 million per year. See Table 2 below. Additional costs would be
$208 million in 2022, rising to $243 million in 2027. For more details see the Appendix.
Table 2. Total Estimated Annual Cost of Medicaid Expansion in Alabama
Year Expenses
2022 $208,350,272
2023 $214,879,352
2024 $221,770,197
2025 $228,410,413
2026 $235,855,511
2027 $243,136,124
Total $1,352,401,868
Average $225,400,311
Expanded Medicaid Savings—Enhanced Federal Match Rates
We project average annual Medicaid expenses to increase by $225 million. However, Alabama
could see savings of more than $300 million in current Medicaid expenses in each of the first
two years of expansion. See Table 3.
These projected savings are the result of the enhanced federal match rate, or FMAP, for
traditional Medicaid in the first two years of expansion. FMAP rates are set via a formula that
considers population, poverty rate, and other variables. The fiscal year 2022 FMAP rate in
Alabama is 72.37%. In other words, the federal government will pay 72.37% of Medicaid
expenses.
The recently passed American Rescue Plan Act (ARPA) includes an incentive for states like
Alabama to expand Medicaid. Under ARPA, an extra 5 percentage points will be added to the
FMAP rate for all current enrollees for two years, if the state expands Medicaid. Thus, while
we project the 2022 FMAP rate to be 72.37%, a 5-point bump brings the rate to 77.37%.
If Alabama expanded Medicaid, the state would realize this enhanced FMAP on its traditional
Medicaid population for the first two years of expansion, thereby saving an estimated $619.4
million in those first two years.
PARCALABAMA.ORG
10Table 3. Estimate of Projected Savings in Traditional Medicaid from a Two-Year Increase in
the FMAP Rate
2020* 2021 2022 2023
Traditional Medicaid
956,823 939,600 922,687 918,074
Enrollment (ages 19–64)
Per Capita Expenditures $6,145 $6,372 $6,608 $6,853
Total Cost $5,879,677,335 $5,987,131,200 $6,097,115,696 $6,291,561,122
FMAP Rate 71.97%* 72.58%* 72.37%* 72.21%
Alabama Share 28.03%* 27.42%* 27.63%* 27.79%
Traditional Medicaid Cost
$1,283,604,580 $1,641,671,375 $1,684,633,067 $1,748,424,836
to Alabama
FMAP + 5% n/a n/a 77.37% 77.21%
Traditional Medicaid Cost
to Alabama with FMAP n/a n/a $1,379,777,282 $1,433,846,780
+5%
Traditional Medicaid
n/a n/a $304,855,785 $314,578,056
Savings from FMAP + 5%
Total Traditional Savings to
n/a n/a $619,433,841
Alabama from FMAP + 5%
Expanded Medicaid Savings—Special Populations
Expanding Alabama Medicaid would expand coverage to more than 283,000 Alabamians.
However, the state is already providing various targeted services, such as coverage during
pregnancy or for treatment of breast and cervical cancer, to many of the 283,000. The state
is responsible for between 28% and 100% of the costs of those services. With expansion,
many targeted services currently funded by the state for people who do not otherwise qualify
for traditional Medicaid would be covered by the federal government at 90%, reducing the
state share from between 28% and 100% to 10%.
For example, pregnant women who meet certain criteria are covered by Medicaid during their
pregnancy. The state is responsible for approximately 28% of these expenses. However, if
Alabama expands Medicaid, these patients would be included in the expansion population,
and eligible for the 90% federal match. The state’s share would be reduced by 18 percentage
points.
Other examples of these services include coverage for:
● people with disabilities
● breast and cervical cancer treatment
PARCALABAMA.ORG
11● family planning services
● mental health and substance abuse programs
● in-patient medical care of people in prison
● uncompensated care
Expanding full Medicaid coverage to those whom the state is already providing coverage will
result in significant savings.
To calculate these savings, we estimate the percent and number of Alabamians in each
category with incomes less than 138% of the federal poverty line. We then multiply that
number by Alabama Medicaid’s total per capita spending to estimate total spending for that
population. Total spending is then multiplied by the state’s current match rate (1-FMAP) to
estimate current expenditures. Current expenditures are subtracted from total spending times
10%, the amount the state must match under expansion, to calculate potential savings.
The Savings Formula
1. Traditional enrollment x percent of people in the category with incomes less than 138%
FPL = estimate of people currently covered
2. Estimate of people currently covered x per capita Medicaid expenditures = total
current expenditures
3. Total current expenditures x (1-FMAP) = estimated current costs to Alabama
4. Total expenditures x 10% = estimated expansion cost to Alabama
5. Estimated current costs - estimated expansion costs = projected savings
Using the above formula, we predict average annual savings in seven current programs and
services.
Savings in Services to People with Disabilities
In 2022, we project Alabama will spend $7 million on services for 20,299 people with
disabilities and incomes under 138% of the federal poverty line, based on the federal match
rate of 72.37%. Under expansion, the match rate for this group would jump to 90%, reducing
the state’s expenses from $37 million to $13.4 million, a savings of $23.6 million in 2022 and
$148.9 million over the next six years. See Table 4. For more details, see the Appendix.
PARCALABAMA.ORG
12Table 4. Projected Savings from Providing People with Disabilities Full Medicaid Coverage
2022 2023 2024 2025 2026 2027
Traditional
Medicaid 922,687 918,074 913,484 908,917 904,372 899,782
Enrollment
Share of
Disabled with
2.2% 2.2% 2.2% 2.2% 2.2% 2.2%
Incomes Below
138% FPL
Number of
Disabled with
20,299 20,198 20,097 19,996 19,896 19,795
Incomes Below
138% FPL
Per Capita
$6,608 $6,853 $7,107 $7,370 $7,643 $7,926
Expenditures
Total
$134,136,545 $138,414,345 $142,826,877 $147,371,802 $152,066,534 $156,896,787
Expenditures
FMAP 72.37% 72.21% 73.96% 73.46% 72.96% 72.46%
Alabama Match 27.63% 27.79% 26.04% 26.54% 27.04% 27.54%
Alabama
$37,061,927 $38,465,346 $37,192,119 $39,112,476 $41,118,791 $43,209,375
Expenditure
FMAP with
90% 90% 90% 90% 90% 90%
Expansion
Alabama Match
10% 10% 10% 10% 10% 10%
with Expansion
Alabama
Expenditure with $13,413,655 $13,841,434 $14,282,687 $14,737,180 $15,206,653 $15,689,679
Expansion
Savings $23,648,273 $24,623,912 $22,909,432 $24,375,296 $25,912,138 $27,519,696
Savings in Services to Pregnant Women
In 2022, we project Alabama will spend $53.9 million on services to 29,526 pregnant women
with incomes under 138% of the federal poverty line, based on the federal match rate of
72.37%. Under expansion, the match rate for this group would jump to 90%, reducing the
state’s expenses from $53.9 million to $19.5 million, an average savings of $34.3 million in
2022 and $222.6 million over the next six years. See Table 5 and the Appendix for more
detail.
PARCALABAMA.ORG
13Table 5. Projected Savings from Providing Pregnant Women with Full Expanded Medicaid
Coverage.
2022 2023 2024 2025 2026 2027
Traditional
Medicaid 922,687 918,074 913,484 908,917 904,372 899,782
Enrollment
Share of
Pregnant with
Incomes 3.2% 3.2% 3.2% 3.2% 3.2% 3.2%
Below 138%
FPL
Number of
Disabled with
Incomes 29,526 29,378 29,231 29,085 28,940 28,793
Below 138%
FPL
Per Capita
$6,608 $6,853 $7,107 $7,370 $7,643 $7,926
Expenditures
Total
$195,107,702 $201,329,956 $207,748,185 $214,358,985 $221,187,686 $228,213,508
Expenditures
FMAP 72.37% 72.21% 73.96% 73.46% 72.96% 72.46%
Alabama
27.63% 27.79% 26.04% 26.54% 27.04% 27.54%
Match
Alabama
$53,908,258 $55,949,595 $54,097,627 $56,890,875 $59,809,150 $62,850,000
Expenditure
FMAP with
90% 90% 90% 90% 90% 90%
Expansion
Alabama
Match with 10% 10% 10% 10% 10% 10%
Expansion
Alabama
Expenditure
$19,510,770 $13,841,434 $20,774,819 $21,435,899 $22,118,769 $22,821,351
with
Expansion
Savings $34,397,488 $42,108,161 $33,322,808 $35,454,976 $37,690,381 $40,028,649
Savings in Other Program Areas
The state could also see significant savings by shifting services in other programs funded by
the state at between 28% and 100% of the cost. As part of the expansion population, 90% of
those costs would be covered by the federal government, reducing the state share to 10%.
See Table 6.
PARCALABAMA.ORG
14Table 6. Projected Savings in Other Services with Expanded Medicaid
2022 2023 2024 2025 2026 2027
Breast and
Cervical Cancer
$3,595,094 $3,631,045 $3,667,356 $3,704,030 $3,741,070 $3,778,481
Treatment
Program
Family Planning
$32,567,502 $32,893,177 $33,222,109 $33,554,330 $33,889,873 $34,228,771
Services
Mental Health &
Substance
$42,000,000 $43,050,000 $44,126,250 $45,229,406 $46,360,141 $47,519,145
Abuse
Programs
Inpatient Care
$26,047,163 $26,307,634 $26,570,710 $26,836,417 $27,104,781 $27,375,828
of Prisoners
Reductions in
Uncompensated $116,614,797 $119,530,167 $122,518,421 $125,581,832 $128,720,916 $131,938,939
Care
Savings $220,824,556 $225,412,023 $230,104,846 $234,906,015 $239,816,781 $244,841,164
Over the next six years, the state could save an average of $232.6 million across five other
services. For detailed numbers, see appendices B through E.
Total Savings
When taken together, Medicaid expansion could result in savings to programs and services
currently provided by the state and results in a two-year enhanced federal match for
traditional Medicaid. These savings are projected to be $583.7 million in 2022. Total savings
over the six-year period are estimated at $2.38 billion with an average of $397.8 million.
The largest savings occur in the first two years. See Table 7.
Table 7. Projected Annual Savings from Medicaid Expansion
2022 2023 2024 2025 2026 2027
FMAP + 5% $304,855,785 $314,578,056 n/a n/a n/a n/a
Movement of
$23,648,273 $24,623,912 $22,909,432 $24,375,296 $25,912,138 $27,519,696
Disabled
Movement of
Pregnant $34,397,488 $42,108,161 $33,322,808 $35,454,976 $37,690,381 $40,028,649
Women
Breast and
Cervical Cancer
$3,595,094 $3,631,045 $3,667,356 $3,704,030 $3,741,070 $3,778,481
Treatment
Program
PARCALABAMA.ORG
15Family Planning
$32,567,502 $32,893,177 $33,222,109 $33,554,330 $33,889,873 $34,228,771
Services
Mental Health &
Substance
$42,000,000 $43,050,000 $44,126,250 $45,229,406 $46,360,141 $47,519,145
Abuse
Programs
Inpatient Care
$26,047,163 $26,307,634 $26,570,710 $26,836,417 $27,104,781 $27,375,828
of Prisoners
Reductions in
Uncompensated $116,614,797 $119,530,167 $122,518,421 $125,581,832 $128,720,916 $131,938,939
Care
Total Savings $583,726,102 $606,722,152 $286,337,086 $294,736,287 $303,419,300 $312,389,509
Net Savings
Projected annual savings exceed projected annual costs in each of the first six years. Savings
in years one and two are the highest, thanks to the enhanced federal match in the first two
years of expansion. Even after the enhanced match rates end, we project savings to exceed
the cost of expansion by at least $64 million per year and an average of $172.48 million over
the next six years.
Table 8. Projected Annual Net Savings from Medicaid Expansion
2022 2023 2024 2025 2026 2027 Average Total
$583.72 $606.72 $286.37 $294.73 $303.41 $312.38 $397.88 $2.387
Savings/Revenue
million million million million million million million billion
$208.35 $214.87 $221.77 $228.41 $235.85 $243.13 $225.40 $1.352
Expenses
million million million million million million million billion
$375.37 $391.84 $64.56 $66.32 $67.56 $69.25 $172.48 $1.034
Net
million million million million million million million billion
Economic Impact
The analysis by the PI+ model from REMI, Inc. finds that the economic impacts to Alabama
from entering Medicaid expansion are positive from 2022 to 2027. We analyzed the economic
impacts on the state during this six-year time period for jobs created, population, real gross
domestic product (GDP), personal income, and economic output.
Over the next six years, we project the net economic impact of Medicaid expansion on
Alabama to be an average of $1.89 billion annually. See Table 9.
PARCALABAMA.ORG
16These impacts are a result from the influx of federal government revenues. These federal
government revenues represent 90% percent of the costs of the Medicaid expansion
population and, during the first two years of expansion, a five-percentage point increase in
the FMAP on the traditional Medicaid population. This analysis also accounts for the
additional spending by the state for 10% of the cost of expansion. These report findings make
it evident that this additional spending is more than offset by the savings in the state
spending that occur from expansion.
Table 9. Projected Net Economic Impact of Medicaid Expansion
Category Units 2022 2023 2024 2025 2026 2027
Total New Jobs
21,973 23,526 18,660 18,790 18,779 18,767
Employment Created
Population Individuals 6,748 11,992 14,544 16,749 18,611 20,240
Fixed (2021) $1.821 $1.976 $1.606 $1.641 $1.661 $1.682
GDP
Dollars billion billion billion billion billion billion
Personal Fixed (2021) $1.160 $1.228 $1,031 $1.103 $1.145 $1.187
Income Dollars billion billion billion billion billion billion
Total Fixed (2021) $3.078 $3.336 $2.692 $2.741 $2.763 $2.787
Output Dollars billion billion billion billion billion billion
Funding Medicaid Expansion
Policymakers question the state’s ability to pay for Medicaid expansion. The question may not
be as challenging as it once was.
A Growing General Fund
General Fund revenues rose to almost $2.6 billion in fiscal year 2021, an increase of $262
million over the previous year. The General Fund ended with a surplus of $368 million, which
was allocated for prison construction.
No doubt some of the growth in the General Fund tax revenues can be attributed to the
growth in federal relief and stimulus payments to individuals and businesses during the
pandemic. Between 2017 and 2020, General Fund revenues grew by 33%. This growth was
driven in large part by sales taxes collected through online purchases. That tax generated
$192.7 million in revenue in fiscal year 2021 alone.26
26“Alabama Tax Revenues Surge in 2021.” October 26, 2021. The Public Affairs Research Council of
Alabama. Retrieved from https://parcalabama.org/alabama-tax-revenues-surge-in-2021/.
PARCALABAMA.ORG
17Increased Tax Revenue
As mentioned, we project significant growth in Alabama’s GDP, and with it, significant
expansion of tax collections. Due to Alabama’s two-budget system and the earmarking of tax
receipts, much of the new tax revenue generated by expansion will flow to the Education
Trust Fund, while expenses are funded through the General Fund. Such growth would see a
substantial influx of revenue to the ETF. It may also require legislators to re-examine tax
allocations, similar to what was done with the Simplified Sellers Use Tax in recent years.
Detailed tax revenue projections are beyond the scope of this analysis.
Medicaid Savings
No doubt, the simplest means of funding expansion is through the savings inherent in
expansion. As our analysis shows, expanding Medicaid would result in net savings over the
first six years. Savings would likely continue, but our analysis does not consider a longer time
horizon.
Net savings could be invested in a Medicaid trust fund to offset costs in future years. Were
100% of projected savings in the first six years invested in such a fund, the principal alone
could cover all or most of the expansion expenses for the next four years.
Net savings from Medicaid could be reinvested into current programs, such as those offered
by the Departments of Mental Health or Public Health, thereby expanding services at no
additional cost. Such enhanced health services to Alabamians could result in reduced
utilization of Medicaid-covered services, driving down the overall cost of Medicaid.
Conclusion
Expanding Medicaid to cover adults earning up to 138% of the federal poverty level, $25,750
for a family of four in 2019, would increase Medicaid enrollment by as many as 283,636
people.
Costs to the state would increase by an average of $225.4 million per year above current
Medicaid expenditures over the next six years, but the state would also see estimated
average annual savings of $397.8 million over those same six years. The average annual
savings of $172.4 million is more than enough to cover the cost of expansion.
Those savings would result from two years of an enhanced federal match rate for traditional
Medicaid and reducing state expenses from between 28% and 100% to 10% for those newly
covered by Medicaid expansion.
PARCALABAMA.ORG
18Projected annual economic impact of $1.89 billion is similar to the total amount of stimulus
funding Alabama received from the CARES Act in 2020. These findings are in line with
previous studies of expansion in Alabama27, Mississippi28, and in other states.
These findings provide additional information for the Governor, legislators, and other
policymakers to examine when considering Medicaid expansion in Alabama.
27Becker, David. “Medicaid Expansion in Alabama: Revisiting the Economic Case for Expansion.”
January 2019. University of Alabama at Birmingham.
28Miller, J. Corey and Sandra Collins. “A Fiscal and Economic Analysis of Medicaid Expansion in
Mississippi Under the Affordable Care Act.” September 2021. University Research Center, Mississippi
Institutions of Higher Learning. Retrieved from
http://www.mississippi.edu/urc/downloads/urcmedicaid2021.pdf
PARCALABAMA.ORG
19Appendix
Projected annual costs of Medicaid expansion in Alabama, 2022 to 2027
2022 2023 2024 2025 2026 2027
[A] Estimated population 19–
2,731,482 2,735,106 2,740,459 2,740,444 2,747,413 2,749,793
64 years old
[B] Share in 2019 ACS data
with incomes below 138% 22.4% 22.4% 22.4% 22.4% 22.4% 22.4%
FPL
[C] Estimated population
ages 19–64 with incomes 611,852 612,664 613,863 613,859 615,421 615,954
below 138% FPL (AxB)
[D] Share enrolled in
13.9% 13.9% 13.9% 13.9% 13.9% 13.9%
Medicaid in 2019 ACS data
[E] Number enrolled in
85,047 85,160 85,327 85,326 85,543 85,618
Medicaid (CxD)
[F] Number assuming take-
85,047 85,160 85,327 85,326 85,543 85,618
up rate of 100% (E x 1.0)
[G] Share with no health
insurance coverage in 2019 15.0% 15.0% 15.0% 15.0% 15.0% 15.0%
ACS data
[H] Number with no health
91,778 91,900 92,079 92,079 92,313 92,393
insurance coverage (C x G)
[I] Number assuming take-
72,504 72,601 72,743 72,742 72,927 72,991
up rate of 79% (H x 0.79)
[J] Share with employer
health coverage in 2019 ACS 62.3% 62.3% 62.3% 62.3% 62.3% 62.3%
Data
[K] Number with employer
health insurance coverage (C 381,184 381,690 382,437 382,434 383,407 383,739
x J)
[L] Number assuming take-
57,178 57,253 57,365 57,365 57,511 57,561
up rate of 15% (K x .15)
[M] Share with marketplace
health insurance coverage in 11.2% 11.2% 11.2% 11.2% 11.2% 11.2%
2019 ACS data
[N] Number with
marketplace coverage (C x 68,527 68,618 68,753 68,752 68,927 68,987
M)
[O] Number assuming take-
58,248 58,326 58,440 58,439 58,588 58,639
up rate of 85% (N x 0.85)
[P] Total estimated
expansion enrollment (F + I + 272,978 273,340 273,875 273,873 274,570 274,808
L + O)
[Q] Estimated per capita
$6,106 $6,289 $6,478 $6,672 $6,872 $7,078
expansion expenditures
[R] Total estimated
$1,827,283,3
expansion expenditures $1,666,802,175 $1,719,034,816 $1,774,161,572 $1,886,844,088 $1,945,088,992
00
(PxQ)
[S] Alabama portion of
expansion expenditures (R x $166,680218 $171,903,482 $177,416,157 $182,728,330 $188,684,409 $194,508,899
0.10)
[T] Estimated administrative
costs of expansion in $41,670,054 $42,975,870 $44,354,039 $45,682,083 $47,171,102 $48,627,225
Alabama (R x 0.025)
[U} Total estimated annual
cost of Medicaid Expansion
$208,350,272 $214,879,352 $221,770,197 $228,410,413 $235,855,511 $243,136,124
in Alabama
(S + T)
PARCALABAMA.ORG
20P.O. BOX 293931 800 LAKESHORE DRIVE BIRMINGHAM, ALABAMA 35229 205-726-2482 PARCALABAMA.ORG
You can also read