20 2 1 LEGISLATIVE HIGHLIGHTS - flcounties.com /flcounties @flcounties @flcounties - Florida Association of Counties
←
→
Page content transcription
If your browser does not render page correctly, please read the page content below
LEGISLATIVE
HIGHLIGHTS

20
21
              flcounties.com

              /flcounties

              @flcounties

              @flcounties
Table of Contents

               Access 67...................................... 5

               Affordable Housing....................... 8

               COVID & CARES Act.................... 11

               Sales Tax Competitiveness........ 14

               Water Quality &
               Supply Projects........................... 16

               Executive Committee
               & Contact Information................ 18

        2021
LEGISLATIVE
 HIGHLIGHTS
ACCESS
67
What is Access 67?
ACCESS 67 is an initiative of the Florida Association of Counties
(FAC) to implement a comprehensive approach to empowering
our members to develop solutions to address the impacts of the
lack of ACCESS to critical telecommunication and information
technology resources in Florida communities.

FAC recognizes that this lack of ACCESS impacts small,
medium and large counties, as well as, Florida’s rural and urban
communities. Additionally, the lack of ACCESS impacts multiple policy areas that FAC’s members are
responsible for in the governance of their local communities to include, but are not limited to, public
safety, healthcare, economic development and education.

The comprehensive approach of the ACCESS 67 Initiative is based on the underlying principles of the
Association’s mission; Advocacy, Collaboration, and Education.

•   FAC, as directed by its members, will advocate for the adoption and implementation of state and
    federal policies that contribute to the development of solutions that address the lack of ACCESS in
    our local communities.

•   FAC will identify opportunities and provide support for our members to collaborate with other
    stakeholders who share a common goal in developing solutions to address the lack of ACCESS in our
    local communities.

•   FAC and the Institute for County Government will develop and produce educational content designed
    to empower our members with information that will assist them in developing effective local solutions
    to the impacts of the lack of ACCESS in their communities. These educational efforts will be inclusive
    of the facilitation of the sharing of best practices among Florida’s counties and similar communities
    and organizations from around the country.

           98.3%                                                80.3%
                                                                                                             | 2021 LEGISLATIVE HIGHLIGHTS

           of Florida’s                      while only         of Florida’s
            urban population has                                rural population has
           access to broadband                                  access to broadband
           (at least 25 mbps)                                   connection

                                                                                                                      5
ACCESS
                                67

                                Legislation and Program
                                Supporting Access 67
                                In the 2020 legislative session, HB 969 was signed into law
                                which designated the DEO as the lead state entity to facilitate the
                                expansion of broadband, established the Florida Office of Broadband
                                within the Division of Community Development and encouraged
                                expansion of broadband services in underserved areas. Beginning in
                                FY2022-23, $5M annually with be administered by the FDOT through the
                                Florida’s Turnpike Enterprise, to support projects that aid in development of
                                broadband infrastructure with priority given to rural counties in need.

                                Office of Broadband at Department of Economic Opportunity

                                The Florida Office of Broadband created a State of Florida Minimum Internet Download
                                Speeds Map, to showcase areas in the State that are between download speeds of 3-25 Mbps
                                (megabytes per second). The map indicates areas that are served, underserved, or unserved
                                based on download speed.
| 2021 LEGISLATIVE HIGHLIGHTS

         6
ACCESS
67

  Broadband’s Impact

                                                      ECONOMIC
         EDUCATION:        HEALTHCARE               DEVELOPMENT
           REMOTE
                                                        AND
          LEARNING
                                                  INFRASTRUCTURE

     AGRICULTURE –           MOBILITY            CIVIC ENGAGEMENT:
        MODERN              EXPANSION            REMOTE MEETINGS,
      TECHNOLOGY                                   LIVE STREAMING
                                                      SERVICES

                      PUBLIC SAFETY-
                      IMPROVED EMERGENCY MANAGEMENT

                                   The National Association of Counties
                                   (NACo) has launched the TestIT app
                                   allowing people across the country
                                   to test their download speed and for
                                                                          | 2021 LEGISLATIVE HIGHLIGHTS

                                   NACo and its partners to aggregate
                                   the data to see where the highest
                                   needs are for broadband.

                                                                                   7
AFFORDABLE
                                HOUSING
                                Affordable housing is a continual obstacle for Floridians. As it
                                stands, a full-time hourly worker making minimum wage, $8.56, would
                                need to work 114 hours a week to afford a modest two-bedroom rental.
                                Meanwhile, the average housing wage, or the hourly wage when full time
                                workers spend no more than 30% of income on housing expenses, for Florida is
                                $24.43 an hour.

                                By comparison 65% of Floridian jobs make less than $20 an hour as of 2018. Currently,
                                the rent affordable for one person at the minimum wage is $445 a month, while fair market
                                rent for a modest two bedroom is $1,270. At the fair market rent, a Floridian would need 2.9
                                full-time jobs at minimum wage to afford a two-bedroom home. Advocates from all corners of
                                Florida including the Florida Realtors, Homebuilders, Chamber of Commerce, Legal Services, and
                                Conference of Catholic Bishops have joined together to form the Sadowski Coalition to advocate
                                for struggling Floridians.

                                           A FULL-TIME                          WOULD NEED TO                     TO AFFORD A
                                           WORKER MAKING                        WORK                              MODEST

                                            $8.56                               114                               2 Bdrm
                                            AN HOUR                             HOURS/WEEK                        RENTAL

                                                                   AT THE FAIR MARKET RENT, A FLORIDIAN WOULD NEED

                                                                   2.9 full-time jobs
                                                                   AT MINIMUM WAGE TO AFFORD A TWO-BEDROOM RENTAL

                                Key Message Point:

                                The Florida Association of Counties (FAC) supports appropriating the full amount of dedicated
                                documentary tax revenues from the Sadowski housing trust funds to fund state and local
| 2021 LEGISLATIVE HIGHLIGHTS

                                affordable housing programs, and opposes the Legislature transferring unappropriated funds
                                from the housing trust funds to general revenue or other uses. If fully appropriated, the Sadowski
                                Coalition projects 30,000 new jobs would be created with an over $4.4 billion economic impact.

         8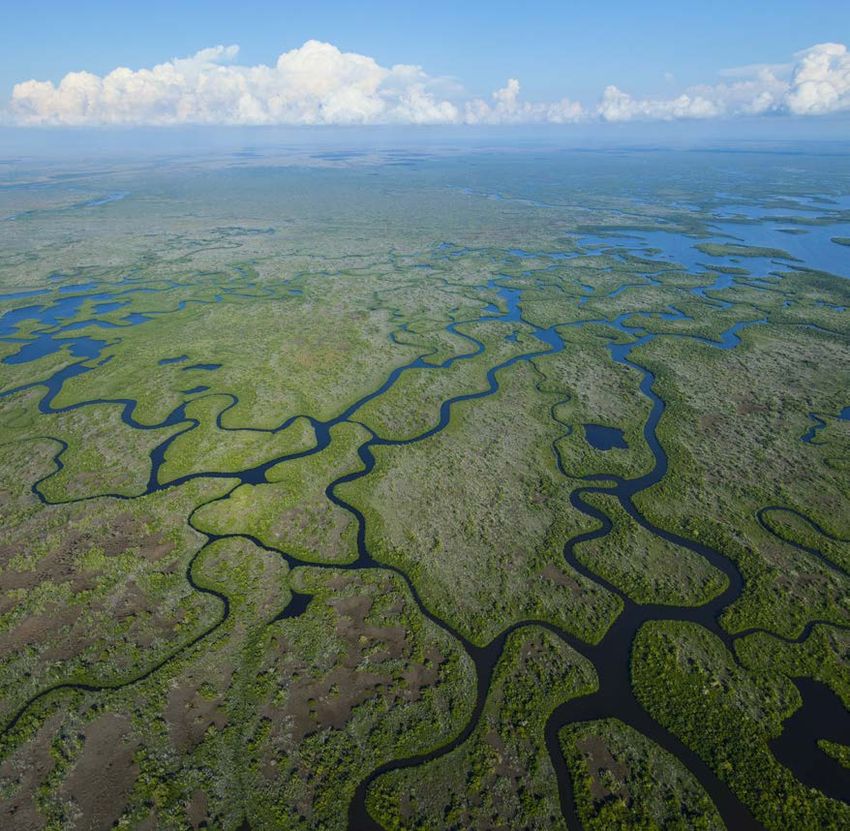
AFFORDABLE
HOUSING

  While Florida law provides for a dedicated funding source
  for affordable housing programs to ease this burden, the
  Legislature routinely raids these trust funds when building
  the annual state budget. The Legislature has swept funds –
  partially or totally – from the housing trust funds every year
  since the 2008-09 fiscal year into the General Revenue fund
  for various unrelated projects.

  Governor DeSantis vetoed SHIP funding from the FY
  2020-21 budget, this means all funds (225 million)
  remain in the Local Government Housing Trust
  Fund until the Florida Legislature decides to
  disperse it due to COVID-19 costs.

                                                                        Affordable Housing
                                                                       (Vetoed):

                                                                 Veto the SFY 2020-2021 budget
                                                             allocates $225 million for the State
                                                           Housing Initiatives Partnership (SHIP).

                                                     The SFY 2020-2021 budget allocates $115
                                                  million for the State Apartment Incentive Loan
                                               Program (SAIL).

                                         The SFY 2020-2021 budget allocates $30 million for the
                                       Hurricane Housing Recovery Program (HHRP).

                                  The Legislature did not sweep funds from the Sadowski
                               Affordable Housing Trust Fund.
                                                                                                     | 2021 LEGISLATIVE HIGHLIGHTS

                                                                                                              9
AFFORDABLE
                                HOUSING

                                Florida Affordable
                                Housing and CARES ACT

                                In June 2020, Florida received $250
                                million dollars funded by the CRF
                                (Coronavirus Relief Fund) and was made
                                available to the Florida Housing Finance
                                Corporation (FHFC). Florida is using CARES Act
                                funding for rental and mortgage relief, as well as
                                assistance programs. Governor DeSantis allocated
                                $250 million of the CARES Act funding for rental and
                                mortgage assistance to aid Florida families directly impacted
                                by COVID-19 hardships. Of the $250M, $120M went to short-term
                                rental assistance on multifamily rental properties, for properties
                                funded by FHFC. An additional 120M went to counties re-employment
                                assistance rates, which include homeowner’s assistance programs such
                                as new construction, mortgage buydowns, down payments administered by
                                SHIP for those affected by COVID-19. As of now, the programs under the Florida
                                Coronavirus Relief Fund through FHFC will end December 30, 2020.

                                BACKGROUND:

                                Enacted in 1992, the William E. Sadowski Affordable Housing Act provides a dedicated revenue
                                source for the State and Local Housing Trust Funds. The programs are funded through the state’s
                                documentary tax on real estate transactions. Seventy percent of fund proceeds go into the Local
                                Government Housing Trust Fund for the State Housing Initiatives Partnership (SHIP) Program,
                                which allocates funds to local governments (counties and larger cities) for housing programs that
                                produce and preserve affordable homeownership and multifamily housing for very low, low and
                                moderate-income families. Thirty percent of fund proceeds go to the State Housing Trust Fund for
| 2021 LEGISLATIVE HIGHLIGHTS

                                programs such as the State Apartment Incentive Loan (SAIL) Program.

   10
COVID &
CARES ACT
Summary:
The Coronavirus Aid, Relief, and Economic Security Act (CARES Act; P.L. 116-
136), signed into law on March 27, 2020, created the Coronavirus Relief Fund,
which provided $150 billion in direct assistance for domestic governments.
Key Points and Data:
The State of Florida was allocated approximately $8.328 Billion in funding from the Coronavirus
Relief Fund. Of this amount, Florida’s 12 largest counties (Counties with populations greater than
500,000 people) were direct funded by the U.S. Treasury Department for a total of approximately
$2.472 Billion. Florida’s other 55 counties received allocations in total of approximately $1.275
Billion as determined by the Governors Office as a part of the distribution of funds received by the
State of Florida. The chart below details each county’s approximate allocation of funding from the
CARES Act.
CARES Allocation by County* - Counties with a population less than 500,000 allocation.
Alachua County $46,945,928 Hamilton County $2,409,912 Nassau County $15,464,380
Baker County $4,920,856 Hardee County $5,096,920 Okaloosa County $36,772,156
Bay County $30,484,676 Hendry County $7,332,516 Okeechobee
Bradford County $4,700,300 Hernando County $33,837,544 County $7,241,952
Calhoun County $2,485,816 Highlands County $18,534,744 Osceola County $65,565,648
Charlotte County $32,963,340 Holmes County $3,423,016 Putnam County $12,952,212
Citrus County $26,113,992 Indian River County $27,905,332 Santa Rosa County $32,161,196
Clay County $38,257,784 Jackson County $7,357,992 Sarasota County $75,684,632
Collier County $67,162,428 Jefferson County $2,658,740 Seminole County $82,330,000
Columbia County $12,508,656 Lafayette County $1,469,576 St. Johns County $46,183,224
DeSoto County $6,630,880 Lake County $64,059,260 St. Lucie County $55,543,688
Dixie County $2,936,008 Leon County $51,227,796 Sumter County $23,106,268
Escambia County $57,285,296 Levy County $7,750,424 Suwannee County $8,098,884
Flagler County $20,080,748 Liberty County $1,457,708 Taylor County $3,763,624
Franklin County $2,115,720 Madison County $3,242,416 Union County $2,379,900
Gadsden County $7,967,316 Manatee County $70,364,540 Wakulla County $5,887,196
Walton County $12,924,820
| 2021 LEGISLATIVE HIGHLIGHTS
Gilchrist County $3,226,884 Marion County $63,790,716
Glades County $2,461,212 Martin County $28,093,260 Washington County $4,444,844
Gulf County $2,517,576 Monroe County $13,003,340 TOTAL $1,275,285,792
*these funds have been allocated to the counties from the state, this does not represent the money spent by counties*
During the 2020-21 policy development process FAC members unanimously adopted a position to
urge Congress to support the continuation of funding to state and local governments to assist with
critical local response efforts to the COVID-19 pandemic.
11COVID &
CARES ACT
BACKGROUND: CARES ACT
The CARES Act provided that its allocations could only be used to cover costs that—
1. are necessary expenditures incurred due to the public health emergency with respect to the
Coronavirus Disease 2019 (COVID–19);
2. were not accounted for in the budget most recently approved as of March 27, 2020 (the date of
enactment of the CARES Act) for the State or local government; and
3. were incurred during the period that begins on March 1, 2020, and ends on December 20, 2021.
Nonexclusive examples of eligible expenditures
Eligible expenditures include, but are not limited to, payment for:
1. Medical expenses.
2. Public health expenses.
3. Payroll expenses for public safety, public health, health care, human services, and
similar employees whose services are substantially dedicated to mitigating or
responding to the COVID- 19 public health emergency.
4. Expenses of actions to facilitate compliance with COVID-19-related public
health measures.
5. Expenses associated with the provision of economic support in
connection with the COVID-19 public health emergency.
6. Any other COVID-19-related expenses reasonably
necessary to the function of government that satisfy
the Fund’s eligibility criteria.
| 2021 LEGISLATIVE HIGHLIGHTS
12COVID &
CARES ACT
OR ALTHOUGH ITS
FLORIDA’S 6% POPULATION
IS APPX.
6.6%
ALLOCATION= OF TOTAL
$8.328 FUNDS
SET ASIDE FOR OF TOTAL U.S.
BILLION STATES POPULATION
Local governments serving a population of at least 500,000, as measured in the most recent census
data, may elect to receive assistance directly from Treasury. Such direct local assistance allocations
reduce the allocation made to the state government (keeping the state allocation constant) and are
equal to the product of:
• the state or territory allocation amount;
• the percentage of the state or territory population served by the local government; and
• 45%
FLORIDA ALLOCATION $8.328 BILLION
55% Reserved for State of Florida: $4.584 BILLION
45% Reserved for Eligible Local Governments: $3.748 BILLION
2018 % of x 45% Jurisidiction
Jurisdiction Population State x State Allocation = Product 1 Factor = Allocation
Miami-Dade County 2,761,581 12.97% x $8,328,000,000 = $1,079,773,494 x 45% = $485,898,072
Broward County 1,951,260 9.16% x $8,328,000,000 = $762,939,355 x 45% = $343,322,710
Palm Beach County 1,485,941 6.98% x $8,328,000,000 = $581,000,414 x 45% = $261,450,186
Hillsborough 1,436,888 6.75% x $8,328,000,000 = $561,820,774 x 45% = $252,819,348
County
Orange County 1,380,645 6.48% x $8,328,000,000 = $539,829,857 x 45% = $242,923,435
| 2021 LEGISLATIVE HIGHLIGHTS
Pinellas County 975,280 4.58% x $8,328,000,000 = $381,332,828 x 45% = $171,599,773
Duval County 950,181 4.46% x $8,328,000,000 = $371,519,162 x 45% = $167,183,623
Lee County 754,610 3.54% x $8,328,000,000 = $295,051,232 x 45% = $132,773,054
Polk County 708.009 3.32% x $8,328,000,000 = $276,830,320 x 45% = $124,573,644
Brevard County 596,849 2.80% x $8,328,000,000 = $233,366,948 x 45% = $105,015,127
Pasco County 553,947 2.58% x $8,328,000,000 = $214,798,844 x 45% = $96,659,480
Volusia County 553,284 2.58% x $8,328,000,000 = $214,541,759 x 45% = $96,543,791
$2,472,413,692
13SALES TAX
COMPETITIVENESS
In 2018, the U.S. Supreme Court ruled that states may impose taxes on entities that have a “substantial
nexus” to the taxing state regardless of whether the entity has a physical presence within that state. This
overrules previous Supreme Court precedent that had prevented states from levying sales tax on sellers
without a physical presence.
Florida does not currently tax entities without a physical presence in the State.
The U.S. Supreme Court’s 2018 ruling in South Dakota v. Wayfair took the unusual step of receding from
a previous decision, Quill Corp. v. North Dakota, which had required a physical presence for a business’
sales to be taxed in a state. Since the Court’s Quill decision in 1992, interstate transactions such as
catalog sales and later, internet sales, were not taxable without the seller having some sort of physical
nexus in the taxing state. The Court did not expressly provide a new rule in place of the physical presence
rule, but it did say that a sufficient nexus was established if a seller availed itself of the substantial
privilege of carrying on business in the jurisdiction. The Federal Government Accountability Office has
estimated that between $8.5 billion and $13.4 billion in sales taxes revenues on remote transactions went
unrealized in 2017.
Remote Sales Tax Laws Among U.S. States
States with Remote Sales Tax Laws
States without Remote Sales Tax Laws
n/a - States without any sales tax
| 2021 LEGISLATIVE HIGHLIGHTS
In response to the 2018 Wayfair decision, numerous groups have called for Congress to enact federal
sales tax collection legislation to standardize sales tax collections across the states so that sellers
can avoid a “regulatory free-for-all.” Any federal law would likely seek to minimize the number of taxing
entities within a state and require state and local sales tax uniformity.
14SALES TAX
COMPETITIVENESS
Whether or not Congress is able to pass legislation, 43 of the 45 states that collect sales tax have laws
in place that allow them to capture sales tax revenue from remote sales. Only two states, Missouri and
Florida, are holdouts.
Impact in Florida
Currently, Florida’s retailers are at a competitive disadvantage in 43 states
by Senator
because Florida’s retailers are paying those state and local sales taxes, SB 50
Joe Gruters
while vendors from those states are not paying sales tax in Florida. Passing
legislation ensures sales tax fairness for local retailers.
Two bills have been filed for the upcoming 2021 session. The bills apply by Reps Chuck
Florida’s sales and use tax laws to online/e-commerce sales from out-of- HB 15 Clemons and
state retailers regardless of whether the entity has a physical presence within Chip LaMarca
Florida. If passed, the tax will take effect after July 1, 2021. As of 1/4/21,
6 co-sponsors
Revenue Boost Expected
The revenue implications are likely to play a greater role in states that do not have an income tax and, as a
result, rely more on their sales tax to fund their budget as is the case in Florida.
Florida can expect up to a 1.7% revenue boost from this legislation.
In December 2019, the State Revenue Estimating Conference projected the value of similar legislation for
the out-of-state collections to be $743.5 million per year recurring in state and local revenues (annualized
over a 5-year period).
Sales taxes account for more than half of all revenues in six states, according to Fitch Ratings. Among those
six states, featured in the table below, they could see anywhere from a 1.1 to 1.7 percent revenue boost:
$758M 1.7% Local Benefit
Estimate of potential revenue Potential revenue boost to government and
gain from online sales brick-and-mortar stores
Potential Revenue Gain in Select States
| 2021 LEGISLATIVE HIGHLIGHTS
FLORIDA NEVADA S. DAKOTA TENNESSEE TEXAS WASHINGTON
$758 M $134M $47M $363M $1.2B $453M
15WATER QUALITY &
SUPPLY PROJECTS
Water quality and water supply issues are among the most challenging issues facing Florida. All levels
of government must adopt and enforce policies that proactively address the various sources of nutrient
pollution as well as plan to sustainably meet the water supply needs of a growing population. In short,
clean and abundant water is paramount to preserving our way of life. The overall goal of all of these
charts is showing the growing need for investment in water infrastructure.
• Increase water quality funding
To reduce nutrient pollution in Florida’s impaired water bodies, the State must increase funding for
water quality improvement projects. These projects must be comprehensive in nature recognizing
that multiple sources, rather than a single source, contribute to nutrient loading, including, but not
limited to, wastewater and septic systems, industrial, agricultural, fertilizer, and residential water use.
Water Infrastructure Spending Gap
$93.2 billion
$73.6 billion Increase of $19.6 billion
STATE BUDGET TOTAL
= 7/10 of 1%
7/10 of 1% =
WATER RESOURCES SPENDING
$515 million Increase of $179 million $694 million
2007 2020
• State match for county funding
The State should match a county’s investment of local funds to restore impaired springs, estuaries,
lagoons and other waterbodies.
Water Resource Protection and Infrastructure Needs
| 2021 LEGISLATIVE HIGHLIGHTS
Drinking water infrastructure improvements next 20 years
• To replace, maintain, and expand Florida’s aging drinking water, wastewater, $44.3 billion
and stormwater infrastructure
Natural resources projects to achieve MFL compliance $7.8 billion
Development of TMDLs (Total Maximum Daily Load $267.29 million
Implementation of BMPs $5.26 billion
Next 20 years of Everglades Restoration (CERP) $8.26 billion
TOTAL* (not including adaptation funding for Sea Level Rise) $66.09 billion over next 20 years
Citation: EDR 2020 Edition Annual Assessment of Florida’s Water Resources and Conservation Lands
16WATER QUALITY &
SUPPLY PROJECTS
• Allow for more flexibility from possible local
funding sources
Restrictions on funding sources should be removed,
allowing counties to use any and all available funding
for local and regional water supply development and water
quality projects.
• Maximize use of reclaimed water
Incentivizing infrastructure investment for the reliable and safe
distribution of reclaimed water would decrease the ever-increasing demand
on Florida’s limited water supply. Reclaimed water that is economically,
technically and environmentally feasible can be used for reuse service areas and
prioritized irrigation and other nonpotable uses.
BACKGROUND
Increased demands on Florida’s water supply are forcing many diverse interests to work with county
government to plan the future of water policy in Florida.
Significant investment is needed in coming years to upgrade and replace aging water infrastructure, restore
impaired waterbodies, and develop alternative water supplies to meet the needs of a growing population.
Additionally, securing funding for local water projects can be a frustrating process for local officials as state
legislative leadership changes and priorities shift; thus, a long-term or multi-year water plan at the state level
is needed to ensure that appropriate investments are being made in the state’s water infrastructure.
State Programmatic Funding (2006-2020)
400
350
300
250
200
150
| 2021 LEGISLATIVE HIGHLIGHTS
100
50
0
2006 2007 2008 2009 2010 2011 2012 2013 2014 2015 2016 2017 2018 2019 2020
DWSRL WWSRL EVER SPRINGS AG BMP’S TMDL’S
DWSRL = Drinking Water State Revolving Loan Springs = Springs
WWSRL = Waste Water State Revolving Loan AG BMPs = Agricultural Best Management Practices
Ever = Florida Forever TMDLs = Total Maximum Daily Loads
17WATER QUALITY &
SUPPLY PROJECTS
Florida’s
Resilient
Future
• Counties are
leading in regional
collaboration focused
on resiliency.
• Counties are maximizing
resources, sharing information,
analysis, and best practices.
• State and Federal partners must support
adaptation and mitigation strategies critical
to addressing local governments’ initiatives to
address:
1. Ecosystem sustainability
2. Long-term water supply
3. Flood protection
4. Public health and safety
5. Economic prosperity.
• State support of comprehensive policies is essential to reduce a
county’s risk to the impacts of:
1. Coastal, inland, and nuisance flooding
| 2021 LEGISLATIVE HIGHLIGHTS
2. Water quality degradation
3. Extreme weather
4. Sea level rise
5. Climate change.
182020-2021
EXECUTIVE COMMITTEE
Commissioner Commissioner Commissioner
Melissa McKinlay Ralph C. Thomas, Jr. Lee Constantine
PRESIDENT PRESIDENT-ELECT FIRST VICE PRESIDENT
Palm Beach County Wakulla County Seminole County
Commissioner Commissioner
Bill Truex Nick Maddox
SECOND VICE PRESIDENT IMMEDIATE
Charlotte County PAST PRESIDENT
Leon County
For more information, please contact:
| 2021 LEGISLATIVE HIGHLIGHTS
Cragin Mosteller
Director of External Affairs
Phone: (850) 922-4300 Cell: (850) 294-3907
cmosteller@flcounties.com @cragin
192021 LEGISLATIVE HIGHLIGHTS flcounties.com /flcounties @flcounties @flcounties
You can also read


