Company Presentation Investor Relations - April 2021 - Gulf Energy Development
←
→
Page content transcription
If your browser does not render page correctly, please read the page content below
Gulf Energy Development Public Company Limited

 Company Presentation
 Investor Relations
 April 2021

Index
Business Updates

Q4’20 & FY 20 Financial Performance

Appendix
GULF’s 5 Business Pillars

             Power Generation                                Renewable Energy                               Hydropower          Infrastructure & Utilities                                  Gas
                        13,566 MW                                   738 MW
        40%            Gulf JP                    75%        Gulf Solar                        [30-35%] [Laos Hydropower]    70% Gulf MTP                                 35%        Gulf WHA MT
      Ownership        4,237 MW                  Ownership   0.6 MW                             Ownership
                                                                                                              Under study   Ownership    Industrial port development     Ownership   Natural gas distribution
                       2 IPPs and 7 SPPs                     4 Solar rooftop VSPPs                                                       (land reclamation)                          2 projects
                       COD: 2013 – 2015                      COD: 2014 – 2015                                                            3 years construction                        4,000,000 mmbtu/year
                                                                                                                                         SCOD: [2024]                                COD: 2018 – 2019
        70%            Gulf MP                   100% Gulf Chana Green
      Ownership        1,563 MW                  Ownership   25 MW                                                                       Laem Chabang Ph3
                       12 SPPs                               1 Biomass project                                                                                            42% PTT NGD
                       COD: 2017 – 2019
                                                                                                                             40% Deep sea container port
                                                             COD: 2020                                                      Ownership    > 4 million TEU/year            Ownership   Natural gas distribution
                                                                                                                                         SCOD: F1 terminal: [2025]                   28,000,000 mmbtu/year
                       Independent Power          90%        GTN1 & GTN2
        70%            Development
                                                                                                                                                  F2 terminal: [2029]                (sales volume in 2020)
       Ownership                                 Ownership   119 MW                                                                      PPP signing expected in Q2’21
      (75% dividend)   5,300 MW                              2 Solar farms
                       2 IPPs                                COD: 2019                                                                                                    70%        Gulf MTP
                       COD: 2021 – 2024                                                                                                  BGSR 6 & BGSR 81                Ownership   LNG terminal
                                                  95%        Mekong Wind                                                      40%        Intercity motorway                          Up to 10.8 MTPA
       49%             Hin Kong                  Ownership   Up to 310 MW                                                    Ownership   Operation & Maintenance                     SCOD: [2026]
      Ownership        1,540 MW                              1 Offshore wind farm (8 phases)                                             M6: 196 km                                  (subject to LNG demand)
                       1 IPP                                 SCOD:                                                                       M81: 96 km
                       COD: 2024 – 2025                      Ph 1-3 (128 MW): 2021                                                       SCOD: [2024]
                                                             Ph 4-8 (182 MW):                                                            PPP signing expected in Q2’21               LNG Shipper Licenses
       35%             Burapa
                                                             under PDP8 consideration
      Ownership        600 MW                                                                                                                                                        Total 1.7 MTPA
                       1 IPP                                                                                                 33%         BSE (One BKK Proj.)                         • Hin Kong Holding :
                       COD: 2027                  50%        Borkum Riffgrund 2                                             Ownership    Electricity distribution                       1.4 MTPA
                                                 Ownership   465 MW                                                                      (240 MW)                                    • Gulf LNG: 0.3 MTPA
       49%             DIPWP                                 1 Offshore wind farm                                                        SCOD: 2022
      Ownership        326 MW                                COD: 2019
                       1 power & water project                                                                                           District cooling system
                       COD: 2021 – 2022          100% Gulf1                                                                              (36,000 RT)
                                                 Ownership
                                                             Solar rooftop & energy solution                                             SCOD: [2023 – 2026]
                       [LNG-to-power]

 Data as of April 2021                                                                                                                                                                                          3
Power Generation & Renewables Businesses
 Total of 36 power projects in 4 countries
          29 power projects in operation

 Thailand                                          Vietnam                                 Oman                                              Germany

                                                                                          1 gas-fired power
  26 power projects                                                                       project under
  in operation                                                                            construction
  • 21 gas-fired power projects
  • 4 solar rooftop projects                            2 solar power projects
  • 1 biomass project                                   in operation

  5 power projects                                      1 offshore wind project
  under development/                                    under development/                                                                        1 offshore wind project
  Construction                                          construction                                                                              in operation
  • 4 gas-fired power projects
  • 1 solar rooftop & energy
    solution business (Gulf1)

                                                                                                       Installed capacity                              Gross               Equity
                                                                                       In operation (by end of 2021)                                7,903 MW             4,028 MW
                                                                                       Under development / construction                             6,401 MW             3,887 MW
                                    In operation
                                                                                       Total* (by 2027)                                            14,304 MW             7,915 MW
                                    Preparing for or under construction/ development   Note: * Total installed capacity excludes any prospects such as LNG-to-power project,
                                                                                               hydropower projects and renewable projects under study.

                                                                                                                                                                                    4
Power Capacity Growth (committed PPAs) and Target

Gross Installed Capacity (MW):
                                                                                                             14,304       BPP        600 MW
                                                                                       13,704    13,704
                                                                        12,934                                            HKP        1,540 MW

                                                           10,839                                                        DIPWP       326 MW
                                               9,514                                                                     Mekong      128 MW
                                  7,903                                                                                   GPD        2,650 MW
                       6,409
                                                                                                                          GSRC       1,987.5 MW (Units 2-4)

                                                                                                                        Operating   12 SPPs under GMP (1,563 MW)
                                                                                                                                    7 SPPs under GJP (831 MW)
                                                                                                                                    GNS & GUT under GJP (3,406 MW)
                                                                                                                                    BKR2 (465 MW)
                                                                                                                                    GCG (25 MW)
                        2020      2021         2022            2023      2024           2025      2026       2027                   GTN1 & GTN2 (119 MW)
                                                                                                                                    4 VSPPs under Gulf Solar (0.6 MW)
                                                                                                                                    GSRC Unit 1 (662.5 MW)
Gross Installed Capacity by Fuel Types
                                                                 Year 2027                      Year 2030 (Target)
                       Apr 2021
                                   34%
                                                                                 17%
                                  (2,394 MW)                                     (2,394 MW)                             Renewables capacity growth from:
                                                                                                  Power
              58%                                                                               Generation
                                   9%                                            5%               30%
                                  (609 MW)             78%
                                                 (11,172 MW)
                                                                                                                        Hydropower           Renewables in
 IPP                                                                                                                     projects          Thailand, Vietnam,
 SPP
                       7,072 MW                                 14,304 MW                                                                  Europe, US & Asia,
                                                                                                                                                  etc.
 Renewables
                                                                                                                                                                  5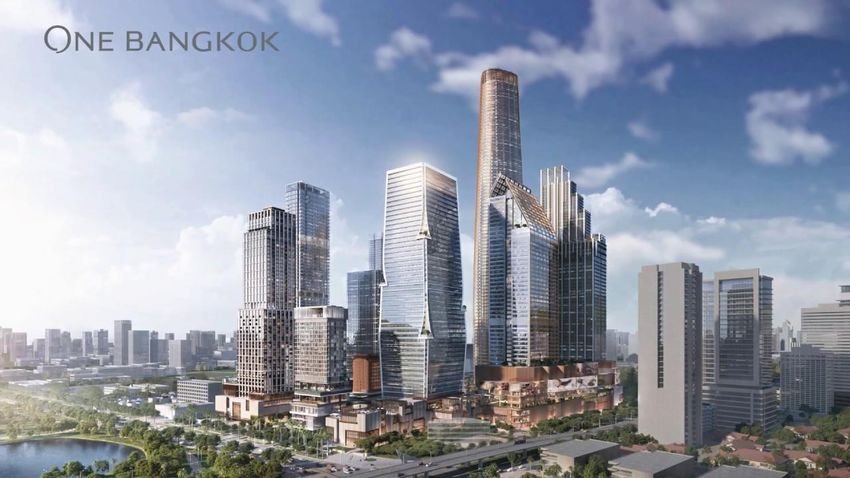
Towards Sustainability
 Target > 30% of renewable projects in portfolio within the decade

                                                              GULF is committed to making a capital contribution to
                                                              supporting renewable energy in line with the global efforts
                                                              to decarbonize and combat climate change.

                                                              We continue to adhere to our No Coal Policy as we drive
                                                              our investment in renewable energy projects both
                                                              domestically and overseas, with a target to have at least
                                                              30% of renewable projects in our portfolio within the next
                                                              10 years.

              Renewables
                 >30%
   Power
                                                              GULF is a member of the Global Wind Energy Council
 Generation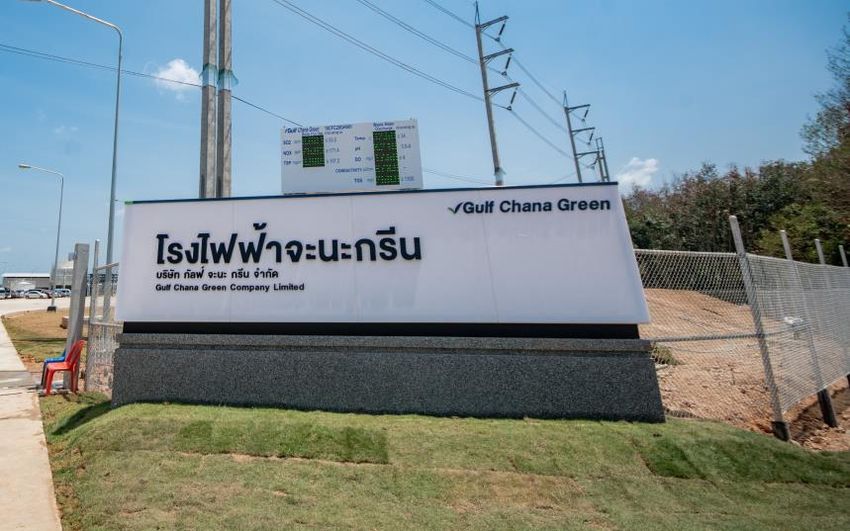
Key Business Activities in 2020
                   Power Generation                                           Renewable Energy                   Gas

                           HKP

        ✓ 49% of shares in Hin Kong Power
                                                                               BKR2 Wind Farm                PTT NGD

                                                                         ✓ Acquired 50% of shares    ✓ Acquired 40%* of shares
                                                                           in BKR2                     in PTT NGD

                          BPP

        ✓ 35% of shares in Burapa Power

                                                                            SONGKHLA

                                                                                 GCG Biomass             LNG Shipper Licenses

                         Duqm                                           ✓ Reached COD in Mar 2020,   ✓ Shipper licenses to import
                                                                          on time and on budget        1.7 MTPA of LNG
         ✓ 45 → 49% of shares in Marafiq

  Remark: *Gulf acquired additional 2% stake in April 2021 and currently hold 42% stake in PTT NGD                                  7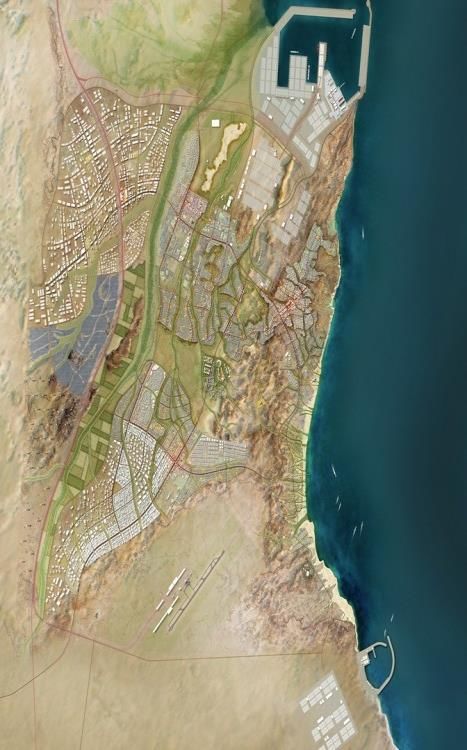
2021 Revenue Drivers
                                                            1    2021
                                                                 2021 Project
                                                                      Project CODs
                                                                              CODs                2   Full year income contribution from
     Projected total revenue
                                                            1
                                                                Gross installed capacity
                                                                                 7,903 MW                                    Biomass Power Project
     growth                                                     6,409 MW                                                     (25 MW)
                                                                                       7,903 MW                              Started contributing revenue and
                                                                 6,409 MW                                                    profit from Q1 2020 onwards
                                                                     +1,494 MW
                               ≈ +50%                                 +1,494 MW
                                                                                                            BKR2
                                                                   2020                 2021          Offshore Wind Farm                  Natural Gas Distribution
        35,833                                                   Gross installed capacity                 (464.8 MW)                        (42%* equity interest)
                                                                    2020                 2021
                                                                                                      Started contributing revenue and    Will start contributing profit
                                                                                                      profit from Q4 2020 onwards         from Q1 2021 onwards

                                                           • Gulf SRC (IPP) 1,325 MW
                                                             Unit 1 (662.5 MW): Mar 31, 2021      3   Dividend Income
                                                             Unit 2 (662.5 MW): Oct 1, 2021
                                                                                                      Dividend income from
                                                           • Mekong Wind (Offshore Wind) 128 MW
                                                                                                      INTUCH & SPCG
                                                             Phase 1 (30 MW): May 2021
                                                             Phases 2-3 (98 MW): Oct 2021

                                                           • DIPWP (Captive) 40 MW
                                                             Phase 1 (40 MW power and 50m3/h
         2020                  2021 (F)                      water): May 2021

                                                           • Potential additional MW
                                                             from GNC and Gulf1

Remark: *Gulf acquired additional 2% stake in April 2021                                                                                                            8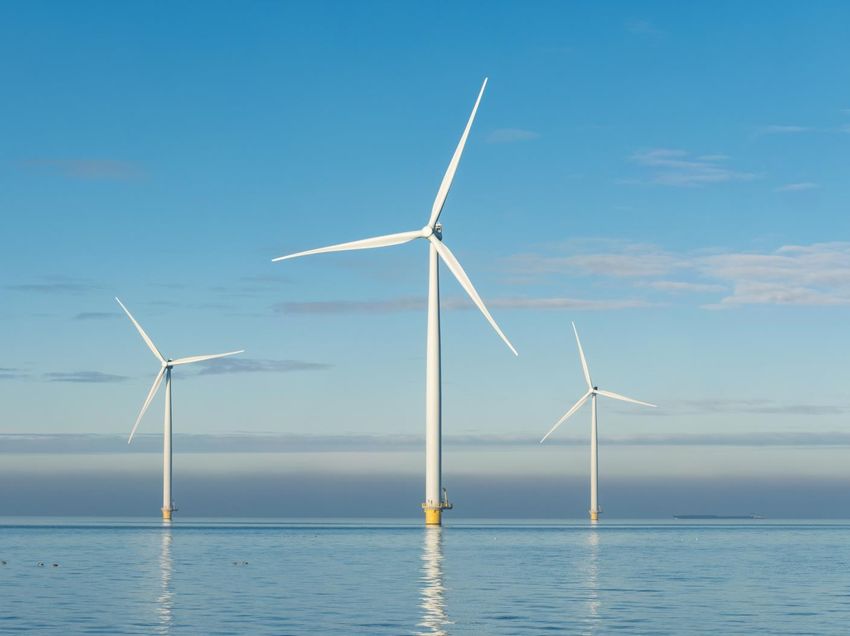
Key Business Activities in 2021
             Power Generation                    Renewable Energy                 Infrastructure & Utilities

               LNG-to-Power                            Gulf1                            LCB3 Port

     ✓ Studying LNG-to-Power projects    ✓ Target to secure 200 MW in 2021      ✓ Expected PPP Contract
       in Vietnam                                                                 signing by Q2 2021

               Hydropower

                                                    Renewables                      M6 & M81 Motorways
                Hydropower
                                         ✓ Exploring investment opportunities   ✓ Expected PPP Contract
     ✓ Studying hydropower projects in     in renewable projects domestically     signing within Q2 2021
       Laos                                and overseas (UK, EU, US , Asia,
                                           especially Vietnam)
                                                                                                               9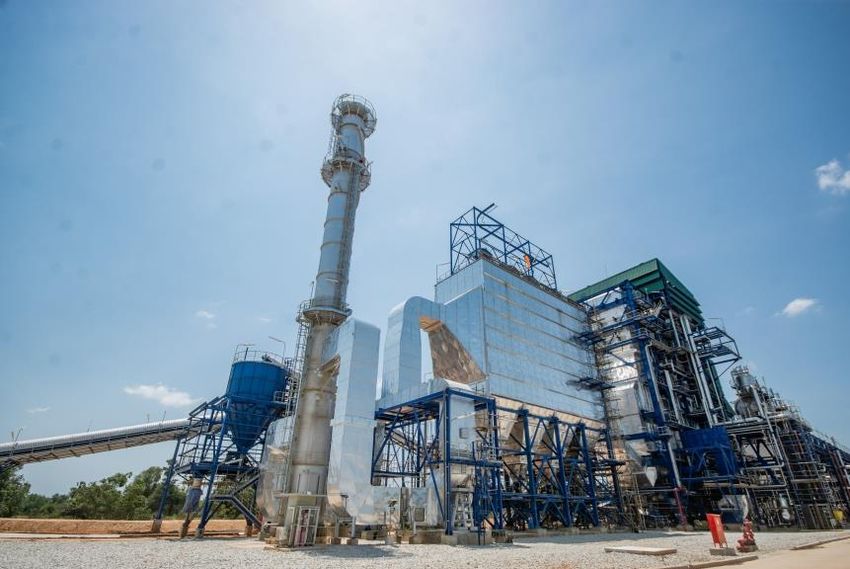
Index
Business Updates

Q4’20 & FY 20 Financial Performance

Appendix
Total Revenues
BKR2 Offshore Wind Farm brings growth to sales revenue

 Unit: THB million
                                                                           Total revenues in 2020 was THB 35,833 million, up 6.8% YoY, mainly from:

                              +6.8% YoY                                    1) Sales revenue increased from THB 29,721 million to THB 32,298 million (+8.7%)
                                                                              mainly due to:
                                                                               •   Sales from BKR2 offshore wind farm in Germany which started to recognize
                                             35,833                                revenue in Q4’20 for the first quarter
                     33,549
                                              2,462                            •   COD of GCG Biomass power plant in March 2020
                      3,205       543
            304                                                                •   Full year revenue consolidation from GTN1 & GTN2 solar farms in Vietnam after
                                  372
                                                                                   increasing equity interest from 49.0% to 90.0% in 2019
            319
                                  158                                          •   Full year revenue recognition of all 12SPPs under GMP after gradually
                                                                                   commencing commercial operation between 2017-2019

                                              32,298
                     29,721                                                2) First year of revenue contribution from MTP3’s infrastructure work of THB 158 million
                                                                              recognized under revenue from service concession arrangement (TFRIC 12)
                               +8.7%
                                YoY
                                                                           3) Other income increased from THB 304 million to THB 543 million (+78.9%) mainly
                                                                              due to dividend income of THB 440 million from INTUCH and SPCG

                      2019                     2020
         Sales Revenue                    Service Concession Arrangement
         Management Fee                   Share of Profit
         Other Income                     Total Revenue

                                                                                                                                                                 11
Share of Profit from GJP (40%)
Share of profit affected by decline in GJP’s FX gain
Unit: THB million Share of profit from GJP (excl. FX) in 2020 was THB 2,461 million, up 4.4%YoY
primarily from:
1) Higher EGAT dispatch of 7 SPPS under GJP due to fewer major overhaul in
-22.2% YoY 2020 compared to 2019 (1 SPP in 2020 vs. 6 SPPs in 2019)
2) Lower depreciation expense from redetermination of machinery and
equipment lifetime of 2 IPPs
3,197
840 2,487
Share of profit from GJP (incl. FX) in 2020 was THB 2,487 million, down 22.2% YoY,
26
mainly from significant decrease in FX gain from the appreciation of THB against USD
(from THB 840 million in 2019 to THB 26 million in 2020)
+4.4%
2,357 2,461
YoY
2019 2020 FX Rate at End of Period
(THB/USD)
Share of profit (excluding FX) FX gain/loss
2018 32.6148
Total share of profit
2019 30.3313
2020 30.2068
12Net profit / Core profit
Record high core profit boosted by BKR2 but net profit affected by unrealized FX loss
Unit: THB million Core profit in 2020 was THB 4,478 million, up 27.6% Y0Y from THB 3,509
million in 2019, due mainly to:
1) Profit from BKR2 offshore wind farm in Germany in Q4’20
-12.4%YoY
2) Profit contribution from GCG, which COD in March 2020
3) Full year profit recognition from 12 SPPs under GMP (after gradual COD
4,887 during 2017-2019) and GTN1 & GTN2 (119 MW solar farm in Vietnam
4,282 which COD in 2019)
1,377
4) Improved gross profit margin from GMP and GJP as a result of lower average
natural gas price (-10.4% YoY; 272.9 THB/mmbtu → 244.5 THB/mmbtu) while
average Ft decreased (-2.4% YoY; (0.1160) THB/kWh → (0.1188) THB/kWh)
+27.6%
YoY 4,478 5) Dividend income of THB 440 million from INTUCH (THB 295mn) and
3,509 SPCG (THB 142mn)
Net profit in 2020 was THB 4,282 million, down 12.4% YoY despite improved
core profit, mainly from unrealized FX loss of THB 196 million
2019 2020 (196)
Core profit Gain (Loss) on FX Net profit
13Balance Sheet
Total Assets Total Liabilities Total Equity
+82.9% 245,581
Unit: THB million Unit: THB million Unit: THB million
30,354 +47.0%
+103.5%
173,501 72,080
29,643
134,278
21,531 49,040
215,226 85,238
63,555
9,809 143,858
6,488 31,556 7,968
111,861
75,429
1,174 1,174
10,613 8,053
(8,670)
31-Dec-19 31-Dec-20 31-Dec-19 31-Dec-20 (790) 31-Dec-19 31-Dec-20
Current assets Current liabilities
Non-current assets Non-current liabilities Total Paid-up capital and share premium
Retained earnings Other components
Other equity Minority
Total assets was THB 245,581 million, +82.9% mainly from: Total liabilities was THB 173,501 million, +103.5% Total equity was THB 72,080 million, +47.0% mainly
• Current: increase in cash from the capital increase and bond mostly from: from:
issuance • Current: increase in GULF’s short-term loans used as • Increase from the capital increase of THB 32,000
• Non-current: working capital million
1) increase in PPE from BKR2 consolidation and construction • Non-current: • Retained earnings increased by THB 1,479 million
progress of GSRC, GPD and Mekong phases 1-3 1) increase in debentures from bond issuance and from net profit of THB 4,282 million but offset by
2) increase in intangible assets and goodwill from investment consolidation of BKR2 outstanding bond dividend payment of THB 2,773 million
in BKR2 2) increase in financial derivative liabilities (mostly IRS • Decrease in other components of equity and non-
3) advance payments for land and power plant construction contracts) from TFRS9 adoption controlling interests mostly due to loss from fair value
in GSRC, GPD, and Mekong phase 1 3) long-term loan drawdowns for the GSRC and GPD measurement of IRS contracts required under TFRS9
4) increase in other non-current asset from shareholding in construction
INTUCH
14D/E ratios
Leverage ratios improved (1.47x) compared to bond covenant (3.50x)
Unit: THB million D/E ratios
3.88
Capital increase
173,501 3.50
140,864
2.62
2.38 2.41
85,238 80,750 2.16
77,161 72,080
1.86
49,040 49,830 1.74 1.64
1.59
1.52 1.47
22,998 1.27
14,810
1.25 1.35
31-Dec-19 31-Mar-20 30-Jun-20 30-Sep-20 31-Dec-20
Cash, cash Total Interest- Shareholders Shareholders' equity D/E
equivalents and liabilities bearing debt ’ equity (excl. other components
Net IBD/E
deposits used as of equity)
collateral Net IBD/E (incl. lease liabilities) to equity ratio (according to covenant of bonds
issued in 2019)*
31-Dec-19 31-Dec-20
Note:
* Net interest-bearing debt to equity (for bonds issued in 2019) = (Total interest-bearing debt incl.
lease liabilities - cash and cash equivalent - deposits at financial institutions used as collateral) /
(equity - other components of equity)
• IBD/E ratio was reduced to lower than 2x following the capital increase of THB 32,000 million via Rights Offering in Sep 2020, providing
more headroom for additional debt of THB 70-80 billion to reach 3:1 IBD/E ratio
15Dividend Payment
BOD approved dividend payment of THB 0.38 per share from the 2020 operating results
Historical Dividend Payment
• Gulf has a dividend payment policy to pay
out at least 30.0% of the Company’s 89% 88%
79%
separate net profit (after taxes), subject to
meeting the relevant legal reserve requirement 49%
and contractual obligations. 0.38
0.24 0.26
• On February 22, 2021, the Company’s Board of Dividend per share* (THB)
0.08
Directors approved the dividend payment of Payout ratio (%)
THB 0.38 per share, totaling THB 4,458.6
2017 2018 2019 2020
million, representing 87.8% of the separate net
profit (after tax).
Key Dates
• The declared dividend is subject to the
Ex-dividend date : March 5, 2021
Company’s shareholder approval in the AGM
to be held on April 9, 2021. Dividend payment date : April 28, 2021
Note: On April 16, 2020, GULF changed the par value from THB 5/share to THB 1/share. The calculation of dividend per share have been adjusted retrospectively for the par split.
16Index Business Updates Q4’20 & FY 20 Financial Performance Appendix
Power Generation
Power capacity growth (committed PPAs)
Gross Installed Capacity (MW):                                                                            Gross Capacity by Fuel Types

                                                                               13,704   13,704   14,304
                                                                    12,934                                           Apr 2021                               Year 2027
                                                         10,839                                                                            13,566 MW
                                                                                                          6,463 MW
                                               9,514                                                        (91%)                            (95%)
                                    7,903
                         7,072                                                                                                                            IPP: 11,172 MW (78%)
  5,919    6,409                                                                                                IPP: 4,069 MW (58%)
                                                                                                                                                          SPP: 2,394 MW (17%)
                                                                                                                SPP: 2,394 MW (34%)

                                                                                                                                                                                 738 MW
                                                                                                                                  609 MW                                          (5%)
                                                                                                                                   (9%)
  2019     2020      Apr-21         2021       2022      2023       2024        2025    2026     2027             7,072 MW                                 14,304 MW
   Operating       IPD           Mekong Wind          Oman        HKP        Burapa     Gulf1     Total                         Power Generation           Renewables

Equity Installed Capacity (MW):                                                                           Equity Capacity by Fuel Types
                                                                               7,705    7,705    7,915
                                                                    7,328
                                                                                                                     Apr 2021                               Year 2027
                                                         6,023
                                               5,095                                                      3,058 MW                             7,429 MW
                                                                                                            (89%)                                (94%)
                                    4,028
                                                                                                                                                          IPP: 6,197 MW (78%)
  2,701    2,959     2,959                                                                                      IPP: 1,826 MW (53%)
                                                                                                                                                          SPP: 1,232 MW (16%)
                                                                                                                SPP: 1,232 MW (36%)

                                                                                                                                                                                 486 MW
                                                                                                                                      365 MW                                      (6%)
                                                                                                                                       (11%)
  2019     2020      Apr-21         2021       2022      2023       2024        2025    2026     2027
                                                                                                                     3,422 MW                                7,915 MW
   Operating       IPD           Mekong Wind          Oman        HKP        Burapa     Gulf1     Total
                                                                                                                                 Power Generation           Renewables

                                                                                                                                                                                 19
Power Generation
Operating Projects - Gulf JP – 2 IPPs & 7 SPPs (4,237 MW)
Gulf JP Company Limited
2 IPPs 7 SPPs
40% 60% Installed Electricity: 3,406 MW Electricity: 831 MW
capacity Steam: 92 TPH
Contracted Electricity: 3,200 MW Electricity: 838 MW
2 IPPs: 7 SPPs: capacity Steam: 68 TPH
PPA: Signed with EGAT,
for 25 years
✓ Signed with EGAT,
for 25 years
✓
GKP1 GKP2
GSA: Signed with PTT ✓ Signed with PTT ✓
EPC:
Signed with MPW* &
STECON
✓ Signed with Toyo Engineering &
MIT-Power
✓
GTLC GNNK
LTSA: Signed with MPW ✓ Signed with SIEMENS ✓
GNLL GCRN
COD: 2014 – 2015 2013
Project cost: Approx. THB 41,000 mn Approx. THB 44,000 mn
GNK2
*MHPS changed its name to Mitsubishi Power, Ltd. (MPW)
20Power Generation
Operating Projects - Gulf MP – 12 SPPs (1,563 MW)
Gulf MP Company Limited
Gulf MP – 12 SPPs
70% 30%
Electricity: 1,563.4 MW
Installed capacity
Steam: 225.0 TPH
All projects in operation Electricity: 1,489.7 MW
Contracted capacity
Steam: 210.5 TPH
PPA: Signed with EGAT, for 25 years ✓
COD
2017
GVTP GTS1 GTS2 GTS3
GSA: Signed with PTT ✓
COD 16 May 2017
✓ COD 8 Jul 2017
✓ COD 1 Sep 2017
✓
COD 1 Nov 2017
✓ EPC: Signed with Toyo Engineering ✓
COD LTSA: Signed with SIEMENS and GE ✓
2018
GTS4 GNC GBL GBP
COD 1 Jan 2018
✓ COD 1 Mar 2018
✓ COD 1 Sep 2018
✓
COD 1 Nov 2018
✓ COD: 2017 – 2019
Project cost: THB 6,000 - 6,200 mn / SPP
COD
2019
✓ ✓ ✓ ✓
GNLL2 GNPM GNRV1 GNRV2
COD 1 Jan 2019 COD 1 Mar 2019 COD 1 May 2019 COD 1 Jul 2019
21Power Generation
IPD (Total 5,300 MW)
Independent Power Development Company Limited
Gulf SRC Gulf PD
70%* 30%
(*75% dividends)
COD 2021 COD 2022 COD 2023 COD 2024
Installed
Capacity:
2,650 MW 2,650 MW
GSRC
Contracted
2,500 MW 2,500 MW
✓
Unit 1 Unit 3 Capacity:
COD COD
31 Mar 2021 Mar 2022 Location: WHA Eastern Seaboard Rojana Rayong 2
662.5 MW 662.5 MW Industrial Estate 1, Industrial Park,
Chonburi province, Thailand Rayong province, Thailand
Unit 2 Unit 4
COD COD PPA: Signed with EGAT, Signed with EGAT,
Oct 2021 Oct 2022 for 25 years for 25 years
662.5 MW 662.5 MW
GPD
GSA: Signed with PTT Signed with PTT ✓
EPC: Signed with MPW*, MPW-PTC** Signed with MPW*, MPW-PTC**
Unit 1
COD
Unit 3
COD and STECON and STECON ✓
Mar 2023 Mar 2024
662.5 MW 662.5 MW
LTSA: Signed with MPW-PTC** Signed with MPW-PTC**
✓
Unit 2 Unit 4 Fuel Type: Gas-fired Gas-fired
COD COD
Oct 2023 Oct 2024
Project Cost: THB 50.0 billion Approx. THB 50.0 billion
662.5 MW 662.5 MW
*Mitsubishi Power, Ltd. (MPW)
**MHI Power Project (Thailand) Co., Ltd. (MPW-PTC) 22Power Generation
IPPs under development in Thailand
Construction and development progress as planned for all projects
Hin Kong Power Burapa Power
Installed
Capacity: 1,540 MW 600 MW
Shareholding: 49% GULF 35% GULF
51% RATCH Group 65% NPS
Location: Hin Kong subdistrict, Khao Hin Son subdistrict,
Mueang district, Phanom Sarakham district,
Ratchaburi province, Thailand Chachoengsao province, Thailand
Fuel Type: Gas-fired Gas-fired
SCOD: Unit 1: Mar 2024 (770 MW) Nov 2027
Unit 2: Jan 2025 (770 MW)
Project Cost: [to be disclosed] [to be disclosed]
Status: • EIA approval obtained • EIA approval obtained
• EPC contract signed in Sep 2020 • Start construction by 2025
• Expect to finalize GSA in Q2 2021
• Expect to start construction in mid 2021
Note: Project progress as of March 2021 23Power Generation
DIPWP Project in Oman
Potential to expand business in Duqm SEZ
Duqm Independent Power & Water Project (DIPWP)
Location: Duqm Special Economic Zone, Oman
OQ (previously Oman Oil) Kuwait Petroleum
Installed Power: ≈ 326 MW
49.0% 51.0% 50.0% 50.0%
Capacity: Water: ≈ 1,667 m3/hour
Contracted Power: ≈ 208 MW DUQM SEZ
100.0% Capacity: Water: ≈ 1,250 m3/hour
Water Gas Power In operation
Business Business Business Fuel type: Gas/Diesel
Under construction/
Electricity
Future Future DIPWP Gas turbine: SIEMENS SGT800 development
Projects Projects
Future
Projects
Desalinated Capacity: 230,000 bbl/day
Project cost: US$7,000m
EPC: Signed with consortium of 4 companies:
water
1) Alghanim International General Trading &
Contracting Co. W.L.L.
2) Cobra Instalaciones y Servicios S.A.
3) Sojitz Corporation
Potential Projects 4) Tecnicas De Desalinizacion De Aguas
• GULF directly holds 49% shares in Marafiq
• Marafiq has exclusive rights to provide utility services in Duqm SEZ PPA: Signed with Duqm Refinery for 25 years
for 25 years with a 25-year additional term (+5 years renewal)
Project cost: ≈ USD 483 million
• Opportunities to jointly develop and operate future utilities projects
in Duqm SEZ with Marafiq:
SCOD: • Phase 1 (40 MW power and 50m3/h
➢ Generation and supply of electricity, water, steam, district cooling water): May 2021
➢ Waste water and sewerage collection and treatment • Phase 2 (286 MW): 2022
➢ Industrial waste management and waste incineration
➢ Natural gas and industrial gases Status: Duqm SEZ
Under construction: 89.32% Completed
Note: Project progress as of March 2021 24Plant Performance
GJP – 2 IPPs (3,406 MW) GJP – 7 SPPs (831 MW) GMP – 12 SPPs (1,563 MW)
Average Heat Rate 7,029 7,684 7,680 7,662 7,413 7,444
6,886 6,916 7,384
(BTU/kWh)
2018 2019 2020 2018 2019 2020 2018 2019 2020
Plant Availability 96.7% 98.0% 97.6% 98.4% 98.4% 98.3% 98.0%
94.9% 94.1%
(%)
2018 2019 2020 2018 2019 2020 2018 2019 2020
Dispatch Factor 80.9% 76.9% 80.7% 81.5% 81.3% 79.5%
(%)
36.4%
19.0% 19.5%
2018 2019 2020 2018 2019 2020 2018 2019 2020
25A B C
Maintenance Schedule SIEMENS
MHPS
A (3 days)
CI (10 days)
B (18 days)
TI (18 days)
C (22 days)
MI (35 days)
GE CI (1 days) HGPI (18 days) MO (22 days)
2019 2020 2021
Group Project Type COD
Quarter 1 Quarter 2 Quarter 3 Quarter 4 Quarter 1 Quarter 2 Quarter 3 Quarter 4 Quarter 1 Quarter 2 Quarter 3 Quarter 4
GKP1 SPP C A
GKP2 SPP C A
GTLC SPP C A
GNNK SPP 2013 C A
GJP GNLL SPP A C A
GCRN SPP C A
GNK2 SPP A C A
GNS IPP 2014 A
GUT IPP 2015 B B
GVTP SPP A B A
GTS1 SPP A B A
2017
GTS2 SPP A B A
GTS3 SPP A B
GTS4 SPP A B
GNC SPP A A A A A B
GMP 2018
GBL SPP A A
GBP SPP A A
GNLL2 SPP A A
GNPM SPP A A
2019
GNRV1 SPP A A A A
* A * A * A *
GNRV2 SPP A A A * A * A * A *
As of Feb 2021 * 1 unit 26Percentage of Power Sold to EGAT and IUs
EGAT:
Q1/21
10% ✓ 25-year PPAs with EGAT
Industrial Users ✓ 80% Minimum Offtake (SPPs)
✓ Receive Availability Payment (IPPs) regardless of electricity dispatch
✓ Fuel cost and FX pass-through
90% Industrial Users (IUs):
✓ 15-year Long Term Agreements
✓ 50 – 70% Minimum Take
✓ Diversified customers across different sectors
2027E
5%
Industrial Users
95%
27Power Sold to Industrial Customers
Well-diversified customers limit impact from economic downturn
Most of Gulf’s power generation capacity are secured with
EGAT’s PPAs while industrial users are diverse in sectors
Petchem &
Food & Chemicals, 6%
Beverage, 6%
Q1/21 Textiles, 5%
Electronics, 8%
90%
Packaging, 9%
Others, 13%
10%
Construction
Material, 8%
Automotive,
46%
Industrial Users
Industrial Customers Load Factor • Normal seasonality
IU customers = 622 MW COD contracted as of Mar 2021 • Slight drop due to long
public holidays
63.5% 64.9%
63.0% 62.6% 62.4% 61.9%
59.2% 57.3% 58.6%
54.7% 56.8%
49.0% 50.3%
45.9%
Feb-20 Mar-20 Apr-20 May-20 Jun-20 Jul-20 Aug-20 Sep-20 Oct-20 Nov-20 Dec-20 Jan-21 Feb-21 Mar-21
28Renewable Energy
Renewable Energy

   Operating Projects - Gulf Chana Green Biomass Project (25 MW)

                                Gulf Chana Green Co., Ltd.
                                                             Gulf Chana Green (GCG)
                                                             Location:       Songkhla, Thailand
                                    100%
                                                             Installed       25.0 MW
                                                             capacity:

                                                             Contracted      20.6 MW
                                                             capacity:

                                                             Fuel type       Parawood

                                                             Tariff          EP + Ft + Bt 1.3/kWh adder for 7 years
                                                                             after COD
                                              SONGKHLA
                                                             PPA             Signed with EGAT          ✓
                                                             EPC             Signed with STEC          ✓
                               In operation
                                                             COD:            Mar 2020

                               Under construction/           Project cost:   Approx. THB 2,300 million
                               development

                                                             2020            EGAT dispatch factor: 91.5%
                                                             Performance     Plant availability: 89.9%
                                                             Highlight:

                                                                                                                      30
Renewable Energy
Operating Projects - GTN1 and GTN2 (119 MW) Solar Projects in Vietnam
GTN1 GTN2
Location Tay Ninh, Vietnam Location Tay Ninh, Vietnam
Installed capacity Approx. 69 MW Installed capacity Approx. 50 MW
GULF (90%) GULF (90%)
Shareholding Shareholding
TTC Group (10%) TTC Group (10%)
Fuel type Solar Fuel type Solar
EPC Signed with JGC Vietnam EPC Signed with JGC Vietnam
Offtaker Vietnam Electricity (EVN) Offtaker Vietnam Electricity (EVN)
Tariff US9.35c./kWh Tariff US9.35c./kWh
PPA Signed with EVN for 20 years PPA Signed with EVN for 20 years
COD 6 Mar 2019 COD 19 Apr 2019
Project cost USD 60.0 million Project cost USD 46.7 million
• 2020 Capacity factor: approx. 17.3%
• 2020 Plant availability: 99.7%
31Renewable Energy
Mekong Wind Project in Vietnam
Mekong offshore wind project in Vietnam progressing as planned
Mekong Wind
Installed
Capacity:
up to 310 MW
Shareholding: 95% GULF
5% TTC Group
Location: Ben Tre Province, Vietnam
Off-taker Vietnam Electricity (EVN)
Tariff US 9.8c./kWh
Fuel Type: Offshore wind
Status & SCOD: • Phase 1 (30 MW): SCOD May 2021
Overall progress 63.52% completed
• Phases 2-3 (98 MW): SCOD Oct 2021
Overall progress 11.32% completed
• Phases 4-8 (182 MW):
Under MOIT consideration to be included in
PDP8 within [Q2’21]
Project cost USD 651 million
Note: Project progress as of March 2021 32Renewable Energy
Borkum Riffgrund 2 Offshore Wind Project in Germany (464.8 MW)
Borkum Riffgrund 2 started to contribute revenue and profit to the Company since Q4’20
Location: German North Sea
≈ 59 km northwest of Norddeich harbor
≈ 34 km north from the island of Borkum
100.0% Installed capacity: 464.8 MW
Ørsted Wind Power
GIH A/S
Fuel type: Offshore Wind
100.0% 100.0%
BKR2 Holding Ørsted HoldCo. Tariff: Year 1 – 9.5:
50.0% 50.0% FiT backed by German government
Year 9.5 – 20:
Borkum merchant price with guaranteed floor
Riffgrund 2 price
PPA: Signed with Ørsted for 20 years
✓ Project in operation, with revenue and profit
SWA (Services and Signed with MHI Vestas Offshore Wind
recognizable to GULF since Q4’20
Warranty Agreement) for 10 years + 5 years extendable
✓ Strategic partnership with the global market Investment Cost ≈ EUR 550 million
leader in offshore wind (Ørsted) would increase
GULF’s credibility and competitiveness on a Project Cost: Project cost = EUR 4mn/MW Germany
global scale In operation
COD Apr 2019
✓ Long term contracted cash flows backed by Under construction/
development
the German government
Q4’20 Capacity 52.7%
Factor:
33Infrastructure & Utilities
Infrastructure & Utilities

         Infrastructure and utilities projects in Thailand
         Public Private Partnership (PPP) in Thailand
                                                          Map Ta Phut Ph.3                                   Laem Chabang Ph.3                            M6 & M81 Motorways

         Consortium:                       70% GULF                                               40% GULF                                     40% GULF
                                           30% PTT Tank Terminal                                  30% PTT Tank Terminal                        40% BTS Group
                                                                                                  30% China Harbour Engineering                10% STEC
                                                                                                                                               10% RATCH Group
         Investment Type:                  PPP                                                    PPP Net Cost                                 PPP Gross Cost
         Authority:                        Industrial Estate Authority of Thailand (IEAT)         Port Authority of Thailand (PAT)             Department of Highways (DOH)

         Scope:                            • Ph.1: Land reclamation                               • Design, build, O&M F1 and F2 Terminals     • Ph.1: Design & construction
                                           • Ph.2: LNG terminal                                   • 4 MTEU/year                                        ➢ Toll collection system, traffic
                                             (up to 10.8 MTPA)                                                                                           management & control system
                                                                                                                                               • Ph.2: O&M

         Construction Period:              • Ph.1: 3 years (2021 – 2024)                          • F1: 3 years (2023 – 2025)                  3 years (2021 – 2024)
                                           • Ph.2: 2 years (2024 – 2026)                          • F2: 3 years (2027 – 2029)

         Operation Period:                 30 years                                               35 years                                     30 years
         Investment Cost:                  Ph.1: THB 11.0 billion                                 THB 30.0 billion                             [to be disclosed]
                                           Ph.2: THB [30.0] billion
         Status:                           • PPP contract signed in Oct 2019                      • PPP contract signing expected in Q2 2021   • PPP contract signing expected within Q2 2021
                                           • EPC contract signed in Jul 2020
                                           • NTP1 & Construction expected to start in May 2021*

 *subject to IEAT issue NTP1
 Note: Project progress as of March 2021                                                                                                                                                   35
Infrastructure & Utilities
One Bangkok
Private Partnership in Thailand
Shareholding:
Investment Type: Private partnership
Off-taker: 100% by Customers in One Bangkok Project
Construction Period/ SCOD:
• 2021: EPC contract signing in Jan • 2024: DCS Ph. 2 SCOD (8,000 RT)
Nature of Business: Electricity Distribution District Chilled Water • 2022: Power SCOD • 2025: DCS Ph.3 SCOD (2,000 RT)
System Distribution System • 2023: DCS Ph.1 SCOD (25,000 RT) • 2026: DCS Ph.4 SCOD – All facilities
(Power) (DCS)
completion
Installed Capacity: 240 MW 40,000 RT
Connected Capacity: Operation Period: 30 years from SCOD
123 MW 36,000 RT
Project Cost: THB 3,100 million
Status: EPC contract for DCS (BSE) signed in Jan 21
Power EPC expected in 1H’21
Note: Project progress as of March 2021 36Gas
Gas

LNG Shipper Licenses

                       License Holder   Gulf LNG                   Hin Kong Power Holding Ltd.

                       Import Amount    300,000 TPA                1,400,000 TPA

                       Usage            19 SPPs under Gulf group   Hin Kong Power Project
                                        (partially)

                       License          10 years (extendable)      10 years (extendable)

                                                                                            38
Gas
Investment in PTT NGD
GULF acquired 42% of PTT NGD, strengthening its commitment in the Gas Business
Established: 1996 Rojana Industrial Park (Ayudhaya)
Bangpa-In Industrial Estate
58% 42% Business Nature: Nava Nakorn Industrial Estate
• Operates a natural gas distribution Rangsit Industrial Area
business
AMATA • Purchases natural gas from PTT at Bangkadi Industrial Park
wholesale price and sells gas to over
20% 250 industrial customers at retail price
80% in 13 industrial areas Lad Krabang Industrial Estate
• Revenue linked with fuel oil
• Cost linked with pool gas price Bang Plee Industrial Estate
& M-Thai Industrial Estate
Bang Poo Industrial Estate &
Sales volume (2020): Bang Poo Mai Industrial Area
✓ GULF acquired 40% ordinary shares in PTT approx. 28 million mmbtu/year
Amata City Chonburi
NGD from International Power S.A. in Dec. 2020
Status:
✓ GULF acquired 2% ordinary shares in PTT In operation, with profit to be Hemaraj Eastern
NGD from CPBE in April 2021 recognizable to GULF in Q1 2021 Seaboard Industrial Estate
& Eastern Seaboard
Industrial Estate
✓ Investment cost THB 2,830 mn (for 42% shares) Amata City
Rayong
✓ Strengthen GULF’s gas business
Source: PTT NGD
39Debt Outstanding
THB 17,500 mn in debentures &
THB 11,500 mn in short-term loans
40% 70% 75%* 75%* 90% 100% 50%
GULF JP GULF MP GULF SRC GULF PD GTN1 & 2 GULF BKR2
Chana Green
57% 74% 71% 85%
THB 43% THB THB THB
36,492 34,857 19,126
USD 26% 29% 10,135 100% 100% 100%
mn mn mn 15%
896 USD USD mn THB 1,927 mn
USD USD 79 mn EUR 703 mn
mn 405 mn 260 mn
60 mn
Total Loan
outstanding
THB 63,548 mn THB 49,115 mn THB 26,981 mn THB 11,955 mn THB 2,372 mn THB 1,927 mn THB 25,942 mn
(THB equivalent)
• All of the power projects in Thailand have long term loans of 20 - 23 years (vs. PPA term of 25 years).
• To mitigate interest rate fluctuation, the company entered into interest rate swaps to swap interest rate from floating rate into fixed rate for 18 - 20 years.
Note:
* Based on % profit sharing received from GSRC & GPD
** FX rate: 30.2068 THB/USD
*** Debt outstanding exclude subsidiaries’ working capital borrowings
40Investment Plan (2021F – 2030F)
GULF’s Investment Plan Use of Funds in 2021
Unit: THB billion
≈ THB 30 – 40 billion
for projects including;
POWER GENERATION RENEWABLE ENERGY GAS
• 5,300 MW IPPs • Mekong Wind • Gulf LNG
approx. 30 - 40 • Hin Kong Power • Gulf1 projects
(Year 2021) • Burapa Power INFRASTRUCTURE OTHER INVESTMENTS
• Oman DIPWP • Map Ta Phut 3 • Future projects
• Laem Chabang 3
• Motorway projects
approx. 60 - 70
(Year 2022 - 2030)
Source of Funds
A combination of:
• Internal cash flow from operating projects
• Bond issuance
approx. 90 - 110 • Long-term loans from financial institutions
(Year 2021 - 2030)
41Disclaimer This document is for information and reference only and does not constitute or form part of and should not be construed as, an offer to sell or issue or subscription of, or the solicitation of an offer to buy or acquire any securities of Gulf Energy Development Public Company Limited (the “Company”) in any jurisdiction or an inducement to enter into investment activity. The information contained in this document has not been independently verified. No representation, warranty or undertaking, express or implied, is made as to, and no reliance should be placed on, the fairness, reliability, accuracy, completeness or correctness of the information or the opinions contained herein. This document should not be regarded by recipients as a substitute for the exercise of their own judgment. The information contained in this document should be considered in the context of the circumstances prevailing at the time and has not been, and will not be, updated to reflect developments which may occur after the date of the document. None of the Company or any of its affiliates, directors, officers, employees, agents, advisors or representatives shall have any liability whatsoever (in negligence or otherwise) for any damages or loss howsoever arising from any use of this document or its contents or otherwise arising in connection with the document. This document contains "forward-looking statements", which include all statements other than statements of historical facts, including, without limitation, any statements preceded by, followed by or that include the words "targets", "believes", "expects", "aims", "intends", "will", "may", "anticipates", "would", "could" or similar expressions or the negative thereof. Such forward-looking statements involve known and unknown risks, uncertainties and other important factors beyond the control of the Company that could cause the actual results, performance or achievements of the Company to be materially different from future results, performance or achievements expressed or implied by such forward-looking statements. You are cautioned not to rely on such forward-looking statements. Neither the Company nor any of its respective affiliates, agents, employees, advisors or representatives intends or has any duty or obligation to supplement, amend, update or revise any of the forward-looking statements contained in this document. This document contains data sourced from and the views of independent third parties. In such data being replicated in this document, the Company does not make any representation, whether express or implied, as to the accuracy of such data. The replication of any views in this document should be not treated as an indication that the Company agrees with or concurs with such views.
IR Contact
Gulf Energy Development Public Company Limited
Investor Relations Department
87 M.Thai Tower 11th Floor, All Seasons Place, Wireless Road,
Lumpini, Pathumwan, Bangkok 10330, Thailand

Tel:       +66(0) 2080 4488
Fax:       +66(0) 2080 4455
Email:     ir@gulf.co.th
Website:   www.gulf.co.th
You can also read