Association of bleb formation with peri aneurysmal contact in unruptured intracranial aneurysms - Nature
←
→
Page content transcription
If your browser does not render page correctly, please read the page content below
www.nature.com/scientificreports
OPEN Association of bleb formation
with peri‑aneurysmal contact
in unruptured intracranial
aneurysms
Toru Satoh1,5*, Takanobu Yagi2,5*, Yoichi Sawada3, Kenji Sugiu4, Yu Sato4 & Isao Date4
The mechanism of bleb formation in unruptured intracranial aneurysms (UIAs) remains unclear.
This study aimed to investigate the association between peri-aneurysmal contact (PAC) and bleb
formation. Forty-five aneurysms were classified depending on the presence of blebs and PAC using
computed tomographic angiography and magnetic resonance imaging. Aneurysmal hemodynamics
were assessed using computational fluid dynamics. The independent variables associated with bleb
formation were statistically assessed. Fourteen aneurysms (31.1%) had blebs, all of which were
located at the site of PAC (group A). Thirty-one aneurysms (68.9%) had no bleb, of which 13 had a
PAC (group B) and 18 had no PAC (group C). PAC was the only independent variable associated with
bleb formation (p < 0.05). Aneurysmal volumes were significantly higher in group A, followed by
groups B and C in series. Aneurysmal wall shear stress (WSS) tended to be lowest in group A, followed
by groups B and C in series. The maximum WSS at the blebs was only 17% of the maximum WSS at
the aneurysmal domes. This study demonstrated that bleb formation in UIAs was associated with
the establishment of PAC during their growth, which may have more detrimental effects on bleb
formation than hemodynamics.
Abbreviations
3D 3-Dimensional
CFD Computational fluid dynamics
CTA Computed tomographic angiography
MRA Magnetic resonance angiography
MRC Magnetic resonance cisternography
MRI Magnetic resonance imaging
PAC Peri-aneurysmal contact
VWS Vascular wall stress
WSS Wall shear stress
UIA Unruptured intracranial aneurysm
An intracranial aneurysm is a disease state of the cerebral artery, which often bulges outward to form a saccular
shape. The prevalence of unruptured intracranial aneurysms (UIAs) is 3–5% in the adult population1,2. The
annual rate of aneurysmal rupture is approximately 1%3,4, resulting in subarachnoid hemorrhage with a high
mortality rate of 45%5. UIAs at a higher risk of rupture are treated with surgical or endovascular therapies. The
rupture risk is often associated with their morphology, such as size, aspect ratio, and bleb f ormation3,4,6. A bleb
is a secondary bulge of the aneurysmal wall, which may be caused by a focal increase in wall vulnerability, but
the mechanism of bleb formation in UIAs remains unclear.
Peri-aneurysmal contact (PAC) and intra-aneurysmal hemodynamics may be associated with bleb forma-
tion. Several studies that compared ruptured and unruptured aneurysms demonstrated that ruptured aneurysms
1
Department of Neurological Surgery, Ryofukai Satoh Neurosurgical Hospital, 5‑23‑23 Matsunaga, Fukuyama,
Hiroshima 729‑0104, Japan. 2Center for Advanced Biomedical Sciences, Waseda University, 2‑2 Wakamatsucho,
Shinjukuku, Tokyo 162‑8480, Japan. 3Department of Contemporary Welfare, Faculty of Health and Welfare,
Okayama Prefectural University, Okayama, Japan. 4Department of Neurological Surgery, Okayama University
Graduate School of Medicine, Okayama, Japan. 5These authors contributed equally: Toru Satoh and Takanobu
Yagi. *email: ucsfbtrc@urban.ne.jp; yagi.takanobu1977@gmail.com
Scientific Reports | (2022) 12:6075 | https://doi.org/10.1038/s41598-022-10064-8 1
Vol.:(0123456789)www.nature.com/scientificreports/
Category
Nr 45
Male/female 13/32
Age (y.o.) 65.07 ± 9.57
Location (Nr.) 45
MCA 19
AComA 15
IC-PC 5
BA-tip 4
AChorA 2
Outcome (Nr.) Clipped: 7
Coiled: 2
SAH: 1
Follow up:35
Table 1. Clinical features. AChorA, anterior choroidal artery; AComA, anterior communicating artery;
BA-tip, tip of the basilar artery; IC-PC, internal carotid-posterior communicating artery; MCA, middle
cerebral artery; SAH, subarachnoid hemorrhage.
were larger and more irregular with more constraints due to the presence of P AC7–10. Hemodynamic parameters
associated with bleb formation have been explored in UIAs, resulting in two schools of thought: one supported
strong inflow jets and high wall shear stress (WSS)11–13 and the other supported low WSS and a high shear stress
gradient14,15.
The above studies required further clarification on the association of bleb formation with PAC, especially in
UIAs, since the morphology of aneurysms changes more or less after rupture16. In addition, previous studies have
not compared the effects of PAC and hemodynamics. Thus, the present study aimed to investigate the association
between PAC and bleb formation in UIAs, including effects due to aneurysmal morphology and hemodynamics.
Methods
Patient population. This retrospective study was approved by the Institutional Review Board (IRB) of
Satoh Neurosurgical Hospital, and the protocols used in the study were approved by the Committee of Human
Subjects Protection of the Satoh Neurosurgical Hospital, Hiroshima, Japan. All methods were performed in
accordance with the relevant guidelines and regulations. Informed consent was obtained from all patients to use
their clinical data. Forty-nine UIAs from 49 consecutive patients between September 2017 and August 2019 were
analyzed. Four patients were excluded due to poor imaging, resulting in a total of 45 aneurysms enrolled in this
study (13 men and 32 women). The mean age of patients was 65.07 ± 9.57 years (mean ± SD), with a range of 39
to 78 years. The locations of the aneurysms were as follows: 19 in the middle cerebral artery (MCA) (42.2%), 15
in the anterior communicating artery (AComA) (33.3%), five in the internal carotid-posterior communicating
artery (IC-PC) (11.1%), four in the tip of the basilar artery (BA-tip) (8.9%), and two in the anterior choroidal
artery (AChorA) (4.4%). Outcomes for these aneurysms included clipping (7 cases), coiling (2 cases), follow-up
(4 cases), and subarachnoid hemorrhage (1 case) (Table 1). Treated aneurysms (10 cases) were analyzed using
image datasets taken less than three months before treatment, and untreated aneurysms (35 cases) were analyzed
based on the initial diagnosis.
CTA. Three-dimensional computed tomographic angiography (CTA) was performed using a multidetector
CT system (Activion-16; Canon Medical Systems). The Real-Prep scan mode was used with 100 ml of contrast
agent (Iomeron, iodine concentration 350 mg/mL; Eizai Pharmaceutical) injected at 3 mL/s into the antecubital
vein. The imaging parameters included a 16-cm field of view, 512 × 512 matrix, section thickness of 0.5 mm,
scanning time of 8 s, and a total of 201 images. The original volume data were interpolated into a matrix of
1024 × 1024 pixels and a thickness of 0.3 mm using a workstation (Ziostation-2, Ziosoft/AMIN, Tokyo).
MRI. Magnetic resonance cisternography (MRC), in combination with magnetic resonance angiography
(MRA), was performed for each patient on a 3 T unit (Signa Pioneer; GE Healthcare, Milwaukee, WI). A heav-
ily T2-weighted 3D fast spin-echo sequence was used for the MRC with the following parameters: TR/TE,
1900/100 ms; field of view, 180 × 180 mm; matrix, 356 × 256; section thickness, 1.2 mm; NEX,1; bandwidth,
31.2 kHz; echo-train length, 128; acquisition time, 6 min. Sixty axial images were acquired. The volume data
were interpolated into 1024 × 1024 pixels matrix and a thickness of 0.3 mm using the workstation.
CFD. Computational fluid dynamics (CFD) was performed using a commercial CFD package (Hemo-
scope v1.4, EBM Corp., Tokyo). Blood was assumed to be an incompressible Newtonian fluid with a density of
ρ = 1050 kg/m3 and viscosity μ = 0.004 Pa·s. Vascular geometries were reconstructed from CTA datasets and filled
with unstructured hexahedral cells mainly. The mesh size was 0.25 mm in far-wall regions. The near-wall mesh
consisted of three layers, with a width of 0.125 mm and a height of 0.05 mm at the wall-nearest mesh. Unsteady
Scientific Reports | (2022) 12:6075 | https://doi.org/10.1038/s41598-022-10064-8 2
Vol:.(1234567890)www.nature.com/scientificreports/
pulsatile simulations were carried out as a time step was adjusted to keep the Courant number less than one. As
for boundary conditions, a time-averaged flow rate Q was first estimated using a formula Q = (τπ⁄32μ) D3, where
τ is a magnitude of WSS (τ = 1.5 Pa) 17 and D is the diameter of the inlet artery. The distribution of flow rate at
vascular bifurcations was set to be a ratio of the cubic diameters of the branches. A physiological pulsatile wave-
form was imposed on the steady flow rate18.
Data extraction. Aneurysmal morphology. Based on the CTA datasets, a surface mesh of the vascular ge-
ometries was obtained. Aneurysmal shape indices (neck width, dome depth, aspect ratio, dome surface area, and
dome volume) was computed using a surface mesh (Hemoscope v1.4, EBM Corp., Tokyo). The neck was defined
as a plane whose location was determined by neurosurgeons. The neck width was the diameter of a circle with
an area equal to that of the neck. Dome depth was defined as the length from the neck center perpendicularly
towards the dome.
Identification of blebs and PAC. Blebs were determined by neurosurgeons as secondary focal bulges distin-
guishable from an aneurysmal dome based on 3D-CTA datasets. The peri-aneurysmal environment was visu-
alized using 3D multifusion CTA and MRC images9. The presence of PAC was judged based on whether the
aneurysms overlapped with the surrounding structures. If aneurysms harbored blebs, the location of the bleb
relative to PAC was determined. If they overlapped each other, the bleb location was classified as either central
or marginal; a central-type bleb had no overlap with a marginal region of PAC, and a marginal-type bleb had at
least a partial overlap with a marginal region of PAC.
Aneurysmal hemodynamics. The mean WSS at the parent artery (WSS-p) and aneurysmal dome (WSS-d) were
computed, including their ratio (normalized WSS, NWSS). The location of the parent artery was chosen imme-
diately upstream of the aneurysm. In aneurysms harboring a bleb, the mean, minimum, and maximum WSS at
the bleb including the bleb neck were computed, and the ratio of the maximum WSS at the bleb to that of the
whole dome was computed (normalized maximum WSS, NMWSS).
Statistical analysis. A categorical regression analysis was carried out to identify an independent variable
associated with bleb formation among aneurysmal morphology, hemodynamics, and PAC by quantifying nomi-
nal, ordinal, and numeric variables using optimal scaling and assigning numerical values to the different catego-
ries. The dependent variable was the presence of blebs, and the independent variables were age, sex, shape (dome
depth, aspect ratio, dome volume), hemodynamic indices (WSS-p, NWSS), and the presence of PAC. Descriptive
analysis of continuous variables was performed, including the calculation of the means, standard deviations,
medians, and 99% confidence intervals (99% CI) for all variables. The correlations between the quantitative and
qualitative variables were analyzed using Pearson’s or Spearman’s correlation analyses. Accordingly, statistical
differences in aneurysmal shape and hemodynamic indices were analyzed between groups using the Kruskal–
Wallis test followed by the Steel–Dwass multiple comparison test. Data were analyzed using the IBM Statistical
Package for the Social Sciences (SPSS) for Windows version 25 (IBM Corp., Armonk, NY) with the Categories
module and R version 4.0.2. Statistical significance was set at p < 0.05.
Results
Classification of aneurysms. Forty-five aneurysms were classified in terms of the presence of blebs and
PAC. Fourteen aneurysms (31.1%) had blebs (group A), and all these aneurysms not only exhibited the presence
of PAC, but also the locations of the blebs and PAC were found to match fairly well, which was also confirmed
during intraoperative observations for clipped aneurysms. Thirty-one aneurysms (68.9%) had no bleb, of which
13 had PAC (group B) and 18 had no PAC (group C). No patient exhibited a bleb without PAC. Table 2 sum-
marizes these data together with the mean and standard deviations of the ages, shape indices, and hemodynamic
indices of the subjects. Details of the data are presented in Supplementary Table 2.
Factors associated with bleb formation. Table 3 summarizes the results of a categorical regression
analysis of 45 aneurysms to determine a significant factor associated with bleb formation, including aneurys-
mal shape indices, hemodynamic indices, and the presence of PAC. Since strong positive associations were
found between neck width and dome depth (r = 0.752, p < 0.001), dome surface area and dome volume (r = 0.997,
p < 0.001), and WSS-d and NWSS (r = 0.817, p < 0.001), these three variables (neck width, dome surface area,
WSS-d) were excluded from the independent variables. The categorical regression analysis resulted in F (12,
32) = 4.932, p < 0.001, R2 = 0.649, and an adjusted R2 of = 0.517. The presence of PAC was the only significant
factor associated with bleb formation (β = 0.476, p = 0.038).
Association of aneurysmal shape with hemodynamics. Aneurysmal shape and hemodynamic indi-
ces were compared between the three groups using the Kruskal–Wallis test (Fig. 1). Five shape indices (neck
width, dome depth, aspect ratio, dome surface area, and dome volume) and two hemodynamic indices (WSS-d
and NWSS) were significantly different: neck width: χ2(2) = 12.33, p < 0.05; dome depth: χ2 (2) = 20.20, p < 0.05;
aspect ratio: χ2 (2) = 14.14, p < 0.05; dome surface area: χ2 (2) = 21.99, p < 0.05; dome volume: χ2 (2) = 21.37,
p < 0.05; WSS-p: χ2 (2) = 2.28, n. s.; WSS-d: χ2 (2) = 14.91, p < 0.05; and NWSS: χ2 (2) = 23.32, p < 0.05). Dome
depth, dome surface area, and dome volume were significantly higher in groups A, B, and C in series (p < 0.05,
Steel–Dwass multiple comparison test). Aneurysmal wall shear stress (WSS-d, NWSS) tended to be lowest in
Scientific Reports | (2022) 12:6075 | https://doi.org/10.1038/s41598-022-10064-8 3
Vol.:(0123456789)www.nature.com/scientificreports/
Category Group-A Group-B Group-C
Bleb Yes No No
Contact Yes Yes No
Age (y.o.) 64.79 ± 8.65 63.00 ± 12.58 66.78 ± 7.85
Location (Nr.) 14 13 18
MCA 1 10 8
AComA 7 2 6
IC-PC 5 0 0
BA-tip 1 0 3
AChorA 0 1 1
Neck width (mm) 5.71 ± 1.87 3.99 ± 0.85 5.53 ± 9.13
Dome depth (mm) 4.94 ± 2.55 2.83 ± 1.20 4.87 ± 14.77
Aspect ratio 0.87 ± 0.42 0.70 ± 0.33 0.48 ± 0.30
Dome surface area (mm2) 118.23 ± 79.69 40.60 ± 23.43 18.77 ± 13.53
Dome volume (mm3) 155.64 ± 130.89 34.25 ± 28.12 12.28 ± 12.48
WSS-p 3.07 ± 1.39 5.54 ± 4.46 4.88 ± 3.18
WSS-d 1.24 ± 0.64 3.43 ± 3.35 6.80 ± 5.55
NWSS 0.44 ± 0.24 0.56 ± 0.21 1.34 ± 0.60
Table 2. Aneurysmal shapes and hemodynamic features of the three groups. Group A: Bleb (Yes), Contact
(Yes), Group B; Bleb (No), Contact (Yes); Group C; Bleb (No); Contact (No). NWSS, normalized wall shear
stress; WSS, wall shear stress; WSS-p, WSS at the parent artery; WSS-d, WSS at the aneurysmal dome. All data
are expressed as mean ± standard deviation.
Standardized
coefficients
Independent variables Beta SE Degree of freedom F-value p-value Adjusted R2
Age (years) 0.101 0.227 1 0.200 0.657
Sex (0: female/1: male) 0.097 0.118 1 0.669 0.420
Depth (mm) 0.174 0.419 1 0.172 0.681
Aspect ratio -0.221 0.338 3 0.428 0.734
0.517
Volume (mm3) 0.536 0.449 2 1.422 0.256
WSS-p -0.269 0.250 2 1.158 0.327
NWSS 0.228 0.234 1 0.955 0.336
Contact (0: without/1: with contact) 0.476 0.221 1 4.662 0.038
Table 3. Results of the categorical regression analysis for determining a substantial factor of bleb formation.
NWSS, normalized wall shear stress; Contact, perianeurysmal contact; WSS, wall shear stress; WSS-p, WSS at
the parent artery.
group A, followed by groups B and C in series, but the difference between groups A and B was not statistically
significant.
Association of blebs with hemodynamics. In group A, the association between bleb formation and
aneurysmal hemodynamics was investigated. Table 4 summarizes the mean, minimum, and maximum WSS of
the blebs, including the bleb necks and the whole domes together with the ratio of the maximum WSS of the bleb
to that of the whole dome, referred to as the NMWSS. The NMWSS is an indicator of the elevation of the WSS at
the bleb in each aneurysm. The NMWSS ranged from 0.03% to 0.36%, with a mean of 0.17 ± 0.10 (mean ± SD).
In other words, the maximum WSS at the bleb was only 17% of the maximum WSS in the entire dome. By ana-
lyzing streamlines, the bleb locations were investigated to determine whether they were located in the inflow,
intermediate, or outflow regions. In our datasets, we were unable to find a tendency for an association between
bleb location and the flow regions. Figure 2 shows representative cases with blebs at inflow, intermediate, and
outflow regions.
Scientific Reports | (2022) 12:6075 | https://doi.org/10.1038/s41598-022-10064-8 4
Vol:.(1234567890)www.nature.com/scientificreports/
Figure 1. Comparison of aneurysmal shapes and hemodynamic indices between the three groups. (A) Group
A; (B) Group B; (C) Group C. * p < 0.05.
Association of blebs with PAC. Table 4 summarizes the association of bleb formation with PAC (group
WSS of Bleb mean (Min– WSS of whole dome Location of Bleb at
Case No Location of aneurysms Max) Pa mean (Min–Max) Pa NMWSS Contact contact area Outcome
1 Rt ICPC 0.33 (0.10–1.76) 0.60 (0.10–10.0) 0.18 Medial temporal lobe Marginal region Clipped
2 AComA 0.93 (0.21–2.01) 1.12 (0.21–8.53) 0.24 Frontal lobe Marginal region F/U
3 AComA 0.23 (0.21–0.27) 1.54 (0.21–5.11) 0.05 Frontal lobe Marginal region Clipped
4 AComA 1.29 (0.28–3.39) 1.70 (0.01–15.45) 0.22 Frontal lobe Marginal region Coiled
5 Rt ICPC 0.16 (0.03–1.42) 1.07 (0.03–7.12) 0.20 Medial temporal lobe Marginal region F/U
6 Rt ICPC 1.14 (0.15–3.12) 2.81 (0.15–14.60) 0.21 Medial temporal lobe Marginal region Coiled
7 Lt ICPC 0.12 (0.03–0.26) 1.80 (0.03–8.46) 0.03 Medial temporal lobe Central region Clipped
8 AComA 0.31 (0.07–1.44) 0.98 (0.04–5.93) 0.24 Frontal lobe Marginal region Clipped
9 Lt MCA 0.03 (0.01–0.11) 0.26 (0.01–3.70) 0.03 Temporal lobe Marginal region F/U
10 Lt ICPC 0.06 (0.01–0.24) 0.45 (0.01–5.54) 0.04 Oculomotor nerve Marginal region Clipped
11 AComA 0.80 (0.23–1.49) 1.58 (0.23–7.01) 0.21 Optic chiasma Marginal region Clipped
12 AComA 0.30 (0.03–1.46) 0.98 (0.03–5.83) 0.25 Optic chiasma Marginal region Clipped
13 AComA 0.43 (0.11–1.29) 1.34 (0.11–15.32) 0.08 Frontal lobe Marginal region F/U
14 BA-tip 0.34 (0.07–1.61) 1.12 (0.07–4.48) 0.36 Diencepharon Marginal region SAH
Overall 0.11 (0.03–3.39) 0.45 (0.01–15.45) 0.17 ± 0.10 (n = 14)
Table 4. Hemodynamic details of WSS and the relationship between blebs and PAC in group A. NMWSS,
normalized maximum wall shear stress; SAH, subarachnoid hemorrhage.
A). First, all of these blebs coincided with the location of the PAC. Furthermore, most blebs were located in the
marginal region of the PAC (93%). The three cases shown in Fig. 2 illustrate these blebs. Tissues under contact
included the brain parenchyma and the cranial nerves.
Discussion
The rupture risk of UIAs during follow-up is often diagnosed based on their morphology, such as their size,
aspect ratio, and bleb formation3,4,6. Blebs may be formed due to a focal increase in wall vulnerability, but the
mechanism of bleb formation in UIAs remains to be understood. The present study is the first to examine the
spatial characteristics of bleb location in UIAs in terms of both PAC and intra-aneurysmal hemodynamics.
Scientific Reports | (2022) 12:6075 | https://doi.org/10.1038/s41598-022-10064-8 5
Vol.:(0123456789)www.nature.com/scientificreports/
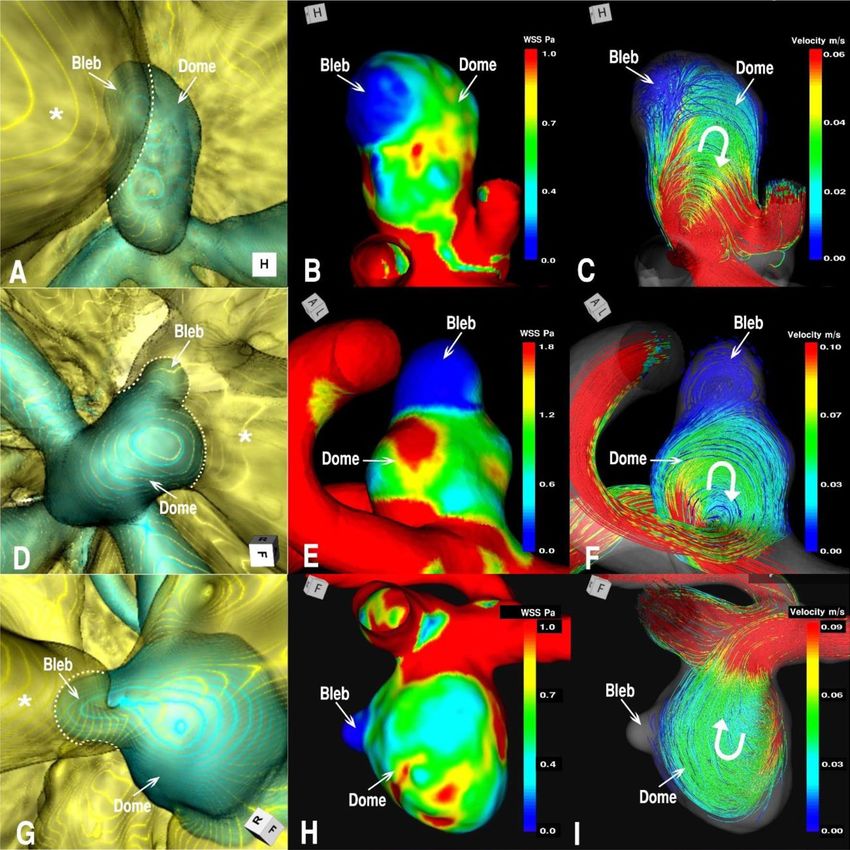
Figure 2. Relationship between a bleb and PAC with hemodynamics (WSS and streamlines) in group A. Blebs
at the inflow region in AComA case 3 (A–C), at the intermediate region in AComA case 8 (D–F), and at the
outflow region in case 10 of the left IC-PC (G–I) aneurysms are depicted. (A, D, G) 3D multifusion images
of CTA and MRC visualizing the blebs in contact with the adjacent rectal gyri of the frontal lobe (*) in A and
D, and with the oculomotor nerve (*) in G. The dotted lines represent the borders of contact with the brain or
cranial nerves. Note that the blebs are located in the marginal region of the contact area. (B, E, H) Distribution
of the mean WSS over the bleb and whole dome, showing relatively low WSS at the bleb. (C, F, I) Intra-
aneurysmal streamlines in relation to the bleb, showing a bleb at the inflow (C), intermediate (F), and outflow
(I) locations. The curved arrows indicate the direction of the streamlines.
The main result of this study was the discovery that aneurysms harboring blebs not only exhibited the pres-
ence of PAC, but also the location of the blebs matched that of the PAC. In addition, PAC was an independent
variable significantly associated with bleb formation, as opposed to aneurysmal shape and hemodynamic indices.
We also found that aneurysms harboring blebs were significantly larger than those without blebs. In particular,
a comparison of group A (bleb (+), PAC (+)) with group B (bleb (−), PAC (+)) suggested that bleb formation
may be associated with the establishment of PAC during aneurysmal growth.
The pathophysiological mechanism of intracranial aneurysms has been studied using human pathologi-
cal specimens19–22 and animal m odels23–26. Flow-induced, inflammation-mediated biological reactions that are
thought to be involved in the formation and progression of intracranial aneurysms27. To the best of our knowl-
edge, however, there has been no reports that investigated the pathology of bleb. Since a bleb is a focal secondary
bulge of aneurysmal wall, the underlying mechanism may be associated with a focal increase of wall vulnerability.
As previously described, the formation and progression of intracranial aneurysms may be linked to aberrant
hemodynamics19,27. As for bleb formation, two schools of thought exist: one supports strong inflow jets and high
WSS11–13 and the other supports low WSS and a high shear stress gradient14,15. In our study, we first classified the
Scientific Reports | (2022) 12:6075 | https://doi.org/10.1038/s41598-022-10064-8 6
Vol:.(1234567890)www.nature.com/scientificreports/
bleb locations into inflow, intermediate, and outflow regions; however, we were unable to find a specific tendency
between the bleb location and flow region. Then, we focused on the WSS at the bleb neck, which was assumed to
reflect the WSS at the initiation of bleb. The amount of WSS was only 17% of that of the entire dome. This find-
ing suggests that bleb formation may not be associated with an elevation of WSS. Since the present study treated
limited sample sizes, understanding the association between WSS and bleb formation may need larger samples.
Another pathway to increase the vulnerability of aneurysmal walls may be involved. The establishment of
PAC may focally constrain the deformation of aneurysmal wall in a mechanical point of view, resulting in a
state of stress concentration by which the wall vulnerability is focally accelerated. Vascular wall stress (VWS) is
a mechanical stress that acts on the inside of the vascular wall, which is linked to blood pressure, and is differ-
ent from WSS, which acts on the inner surface of the vascular wall due to fluid viscosity and has no association
with blood pressure. Although there were a number of studies that reported on the biomechanics of intracranial
aneurysms, most studies focused on WSS only and did not consider the effect of VWS, despite the fact that the
VWS (often termed ‘stretch’) is deeply associated with the conditions of smooth muscle cells (SMCs)28. Kataoka
et al.29 speculated the VWS may be associated with the initiation of aneurysm, and WSS may not be, as opposed
to the conventional theory that related the aneurysmal initiation with the elevation of WSS. Seshaiyer and
Humphrey30 investigated VWS together with the effect of mechanical constraint using finite element analysis.
They demonstrated that the wall constraint decreased the VWS, but there was an exceptional location, or a
site near the contact, where the VWS significantly increased (stress concentration). Although their simulation
did not include the effect of biological reactions, a concentrated VWS may cause SMC death. Indeed, various
reports have shown an association between VWS and SMC a poptosis28. Furthermore, SMC death is known to
be involved in ruptured intracranial aneurysms in human s pecimens22. These insights led us to hypothesize that
the emergence of PAC may yield a concentrated VWS, cause cell death of SMCs, and result in bleb formation
due to the increase in wall vulnerability.
Limitation
This study had several limitations. The sample size was limited, particularly in group A. Future studies should
increase the number of aneurysms. Furthermore, future work should include a prospective study to investigate
bleb formation over time. The presence of PAC was judged using 3D multifusion imaging, which has a certain
uncertainty due to imaging and thresholding. Therefore, in this study, we confirmed the presence of PAC with
intraoperative observations for clipped aneurysms. CFD needed various assumptions, such as the blood prop-
erties and boundary conditions. Although these uncertainties existed, our interpretation were believed to be
unassociated with these uncertainties.
Conclusion
This study is the first to examine the spatial environment of bleb location in UIAs in terms of both PAC and
intra-aneurysmal hemodynamics. The data demonstrated that bleb formation in UIAs was associated with the
establishment of PAC during their growth, which may have more detrimental effects on bleb formation than
hemodynamics.
Received: 27 November 2021; Accepted: 1 April 2022
References
1. Vernooij, M. W. et al. Incidental findings on brain MRI in the general population. N. Engl. J. Med. 357, 1821–1828 (2007).
2. Vlak, M. H., Algra, A., Brandenburg, R. & Rinkel, G. J. Prevalence of unruptured intracranial aneurysms, with emphasis on sex,
age, comorbidity, country, and time period: a systematic review and meta-analysis. Lancet. Neurol. 10, 626–636 (2011).
3. UCAS Japan Investigators, Morita, A. et al. The natural course of unruptured cerebral aneurysms in a Japanese cohort. N. Engl. J.
Med. 366, 2474–2482 (2012). DOI: https://doi.org/10.1056/NEJMoa1113260.
4. Murayama, Y. et al. Risk analysis of unruptured intracranial aneurysms: prospective 10-year cohort study. Stroke 47, 365–371.
https://doi.org/10.1161/STROKEAHA.115.010698 (2016).
5. Brisman, J. L, Song, J.K. & Newell D.W. Cerebral aneurysms. N. Engl. J. Med. 355, 928–939 (2006). DOI:https://doi.org/10.1056/
NEJMra052760.
6. Mocco, J. et al. Aneurysm morphology and prediction of rupture: An international study of unruptured intracranial aneurysms
analysis. Neurosurgery 82, 491–496. https://doi.org/10.1093/neuros/nyx226 (2018).
7. Sugiu, K. et al. Influence of the perianeurysmal environment on rupture of cerebral aneurysms. Preliminary observation. Interv.
Neuroradiol. (Suppl 1) 6, 65–70 (2000). DOI: https://doi.org/10.1177/15910199000060S107.
8. Ruíz, D. S. M. et al. Is the rupture of cerebral berry aneurysms influenced by the perianeurysmal environment?. Acta Neurochir.
82, 31–34. https://doi.org/10.1159/000313441 (2002).
9. Satoh, T. et al. Influence of perianeurysmal environment on the deformation and bleb formation of the unruptured cerebral aneu-
rysm: assessment with fusion imaging of 3D MR cisternography and 3D MR angiography. AJNR Am. J. Neuroradiol. 26, 2010–2018
(2005).
10. Ruíz, D. S. M. et al. The perianeurysmal environment: influence on saccular aneurysm shape and rupture. AJNR Am. J. Neuroradiol.
27, 504–512 (2006).
11. Cebral, J. R., Sheridan, M. & Putman, C. Hemodynamics and bleb formation in intracranial aneurysms. AJNR Am. J. Neuroradiol.
31, 304–310 (2010).
12. Russell, J. H. et al. Computational fluid dynamic analysis of intracranial aneurysmal bleb formation. Neurosurgery 73, 1061–1068.
https://doi.org/10.1227/NEU.0000000000000137 (2013).
13. Salimi Ashkezari, F. S. et al. Hemodynamic conditions that favor bleb formation in cerebral aneurysms. J. Neurointerv. Surg. 13,
231–236 (2021).
14. Shojima, M. et al. Role of shear stress in the blister formation of cerebral aneurysms. Neurosurgery 67, 1268–1274. https://doi.org/
10.1227/NEU.0b013e3181f2f442 (2010).
Scientific Reports | (2022) 12:6075 | https://doi.org/10.1038/s41598-022-10064-8 7
Vol.:(0123456789)www.nature.com/scientificreports/
15. Machi, P. et al. Hemodynamics of focal versus global growth of small cerebral aneurysms. Clin. Neuroradiol. 29, 285–293 (2019).
16. Kono, K., Tomura, N., Yoshimura, R. & Terada, T. Changes in wall shear stress magnitude after aneurysm rupture. Acta Neurochir.
(Wien) 155, 1559–1563 (2013).
17. Zarins, C. K., Zatina, M. A., Giddens, D. P., Ku, D. N. & Glagov, S. Shear stress regulation of artery lumen diameter in experimental
atherogenesis. J. Vasc. Surg. 5, 413–420 (1987).
18. Ford, M. D., Alperin, N., Lee, S. H., Holdsworth, D. W. & Steinman, D. A. Characterization of volumetric flow rate waveforms in
the normal internal carotid and vertebral arteries. Physiol. Meas. 26, 477–488 (2005).
19. Frösen, J. et al. Saccular intracranial aneurysm: pathology and mechanisms. Acta Neuropathol. 123, 773–786 (2012).
20. Frösen, J. et al. Lipid accumulation, lipid oxidation, and low plasma levels of acquired antibodies against oxidized lipids associate
with degeneration and rupture of the intracranial aneurysm wall. Acta Neuropathol. Commun. 1, 71–84. https://doi.org/10.1186/
2051-5960-1-71 (2013).
21. Laaksamo, E. et al. Oxidative stress is associated with cell death, wall degradation, and increased risk of rupture of the intracranial
aneurysm wall. Neurosurgery 72, 109–117 (2013).
22. Frösen, J. Smooth muscle cells and the formation, degeneration, and rupture of saccular intracranial aneurysm wall-a review of
current pathophysiological knowledge. Transl. Stroke Res. 5, 347–356 (2014).
23. Aoki, T., Kataoka, H., Morimoto, M., Nozaki, K. & Hashimoto, N. Macrophage-derived matrix metalloproteinase-2 and -9 promote
the progression of cerebral aneurysms in rats. Stroke 38, 162–169 (2007).
24. Aoki, T. et al. NF-kB is a key mediator of cerebral aneurysm formation. Circulation 116, 2830–2840 (2007).
25. Aoki, T. et al. Impact of monocyte chemoattractant protein-1 deficiency on cerebral aneurysm formation. Stroke 40, 942–951
(2009).
26. Aoki, T. et al. Prostaglandin E2-EP2-NF-kB signaling in macrophages as a potential therapeutic target for intracranial aneurysms.
Sci. Signal 10, E6037. https://doi.org/10.1126/scisignal.Aah6037 (2017).
27. Frösen, J., Cebral, J., Robertson, A. M. & Aoki, T. Flow-induced, inflammation-mediated arterial wall remodeling in the formation
and progression of intracranial aneurysms. Neurosurg. Focus 47, E21. https://doi.org/10.3171/2019.5.FOCUS19234 (2019).
28. Mantella, L. E., Quan, A. & Verma, S. Variability in vascular smooth muscle cell stretch-induced responses in 2D culture. Vasc.
Cell 7, 7–16. https://doi.org/10.1186/s13221-015-0032-0 (2015).
29. Kataoka, H. et al. Hemodynamic and histopathological changes in the early phase of the development of an intracranial aneurysm.
Neurol. Med. Chir. (Tokyo) 60, 319–328. https://doi.org/10.2176/nmc.st.2020-0072 (2020).
30. Seshaiyer, P. & Humphrey, J. D. On the potentially protective role of contact constraints on saccular aneurysms. J. Biomech. 34,
607–612 (2001).
Acknowledgements
We would like to thank Ms. Megumi Sasaki, Ms. Kana Murakami and Mr. Yudai Abe of the Ryofukai Satoh
Neurosurgical Hospital for conducting the CTA and MRI examinations.
Author contributions
Y.S.(3) conducted statistical analyses and prepared Fig. 1 and Table 3. T.S. prepared Fig. 2 and Tables 1, 2 and 4.
T.Y. assisted in the preparation of Table 1, 2 and 4. K.S. and Y.S.(4), participated to discussion about the results
with I.D. T.S. and T.Y. wrote the manuscript. I.D. designed and organized the study. All authors contributed to
analysis and interpretation of data. All authors critically reviewed the manuscript.
Competing interests
The authors declare no competing interests.
Additional information
Supplementary Information The online version contains supplementary material available at https://doi.org/
10.1038/s41598-022-10064-8.
Correspondence and requests for materials should be addressed to T.S. or T.Y.
Reprints and permissions information is available at www.nature.com/reprints.
Publisher’s note Springer Nature remains neutral with regard to jurisdictional claims in published maps and
institutional affiliations.
Open Access This article is licensed under a Creative Commons Attribution 4.0 International
License, which permits use, sharing, adaptation, distribution and reproduction in any medium or
format, as long as you give appropriate credit to the original author(s) and the source, provide a link to the
Creative Commons licence, and indicate if changes were made. The images or other third party material in this
article are included in the article’s Creative Commons licence, unless indicated otherwise in a credit line to the
material. If material is not included in the article’s Creative Commons licence and your intended use is not
permitted by statutory regulation or exceeds the permitted use, you will need to obtain permission directly from
the copyright holder. To view a copy of this licence, visit http://creativecommons.org/licenses/by/4.0/.
© The Author(s) 2022
Scientific Reports | (2022) 12:6075 | https://doi.org/10.1038/s41598-022-10064-8 8
Vol:.(1234567890)You can also read