Brief communication: Ice sheet elevation measurements from the Sentinel-3A and Sentinel-3B tandem phase
←
→
Page content transcription
If your browser does not render page correctly, please read the page content below
The Cryosphere, 15, 3129–3134, 2021
https://doi.org/10.5194/tc-15-3129-2021
© Author(s) 2021. This work is distributed under
the Creative Commons Attribution 4.0 License.

Brief communication: Ice sheet elevation measurements from the
Sentinel-3A and Sentinel-3B tandem phase
Malcolm McMillan1 , Alan Muir2 , and Craig Donlon3
1 UK  Centre for Polar Observation & Modelling, Centre for Excellence in Environmental Data Science,
Lancaster University, Lancaster, LA1 4YW, UK
2 Department of Space and Climate Physics, Mullard Space Science Laboratory, University College London, Gower Street,

London, WC1E 6BT, UK
3 European Space Agency, European Space Research and Technology Centre (ESA ESTEC),

Keplerlaan 1, 2201 AZ Noordwijk, the Netherlands

Correspondence: Malcolm McMillan (m.mcmillan@lancaster.ac.uk)

Received: 6 August 2020 – Discussion started: 4 September 2020
Revised: 29 May 2021 – Accepted: 31 May 2021 – Published: 7 July 2021

Abstract. Over the coming decade, the quartet of Coperni-         surements up to a latitude of 81.35◦ , with an on-the-ground
cus Sentinel-3 satellite altimeters will provide a continuous     revisit time of 27 d. Unlike previous polar altimetry mis-
record of ice sheet elevation change. Ensuring consistency        sions, Sentinel-3 is part of the operational EU Copernicus
of measurement between the four satellites requires rigorous      Programme. As such Sentinel-3 is composed of four satel-
in-flight inter-comparison. To facilitate this, Sentinel-3B was   lites, which together will deliver unbroken coverage until at
initially flown in a unique tandem formation with Sentinel-       least the end of this decade. Because of this unique config-
3A, enabling near-instantaneous, co-located measurements          uration, it is vital that measurements from the four satellites
of surface elevation to be acquired. Here, we analyse tandem      (Sentinel-3A, B, C and D) are systematically compared in-
measurements of ice sheet elevation, to show that both instru-    flight, to determine whether their associated streams of data
ments operate with statistically equivalent accuracy and pre-     can be treated interchangeably by the scientific and service
cision, even over complex ice margin terrain. This analysis       user communities. This is important not only for long-term
demonstrates that both satellites can be used interchangeably     continuity, but also for optimising the use of these data when
to study ice sheet evolution.                                     more than one satellite is operating simultaneously. For ex-
                                                                  ample, at a latitude of 75◦ , adjacent tracks of a single satel-
                                                                  lite are separated by approximately 23 km, whereas when
                                                                  two identical satellites are flying in their nominal orbits, the
1   Introduction                                                  across-track separation decreases to around 11.5 km.
                                                                     The first two Sentinel-3 satellites (Sentinel-3A and
Long-term continuity of ice sheet elevation measurements          Sentinel-3B) were launched on 16 February 2016 and
is important for understanding the nature and drivers of ice      25 April 2018, respectively. To facilitate the inter-
sheet change (Sandberg Sørensen et al., 2018; Shepherd et         comparison of these satellites, Sentinel-3B was initially
al., 2019). Polar orbiting satellite radar altimeters have, for   placed into a “tandem” formation with Sentinel-3A, whereby
the past 30 years, provided such a record, and with it new in-    both satellites followed the same ground track (within the
sight into surface topography, ice mass loss, dynamical insta-    across-track control range of ±1 km) with a 30 s separation
bilities, surface processes and subglacial hydrology (Helm et     (Clerc et al., 2020). This configuration was maintained be-
al., 2014; Konrad et al., 2017, 2018; McMillan et al., 2013,      tween 7 June–16 October 2018, so as to acquire three full
2016, 2019; Slater et al., 2018). The most recent satellites      cycles of delay-Doppler measurements in this tandem forma-
contributing to this record are the Sentinel-3 series (Donlon     tion. Over Earth’s ice sheets, these measurements are impor-
et al., 2014), which provides delay-Doppler altimetry mea-

Published by Copernicus Publications on behalf of the European Geosciences Union.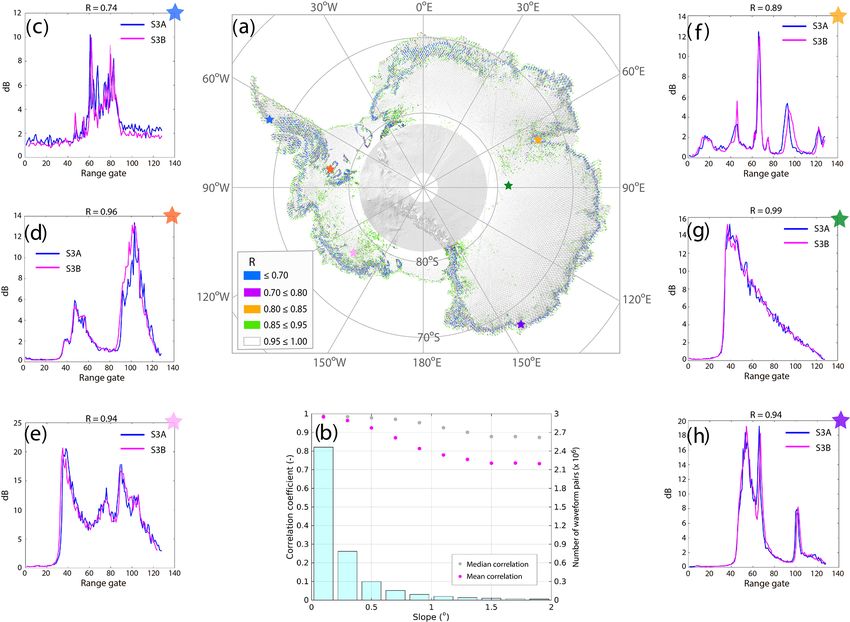
3130          M. McMillan et al.: Ice sheet elevation measurements from the Sentinel-3A and Sentinel-3B tandem phase

tant because they provide contemporaneous (within 30 s), co-          major challenges associated with processing delay-Doppler
located and co-orientated (i.e. same track heading and foot-          altimetry data over regions of complex topography, affect-
print orientation) observations. Such a configuration allows          ing both the retracking process and the Doppler beam stack-
a more robust inter-comparison than is normally possible,             ing employed by altimeters such as Sentinel-3. To evaluate
because it avoids many of the common challenges associ-               the impacts of complex topography upon delay-Doppler al-
ated with instrument inter-comparison, by removing the con-           timeter measurements, we therefore used the tandem phase to
founding effects of surface backscattering anisotropy (Ar-            investigate the consistency of simultaneously acquired S3A
mitage et al., 2014), and any spatial or temporal changes             and S3B waveforms over the entire Antarctic Ice Sheet. This
in elevation. In this study, we utilise this unique dataset to        analysis was motivated in part by the desire to determine
perform the first systematic inter-comparison of Sentinel-3A          whether (1) the complex waveform shape that is often ap-
and Sentinel-3B (S3A and S3B, respectively) tandem altime-            parent in coastal regions is essentially non-repeatable due
try measurements over ice sheets and to assess the extent to          to the pseudo-random combination of multiple reflections
which these measurements can be used interchangeably by               from within the Doppler beam footprint or (2) whether this
the glaciological community. Specifically, we analyse (1) the         waveform complexity is repeatable and therefore represents
consistency of S3A and S3B radar echoes acquired over the             meaningful geophysical information about the surface geom-
entire Antarctic Ice Sheet, (2) the precision of the S3A and          etry. This distinction is important, because the former im-
S3B instruments over Lake Vostok, and (3) the accuracy of             plies that the signal is somewhat degraded, particularly when
S3A and S3B elevation measurements as compared to inde-               it comes to making stable, repeatable measurements through
pendent reference datasets.                                           time. However, the latter implies that, whilst more sophis-
                                                                      ticated processing may be required, there is useable, phys-
                                                                      ically meaningful information encoded within the complex
2   Data and study sites                                              waveform shape. To investigate this question, we therefore
                                                                      analysed tandem acquisitions over the entirety of Antarctica
We analysed tandem phase Sentinel-3A and Sentinel-3B
                                                                      for one complete orbit cycle, comprising ∼ 4 million S3A–
SRAL data that were acquired during the summer of 2018,
                                                                      S3B co-located and co-orientated waveform pairs. To quan-
using the Level-2 enhanced data product (ESA Product Base-
                                                                      tify the similarity of each pair, we first aligned the waveforms
line 2.27; part of the Processing Baseline Collection 003).
                                                                      within the range window according to their centre of grav-
Our assessment focused on both continental-scale analysis
                                                                      ity and then computed the Pearson correlation coefficient, R,
(Sect. 3) and more targeted assessment at three study sites
                                                                      between each waveform pair (Fig. 1). Finally, we averaged
in East Antarctica (Sects. 4 and 5): the Lake Vostok and
                                                                      these measurements on a regular 5 by 5 km grid to investi-
Dome C sites, which exhibit relatively low-slope topography
                                                                      gate the extent to which the correlation coefficient varied as
that is characteristic of the ice sheet interior, and a coastal re-
                                                                      a function of ice sheet surface slope (Fig. 1).
gion of Wilkes Land (66–70◦ S, 135–147◦ E), which presents
                                                                         At the ice sheet scale, we find a very high level of agree-
steeper and less uniform topography (McMillan et al., 2019).
                                                                      ment between S3A and S3B waveforms, with 92 % of all
To assess the accuracy of the Sentinel-3A and Sentinel-3B
                                                                      waveforms having a correlation coefficient greater than 0.9.
elevation measurements at our study sites, we used airborne
                                                                      Importantly, high levels of correlation are not only limited
reference data acquired by the Airborne Topographic Map-
                                                                      to the relatively smooth interior of the ice sheet, but are also
per (ATM) and Riegl Laser Altimeter (RLA) instruments
                                                                      common across much of the ice sheet margin, which presents
carried on Operation IceBridge campaigns (Blankenship et
                                                                      steeper and more complex topography. In these cases, we find
al., 2012; Studinger, 2014). Further details of these datasets
                                                                      that although the altimeter waveforms display a high degree
and the method of inter-comparison are given in McMillan et
                                                                      of complexity, often with multiple peaks and a varying shape,
al. (2019).
                                                                      the S3A and S3B waveforms still maintain their coherency,
                                                                      both in terms of their shape (e.g. number of distinct peaks)
3   Consistency of delay-Doppler echoes acquired over                 and the amplitude of the backscattered signal (Fig. 1). This
    ice sheets                                                        suggests that meaningful, repeatable information is encoded
                                                                      within complex waveform morphology, opening up the fu-
When radar altimeters overfly areas of complex surface to-            ture possibility of utilising the full waveform to retrieve ad-
pography, the returned echo diverges from its classical shape         ditional topographic information (e.g. through the use of an
(Ray et al., 2015) and the range to the altimeter can also            auxiliary digital elevation model). Finally, we evaluated the
change rapidly. These effects can complicate the reliable re-         relationship between surface slope and S3A–S3B waveform
trieval of surface elevation information, because they can in-        consistency by comparing the average surface slope (Slater
duce distortions in the theoretical waveform shape, impact            et al., 2018) and average correlation coefficient, within 0.2◦
upon the multi-looking process, and lead to multiple super-           slope intervals (Fig. 1b). This clearly demonstrates the im-
imposed reflections from distinct surfaces within the Doppler         pact of surface slope upon waveform repeatability, namely
beam footprint. Handling these complex echoes is one of the           that R decreases with increasing slope. Nonetheless the re-

The Cryosphere, 15, 3129–3134, 2021                                                      https://doi.org/10.5194/tc-15-3129-2021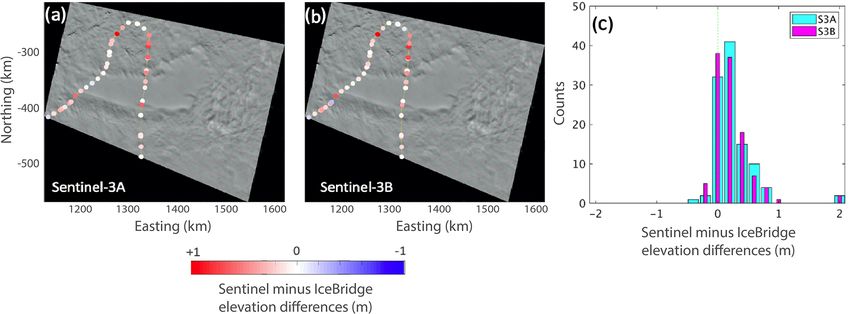
M. McMillan et al.: Ice sheet elevation measurements from the Sentinel-3A and Sentinel-3B tandem phase 3131
Figure 1. The repeatability of Sentinel-3A (S3A) and Sentinel-3B (S3B) tandem acquisitions over the Antarctica Ice Sheet. (a) The Pearson
correlation coefficient, R, for ∼ 4 million S3A–S3B tandem waveform pairs, averaged on a 5 × 5 km grid. The coloured stars indicate the
locations of the waveform pairs shown in panels (c)–(h). (b) The mean (magenta) and median (grey) correlation coefficient of waveform pairs
as a function of the gradient of surface slope. The turquoise bars show the number of waveform pairs averaged for each 0.2◦ slope interval.
(c–h) Examples of S3A–S3B waveform pairs with varying levels of complexity. In panel (a), the background image is a shaded relief of
Antarctica (Slater et al., 2018), and the 5 × 5 km grid utilises a WGS84 Antarctic Polar Stereographic projection with a central meridian of
0◦ and a standard parallel of 71◦ S.
duction in the correlation coefficient, R, is relatively modest, each satellite, we accumulated consecutive cycles acquired
with the mean R decreasing from R > 0.9 (slopes lower than during the tandem phase of operations (S3A cycles 34–36;
0.6◦ ), to R > 0.8 (slopes up to 1◦ ), to R > 0.7 (slopes up to S3B cycles 11–13). Inspecting these data, we find no dis-
2◦ ). cernible difference between the measurements made by each
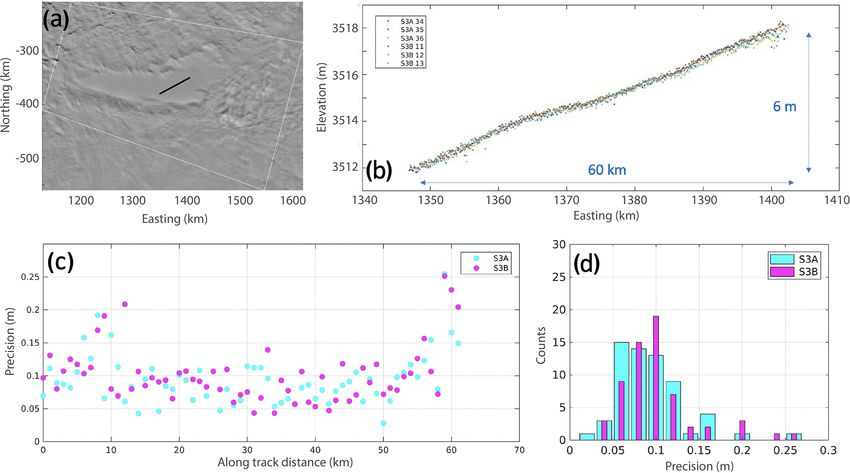
satellite (Fig. 2). To quantify the precision of both instru-
ments, and to determine whether there was a statistically
4 Assessment of instrument precision at Lake Vostok significant difference in their performance, we computed the
standard deviation of all measurements made by each satel-
Next, we assessed and inter-compared the precision of the lite within 1 km intervals along the satellite track. We used
Sentinel-3A and Sentinel-3B altimeters by evaluating re- the estimated standard deviation as a measure of the precision
peated elevation profiles that crossed the ice surface above of elevation measurements along the satellite track (Fig. 2),
subglacial Lake Vostok (Fig. 2). This site provides a stable, which averaged 0.09 and 0.10 m for S3A and S3B, respec-
relatively smooth (at the footprint scale) and low-slope sur- tively. Testing for significance (5 % significance threshold)
face that is well established for validation studies (McMillan using the non-parametric Mann–Whitney U (Hollander et
et al., 2019; Richter et al., 2014). We selected a track that al., 2015) and Kolmogorov–Smirnov (Massey, 1951) tests for
crossed above the central part of the subglacial lake and, for the central values and distribution, respectively, we find that
https://doi.org/10.5194/tc-15-3129-2021 The Cryosphere, 15, 3129–3134, 20213132 M. McMillan et al.: Ice sheet elevation measurements from the Sentinel-3A and Sentinel-3B tandem phase
Figure 2. Assessment of Sentinel-3A and Sentinel-3B instrument precision at Lake Vostok site. (a) Location of the ground track crossing
the central part of the lake (shown in black), which was used to assess precision; the background image is taken from the MODIS Mosaic
of Antarctica (Haran et al., 2006). (b) Repeated elevation profiles acquired during Sentinel-3A cycles 34–36 inclusive and Sentinel-3B
cycles 11–13 inclusive. (c) The standard deviation of Sentinel-3A and Sentinel-3B elevation measurements in 1 km intervals along the
satellite track. (d) The distribution of the 1 km interval standard deviations for Sentinel-3A and Sentinel-3B; there is no significant difference
in S3A and S3B precision at this site, at the 5 % significance level. In panels (a)–(c), the geographical coordinates refer to a WGS84 Antarctic
Polar Stereographic projection with a central meridian of 0◦ and a standard parallel of 71◦ S.
there is no significant difference in the instrument precision comparing the S3A and S3B biases and dispersions, we find
of Sentinel-3A and Sentinel-3B. absolute differences between the two sensors of 2 mm (dif-
ference in bias) and 0.01 m (difference in dispersion) at our
inland sites. At Wilkes Land, these absolute differences be-
5 Elevation accuracy tween S3A and S3B biases and dispersions increase to 0.19 m
(bias) and 0.64 m (dispersion), but they are still statistically
Finally, we assessed the absolute accuracy of Sentinel-3A insignificant. For context, the absolute bias and dispersions
and Sentinel-3B ice sheet measurements, by computing el- of each sensor relative to the reference data are of the order
evation differences relative to the Operation IceBridge ref- of 1–10 cm at our inland sites and of the order of 1 m at our
erence datasets described in Sect. 2, using the approach de- Wilkes Land site. This analysis therefore indicates that there
scribed in McMillan et al. (2019). We performed the analy- is no significant difference in the accuracy of the two instru-
sis at three different sites (two inland sites, Lake Vostok and ments across any of the sites studied and that it is reasonable,
Dome C, and one coastal site, Wilkes Land) and using the from an instrument fidelity perspective, to use data from both
two different retrackers provided in the ESA Level-2 prod- satellites interchangeably.
uct (the “ice margin” retracker and the threshold centre of
gravity (TCOG) retracker). Across all sites and retrackers,
we find that the differences in accuracy between S3A and 6 Conclusion
S3B are always insignificant (5 % significance level; using
the same statistical tests described in Sect. 4), both in terms This brief communication summarises the first detailed anal-
of the absolute biases relative to the reference datasets and ysis of Sentinel-3A and Sentinel-3B tandem phase measure-
the dispersion of the elevation differences (where the disper- ments of ice sheet elevation. We find that (1) there is no
sion is defined as the median absolute deviation from the me- significant difference between S3A and S3B instrument pre-
dian; Fig. 3). Using the TCOG retracker, for example, and cision, (2) that there is no significant difference between
The Cryosphere, 15, 3129–3134, 2021 https://doi.org/10.5194/tc-15-3129-2021M. McMillan et al.: Ice sheet elevation measurements from the Sentinel-3A and Sentinel-3B tandem phase 3133
Figure 3. Inter-comparison of Sentinel-3A and Sentinel-3B accuracy at the Lake Vostok Validation site. (a) Sentinel-3A minus IceBridge
elevation differences, (b) Sentinel-3B minus IceBridge elevation differences, (c) the distributions of Sentinel-3A and Sentinel-3B minus
IceBridge elevation differences. Results shown are for the TCOG retracking solution provided within the ESA Level-2 product, and for
acquisitions made during cycle 34 (S3A) and cycle 11 (S3B) within the tandem phase. The background image in panels (a) and (b) is taken
from the MODIS Mosaic of Antarctica (Haran et al., 2006). In panels (a) and (b), the geographical coordinates refer to a WGS84 Antarctic
Polar Stereographic projection with a central meridian of 0◦ and a standard parallel of 71◦ S.
the accuracy of S3A and S3B elevation measurements, and with contributions from AM and CD, and all authors reviewed the
(3) that there is a high degree of correlation in co-located manuscript.
waveforms acquired by both instruments, even over complex
coastal terrain. This study demonstrates that both satellites
can be used interchangeably to monitor ongoing ice sheet Competing interests. The authors declare that they have no conflict
evolution, effectively doubling the spatial coverage of mea- of interest.
surements available, now that Sentinel-3B has moved to its
nominal orbit. More broadly, it also establishes the value of
operating a tandem phase immediately after satellite launch Disclaimer. Publisher’s note: Copernicus Publications remains
neutral with regard to jurisdictional claims in published maps and
and demonstrates that such operations should be performed
institutional affiliations.
when the Sentinel-3C and Sentinel-3D units enter service in
the future.
Acknowledgements. This work was undertaken as part of the
European Space Agency funded Sentinel-3 Tandem for Cli-
Code availability. The underlying code used to perform the analy- mate study (http://s3tandem.eu, last access: 2 July 2021; contract
sis can be requested from the corresponding author. 4000124211/18/I-EF). The work was supported by the UK NERC
Centre for Polar Observation and Modelling, the Sentinel-3 Mission
Performance Centre, and the Lancaster University–UKCEH Centre
Data availability. The Sentinel-3 altimetry data used in this of Excellence in Environmental Data Science. We thank the editor
study (European Space Agency, 2021) were last accessed and two anonymous reviewers for their comments, which have sub-
from ESA on 9 November 2018 and can be freely down- stantially improved the manuscript.
loaded from the Copernicus Open Access Hub (https://scihub.
copernicus.eu/dhus/#/home). The IceBridge airborne altimetry
data used in this study are freely available from the US Na- Review statement. This paper was edited by Louise Sandberg
tional Snow and Ice Data Center (https://nsidc.org/, last access: Sørensen and reviewed by two anonymous referees.
1 June 2020): https://doi.org/10.5067/JV9DENETK13E (Blanken-
ship et al., 2012) and https://doi.org/10.5067/CPRXXK3F39RV
(Studinger, 2014).
Financial support. This research has been supported by the Euro-
pean Space Agency (grant no. 4000124211/18/I-EF) and the UK
Natural Environment Research Council (grant no. cpom300001).
Author contributions. MM designed the experiments. MM and AM
processed and analysed the data. MM prepared the manuscript
https://doi.org/10.5194/tc-15-3129-2021 The Cryosphere, 15, 3129–3134, 20213134 M. McMillan et al.: Ice sheet elevation measurements from the Sentinel-3A and Sentinel-3B tandem phase
References Massey, F. J. J.: The Kolmogorov–Smirnov Test for
Goodness of Fit, J. Am. Stat. Assoc., 46, 68–78,
Armitage, T. W. K., Wingham, D. J., and Ridout, A. L.: Me- https://doi.org/10.1080/01621459.1951.10500769, 1951.
teorological Origin of the Static Crossover Pattern Present in McMillan, M., Corr, H., Shepherd, A., Ridout, A., Laxon, S., and
Low-Resolution-Mode CryoSat-2 Data Over Central Antarc- Cullen, R.: Three-dimensional mapping by CryoSat-2 of sub-
tica, IEEE Geosci. Remote Sens. Lett., 11, 1295–1299, glacial lake volume changes, Geophys. Res. Lett., 40, 4321–
https://doi.org/10.1109/LGRS.2013.2292821, 2014. 4327, https://doi.org/10.1002/grl.50689, 2013.
Blankenship, D. D., Kempf, S. D., Young, D. A., Roberts, J. McMillan, M., Leeson, A., Shepherd, A., Briggs, K., Armitage, T.
L., van Ommen, T., Forsberg, R., Siegert, M. J., Palmer, W. K. T. W. K., Hogg, A., Kuipers Munneke, P., van den Broeke,
S. J., and Dowdeswell, J. A.: IceBridge Riegl Laser Al- M., Noël, B., van de Berg, W. J. W. J., Ligtenberg, S., Horwath,
timeter L2 Geolocated Surface Elevation Triplets, Ver- M., Groh, A., Muir, A., and Gilbert, L.: A high-resolution record
sion 1, NASA National Snow and Ice Data Center Dis- of Greenland mass balance, Geophys. Res. Lett., 43, 7002–7010,
tributed Active Archive Center, Boulder, Colorado USA, https://doi.org/10.1002/2016GL069666, 2016.
https://doi.org/10.5067/JV9DENETK13E, 2012, updated 2013. McMillan, M., Muir, A., Shepherd, A., Escolà, R., Roca, M.,
Clerc, S., Donlon, C., Borde, F., Lamquin, N., Hunt, S. E., Aublanc, J., Thibaut, P., Restano, M., Ambrozio, A., and Ben-
Smith, D., McMillan, M., Mittaz, J., Woolliams, E., Ham- veniste, J.: Sentinel-3 Delay-Doppler altimetry over Antarc-
mond, M., Banks, C., Moreau, T., Picard, B., Raynal, M., tica, The Cryosphere, 13, 709–722, https://doi.org/10.5194/tc-
Rieu, P., and Guérou, A.: Benefits and lessons learned 13-709-2019, 2019.
from the sentinel-3 tandem phase, Remote Sens., 12, 2668, Ray, C., Martin-Puig, C., Clarizia, M. P., Ruffini, G., Dinardo, S.,
https://doi.org/10.3390/RS12172668, 2020. Gommenginger, C., and Benveniste, J.: SAR Altimeter Backscat-
Donlon, C., Berruti, B., Buongiorno, A., Ferreira, M., Féménias, tered Waveform Model, IEEE T. Geosci. Remote, 53, 911–919,
P., Frerick, J., Goryl, P., Klein, U., Laur, H., Mavrocordatos, https://doi.org/10.1109/TGRS.2014.2330423, 2015.
C., Nieke, J., Rebhan, H., Seitz, B., Stroede, J., and Scia- Richter, A., Popov, S. V, Fritsche, M., Lukin, V. V, Matveev, A.
rra, R.: The Global Monitoring for Environment and Security Y., Ekaykin, A. A., Lipenkov, V. Y., Fedorov, D. V, Eberlein, L.,
(GMES) Sentinel-3 mission, Remote Sens. Environ., 120, 37– Schröder, L., Ewert, H., Horwath, M., and Dietrich, R.: Height
57, https://doi.org/10.1016/j.rse.2011.07.024, 2014. changes over subglacial Lake Vostok, East Antarctica: Insights
European Space Agency: Sentinel-3 Surface Topography Mission from GNSS observations, J. Geophys. Res., 119, 2460–2480,
(STM) Level-2 enhanced product, Copernicus Open Access Hub https://doi.org/10.1002/2014JF003228, 2014.
[data set], available at: https://scihub.copernicus.eu/dhus/#/home Sandberg Sørensen, L., Simonsen, S. B., Forsberg, R., Khvoros-
(last access: 2 July 2021), 2021. tovsky, K., Meister, R., and Engdahl, M. E.: 25 years of eleva-
Haran, T., Bohlander, J., Scambos, T., Painter, T., and Fahnestock, tion changes of the Greenland Ice Sheet from ERS, Envisat, and
M.: MODIS mosaic of Antarctica (MOA) image map, NASA CryoSat-2 radar altimetry, Earth Planet. Sc. Lett., 495, 234–241,
National Snow and Ice Data Center Distributed Active Archive https://doi.org/10.1016/J.EPSL.2018.05.015, 2018.
Center, Boulder, Colorado USA, 2006. Shepherd, A., Gilbert, L., Muir, A. S., Konrad, H., McMil-
Helm, V., Humbert, A., and Miller, H.: Elevation and elevation lan, M., Slater, T., Briggs, K. H., Sundal, A. V., Hogg,
change of Greenland and Antarctica derived from CryoSat- A. E., and Engdahl, M. E.: Trends in Antarctic Ice Sheet
2, The Cryosphere, 8, 1539–1559, https://doi.org/10.5194/tc-8- Elevation and Mass, Geophys. Res. Lett., 46, 8174–8183,
1539-2014, 2014. https://doi.org/10.1029/2019GL082182, 2019.
Hollander, M. A., Wolfe, D., and Chicken, E.: Nonparametric Sta- Slater, T., Shepherd, A., McMillan, M., Muir, A., Gilbert, L., Hogg,
tistical Methods, 3rd edn., John Wiley & Sons, Inc., Hoboken, A. E., Konrad, H., and Parrinello, T.: A new digital eleva-
NJ, USA, 2015. tion model of Antarctica derived from CryoSat-2 altimetry, The
Konrad, H., Gilbert, L., Cornford, S. L., Payne, A., Hogg, Cryosphere, 12, 1551–1562, https://doi.org/10.5194/tc-12-1551-
A., Muir, A., and Shepherd, A.: Uneven onset and pace 2018, 2018.
of ice-dynamical imbalance in the Amundsen Sea Embay- Studinger, M.: IceBridge ATM L2 Icessn Elevation, Slope, and
ment, West Antarctica, Geophys. Res. Lett., 44, 910–918, Roughness, Version 2, NASA National Snow and Ice Data Cen-
https://doi.org/10.1002/2016GL070733, 2017. ter Distributed Active Archive Center, Boulder, Colorado USA,
Konrad, H., Shepherd, A., Gilbert, L., Hogg, A. E., McMil- https://doi.org/10.5067/CPRXXK3F39RV, 2014.
lan, M., Muir, A., and Slater, T.: Net retreat of Antarc-
tic glacier grounding lines, Nat. Geosci., 11, 258–262,
https://doi.org/10.1038/s41561-018-0082-z, 2018.
The Cryosphere, 15, 3129–3134, 2021 https://doi.org/10.5194/tc-15-3129-2021You can also read