ON 22 JULY 2016 SYNOPTIC-MESOSCALE ANALYSIS OF THE FLASH-FLOOD-PRODUCING THUNDERSTORM OVER THE VALLÉE DE L'ERNZ
←
→
Page content transcription
If your browser does not render page correctly, please read the page content below
SYNOPTIC-MESOSCALE ANALYSIS OF THE FLASH-FLOOD-
PRODUCING THUNDERSTORM OVER THE VALLÉE DE L’ERNZ
               ON 22 JULY 2016

Date                       12/04/2021

Author                     Luca Mathias

Version                    2.0

Number of pages            16

                       1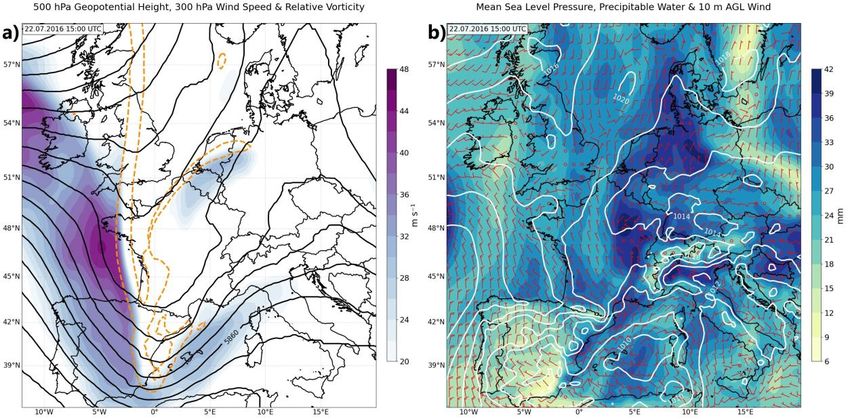
TABLE OF CONTENTS

1. INTRODUCTION .............................................................................................. 3
2. DATA ............................................................................................................. 4
3. OVERVIEW OF THE ATMOSPHERIC CONDITIONS ............................................ 5
4. STORM CELL ANALYSIS ................................................................................... 8
5. PRECIPITATION ANALYSIS............................................................................. 11
6. SUMMARY AND CONCLUSIONS.................................................................... 13
ACKNOWLEDGEMENTS .................................................................................... 13
REFERENCES..................................................................................................... 14

                                                          2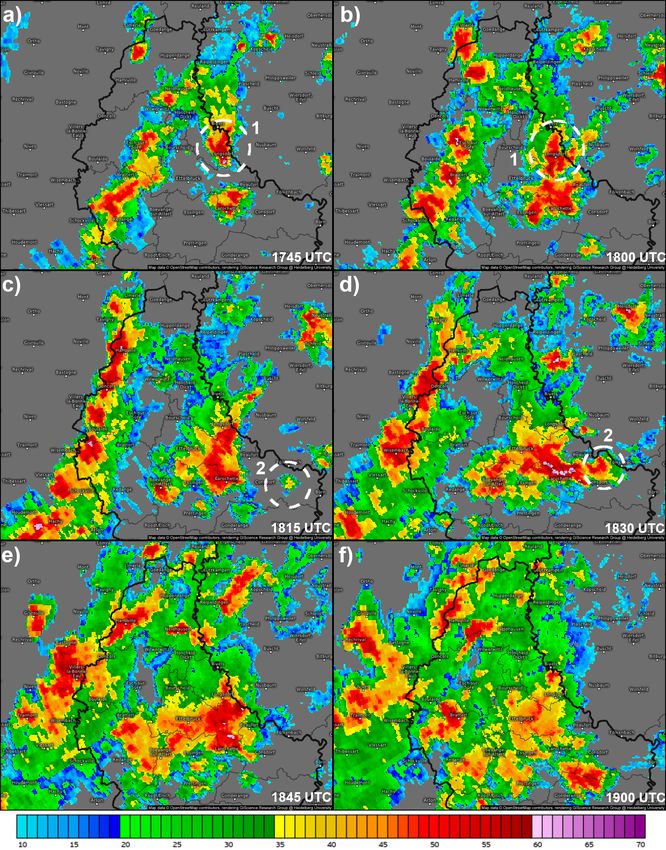
1. INTRODUCTION
On 22 July 2016, the Vallée de l’Ernz in the eastern part of Luxembourg was hit by
torrential convective rainfall that triggered catastrophic flash floods during the
evening hours, accounting for substantial damage in the amount of at least 6 million
Euros. According to eyewitness reports in several media the flash floods in the Vallée
de l’Ernz started at different times along the valley, with an approximate time frame
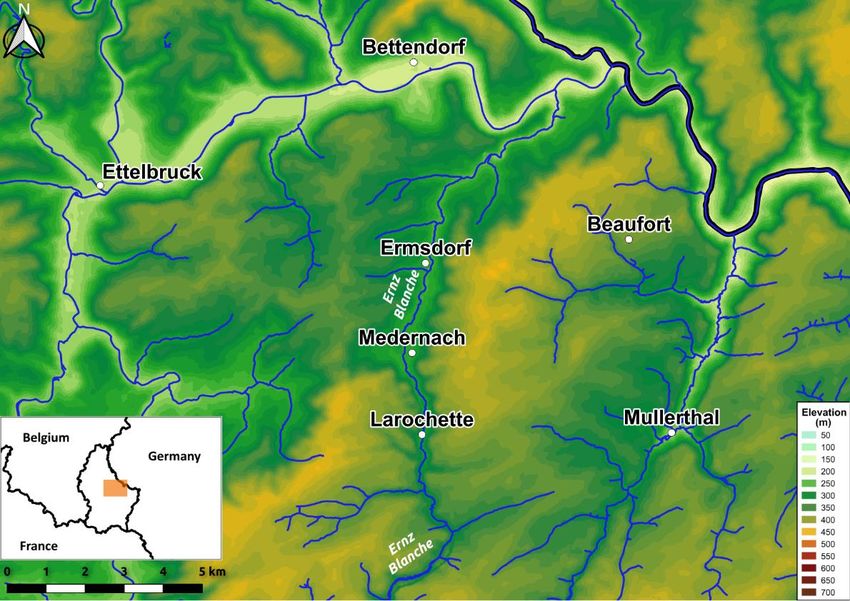
from 18:15 to 19:00 UTC. The orography of the Vallée de l’Ernz and Larochette is
dominated by a north-south orientated river valley with altitudes of 240 to 270 m,
surrounded by a hilly landscape with altitudes up to 420 m and steep slopes, especially
between Medernach and Larochette (Fig. 1). The river White Ernz (fr. Ernz Blanche)
flowing through the towns of Ermsdorf, Medernach and Larochette (Fig. 1) reached a
maximum water level of 175.9 cm in Larochette (Pfister et al. 2018). It was one of the
most severe hydro-meteorological events in the Luxembourgish territory in the last
decades and comparable events took place in regions close to the Vallée de l’Ernz on
1 July 1958 (D’Letzeburger Land 1958, Luxemburger Wort 2018) and on 1 June 2018 in
the Mullerthal region (Mathias 2019). Pfister et al. (2018) estimated that the
precipitation event, which occurred between Larochette and Ermsdorf, has a return of
period of more than 100 years.
The aforementioned characteristics of this event motivate a detailed investigation.
This case study is focused on the meteorological features of this hazardous weather
event, with the following main objectives:
• To identify the atmospheric synoptic-scale and mesoscale conditions that
favoured the development of this extreme rainfall event.
• To examine the development of the flash-flood-producing thunderstorm.
• To provide a spatial and temporal analysis of the precipitation that triggered the
flash floods and landslides.
This article is structured as follows: Section 2 describes the data used in this study and
an overview of the atmospheric conditions will be provided in section 3. An analysis of
the flood-producing storm is given in section 4 and the precipitation observations are
examined and discussed in section 5. The last section includes a short summary and
the conclusions.
3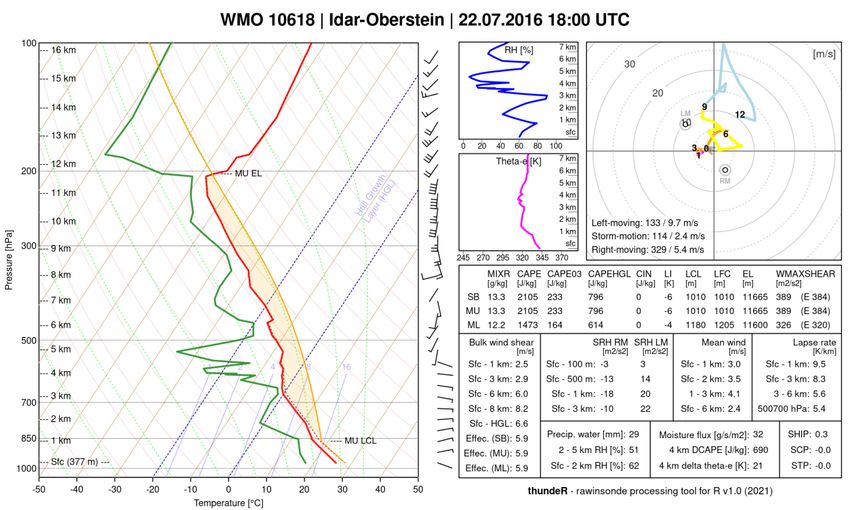
Figure 1. Topographic map of the investigation area (shaded orange in the inset on the lower-left-hand side).

      2. DATA

   ERA5 reanalysis data from the European Centre for Medium-Range Weather
Forecasts (ECMWF) will be used to examine the synoptic-scale conditions. ERA5 was
produced using 4D-Var data assimilation with the model cycle 41r2 of ECMWF’s
Integrated Forecast System (IFS). The hourly reanalysis data output has a native
horizontal grid spacing of 31 km and 137 levels in the vertical (Hersbach et al. 2020).
The storm cell analysis will be based on the low-level precipitation scan of the C-band
radar in Neuheilenbach, which is operated by the German Weather Service (Deutscher
Wetterdienst; DWD). The scan has a horizontal resolution of 250 m in range and a
maximum range of 150 km. The data is visualised by the Kachelmann Group (2021). In
addition to the radar data, lightning data from nowcast (Betz et al. 2009) will be
considered. The in situ measurements of precipitation include data from the surface
weather station network operated by the meteorological department 1 of the
Administration des Services Techniques de l’Agriculture (ASTA). The data has a
temporal resolution of 10 minutes. Moreover, 5-minute data from the radar-based
precipitation climatology project of the DWD (RADKLIM; Winterrath et al. 2017), which
uses the quantitative precipitation estimation method RADar-OnLine-ANeichung
(RADOLAN; Bartels et al. 2004), will be analysed as well. The RADKLIM data has a grid
interval of 1 km.

1
    https://www.agrimeteo.lu/
                                                     4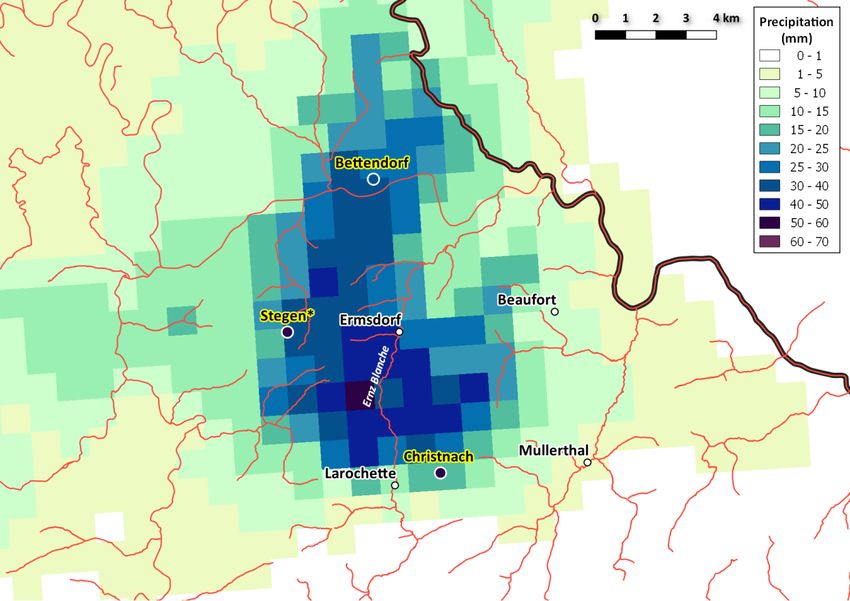
3. OVERVIEW OF THE ATMOSPHERIC CONDITIONS

   On 22 July 2016, a meridional circulation was active in the upper troposphere over
Western Europe. At 15:00 UTC, an upper-level trough was located over England,
western France, and the Iberian Peninsula, exhibiting asymmetric structures and a
vorticity streamer in 300 hPa extending from Iceland to eastern Spain (Fig. 2a). On its
rear side, a jet stream with wind speeds exceeding 40 m s-1 was present over the Bay
of Biscay and Spain (Fig. 2a). The front side of the long-wave trough was more diffuse
with weaker geopotential and temperature gradients. Hence, the southerly upper-
tropospheric flow was weak over eastern France, western Germany, and Benelux.
However, a small and anticyclonically curved jet streak with a local wind maximum of
30 m s-1 was situated over Belgium and southern Netherlands (Fig. 2a). As the flow
curvature in 300 hPa remained anticyclonic due to the persistence of the upper-level
ridge over eastern Germany and in combination with a nearly straight flow in 500 hPa
(Fig. 2a), no significant large-scale forcing for ascent was identifiable over the Greater
Region.
   The examination of the low-level conditions was challenging due to a weak pressure
gradient over Central Europe. Indeed, the 12:00 UTC surface analysis from three
meteorological services (German Weather Service, United Kingdom Meteorological
Office, and Royal Netherlands Meteorological Institute) resulted in three different
interpretations (not shown). Based on ERA5 reanalysis data, an ill-defined and wavy
zone with temperature and moisture gradients extended from France to the North Sea
(Fig. 2b), separating subtropical air masses in the east from heated maritime polar air
masses west of this front-like gradient zone. Moreover, a strong moisture gradient was
evident over north-eastern Germany, and a bow-shaped low-level convergence zone
was situated over northern Germany (Fig. 2b). The surface pressure distribution
revealed a weak low-pressure area with embedded convergence zones over the
Greater Region and southern Germany at 15:00 UTC (Fig. 2b), which remained
amorphous until the evening hours, as the ongoing activity of convective storms
further significantly affected the conditions near the surface.
   Furthermore, high amounts of tropospheric water vapour were observed in the
regime of the subtropical air mass over Central Europe, with precipitable water values
between 27 and 30 mm over Luxembourg (Figs. 2b). Backward trajectory analyses
suggest that the moist air mass was advected from the Bay of Biscay and from the
subtropical North Atlantic with a south-westerly flow between 17 July and 21 July 2016
(Fig. 3).

                                            5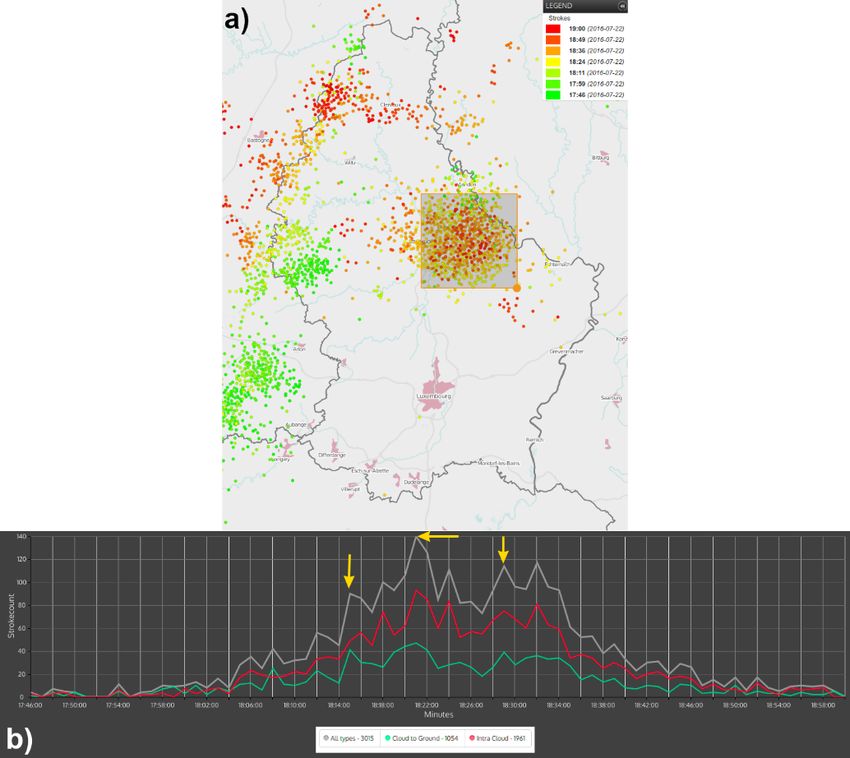
Figure 2. ERA5 reanalysis of the synoptic-scale conditions on 22 July 2016 at 15:00 UTC over Western and Central
Europe. (a) 500 hPa geopotential height (black lines; gpm; line spacing is 20 gpm), 300 hPa wind speed (shaded;
m s-1) and areas of 300hPa relative vorticity exceeding 0.00015 s −1 are denoted by the dashed orange lines. (b)
Mean sea level pressure (white lines; hPa), total precipitable water (shaded; mm) and 10 m above ground level
(AGL) wind (red barbs; kts).

Figure 3. Backward trajectories of air parcels being present at 500 m, 1500 m and 3000 m AGL above
Luxembourg. The trajectories were calculated by NOAA’s HYSPLIT model (Stein et al. 2015) based on NCEP/NCAR
reanalysis data. The trajectory duration is 144 hours (6 days).

                                                       6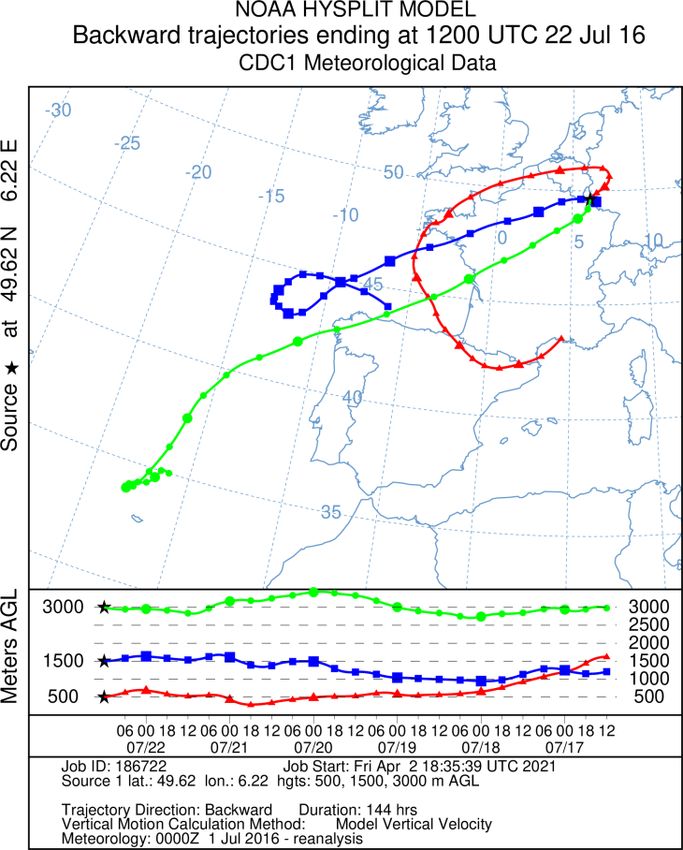
The evening sounding from Idar-Oberstein (about 80 km east of the Vallée de l’Ernz)
on 22 July 2016 is considered representative of the atmospheric conditions prevailing
over Luxembourg due to an easterly flow in the lower troposphere and negligible
contamination by convection at that time. The sounding measurements revealed a
well-mixed boundary layer up to 850 hPa with a mean mixing ratio of 12.2 g kg⁻¹ in the
lowest 500 m and a mean relative humidity of 64 % between the surface and 600 hPa
(Fig. 4). An elevated mixed layer (EML) was present between 810 hPa and 720 hPa,
resulting in lapse rates of 8.3 K km-1 between the surface and 3 km AGL (Fig. 4). The
combination of a moist boundary layer and steep lower-tropospheric lapse rates
resulted in a 500-m mixed-layer (ML) convective available potential energy (CAPE) of
about 1500 J kg⁻¹, of which about 600 J kg-1 were available within the hail-growth-layer
(Fig. 4). The convective inhibition (CIN) was zero, meaning that a near-surface air
parcel being lifted would easily reach the level of free convection. The ascending
trajectory of both the surface-based (SB) parcel and the mixed-layer parcel also
revealed a relatively low lifted condensation level (LCL) at about 1000 m AGL (Fig. 4).

Figure 4. Skew T-log p diagram of a sounding from Idar-Oberstein (WMO 10618) launched at 17:00 UTC on 22
July 2016. The red (green) curve represents the temperature (dew point), and the yellow curve represents the
ascent trajectory of the most unstable air parcel. The most-unstable convective available potential energy (CAPE)
is indicated by the area shaded in transparent yellow. The lifted condensation level (LCL) marks the expected
cloud base of a convective storm. The wind barbs are displayed in knots.

                                                       7
Due to very weak lower- to mid-tropospheric air flow, the vertical wind speed shear
between the surface and 6 km AGL remained around 6 m s⁻¹ (Fig. 4). Moreover, a mean
wind speed of 2.4 m s-1 within the same layer hinted at a strongly reduced motion
speed of storm cells. However, the speed shear was stronger in the upper troposphere
with roughly 20 m s-1 between 6 and 11 km AGL (Fig. 4), ensuring some ventilation of
the upper part of the storm cloud, which could potentially increase the longevity of
the storm’s updraft.
In brief, the environment was highly favourable for the development of
disorganized deep moist convection (DMC). A high boundary layer moisture, steep
lapse rates and weak dynamics characterized the lower troposphere. The forcing to
initiate DMC was provided by sub-synoptic-scale processes (e.g., low-level
convergence zones, outflow boundaries, boundary layer thermals), but also by forced
ascent along the German and Belgian low mountain ranges. This regime of strong
latent instability, high total column water vapour, and weak lower-tropospheric
kinematics generally allows the formation of slow moving and training thunderstorms
which can produce extreme rainfall amounts on the micro-α to meso-γ scale (e.g.,
Doswell et al. 1996, Púčik et al. 2015, Schumacher 2017).
4. STORM CELL ANALYSIS
On 22 July 2016, the first convective cells appeared over far north-western
Luxembourg near the Belgian border at 13:00 UTC, which were initiated by the outflow
boundary from convection over the Ardennes (not shown). These weak cells dissolved
around 14:00 UTC and at the same time new convective cells formed over Trier. One
of these cells moved slightly to the west while strengthening and reached the region
of Mertert and Mompach at 15:00 UTC. This storm cell weakened then rapidly until
15:40 UTC, whereas a new thunderstorm developed to the south over Flaxweiler and
Grevenmacher in eastern Luxembourg. While this storm cell dissolved until 16:15 UTC,
a new convective cell formed between Luxembourg City and Niederanven around
15:55 UTC, which moved slightly to the west and began to weaken at 16:20 UTC. The
weather station at the Airport Luxembourg-Findel (located directly southwest of
Niederanven) reported an hourly precipitation amount of 29.7 mm between 16:00 and
17:00 UTC (of which 14.6 mm fell within 10 minutes), indicating the potential for high
precipitation amounts within a short period of time.
8The parent cell of the flash-flood-producing thunderstorm over the Vallée de l’Ernz
developed near Consdorf around 17:00 UTC and moved slowly in a westerly direction
(Fig. 5a). Furthermore, a multicellular thunderstorm formed directly north of Vianden
west of the German city Bitburg between 16:30 and 17:00 UTC. This storm propagated
slightly to the south, with the strongest precipitation core located over Fouhren and
Longsdorf at 17:30 UTC (feature “1” in Fig. 5a). At the same time, the parent cell rapidly
intensified north of Larochette at 17:30 UTC (cf. Figs. 5a with 5b). This storm further
strengthened while remaining quasi-stationary over the Vallée de l’Ernz and merged
with the storm cell near Longsdorf between 18:00 and 18:15 UTC (cf. Figs. 5a and 5b
with 5c). Hence, a heavy thunderstorm extended from Larochette over Nommern and
Medernach to Longsdorf at 18:20 UTC. Simultaneously, a single cell storm developed
rapidly near Echternach and then moved to the west to merge with the quasi-
stationary thunderstorm over the Vallée de l’Ernz at 18:30 UTC (feature “2” in Figs. 5c
and 5d). These two feeding processes were likely crucial for the long-lasting intense
convective precipitation, since several past studies showed that the merging process
often has an intensification effect on the storm development and thus, can
significantly enhance the precipitation rate (e.g., Bennetts et al. 1982, Westcott 1984,
1994, Fu and Guo 2006, Fu and Guo 2012, Sinkevich and Krauss 2014, Sinkevich et al.
2018). Finally, the rainfall stopped over the valley of the White Ernz at about 19:30
UTC.
Looking in greater detail at the measured radar pixel values over the Vallée de
l’Ernz, local reflectivity maxima of 60 to 63 dBZ were observed over the that area
between 18:25 and 18:45 UTC (Figs. 5d and 5e), whereby reflectivity values of 45 to
55 dBZ were present during an entire hour from 17:50 until 18:50 UTC (Fig. 5). This
flash-flood-producing storm cell also possessed a vertically stacked reflectivity core
with values above 55 dBZ between 18:20 and 18:40 UTC, reaching an altitude of about
8 km (not shown). During that exact period, an impressively high rate of intra-cloud
lightning flashes with more than 50 flashes min-1 was observed (Fig. 6b). More
precisely, three major lightning jumps (i.e., rapid increases in total lightning) were
subjectively identified around 18:15 UTC, 18:21 UTC and 18:29 UTC (Fig. 6b). These
jumps often indicate the occurrence of severe weather at the ground (Schultz et al.
2011, Jurković et al. 2015, Farnell et al. 2017, Wapler 2017) and they are associated
with a growth of the updraft volume and graupel mass in the mixed phase region of
the storm cloud (Deierling and Petersen 2008, Schultz et al. 2017). Indeed, the total
lightning increase between 18:10 and 18:21 UTC coincides well with the period of the
first merging process which took place between Larochette and Longsdorf. Overall, the
thunderstorm over the Vallée de l’Ernz produced about 3000 lightning strokes
between 17:45 and 19:00 UTC (Fig. 6).
9Figure 5. Reflectivity (dBZ) measured at (a) 17:45UTC, (b) 18:00 UTC, (c) 18:15 UTC, (d) 18:30 UTC, (e) 18:45 UTC
and (f) 19:00 UTC with an elevation angle of 0.8° by the meteorological radar located in Neuheilenbach to the
north‐east of the flash-flood-producing storm and operated by the German Weather Service (DWD). The
features “1” and “2” in (a)-(d) are quoted in the text. Images are adapted from: https://kachelmannwetter.com/
lu/regenradar.
10Figure 6. (a) Detected lightning strokes over Luxembourg between 17:45 and 19:00 UTC. (b) Temporal evolution
of cloud-to-ground (green line) and intra-cloud (red line) lightning within the area indicated by the greyish box
in (a). The yellow arrows in (b) denote the subjectively analysed lightning jumps.
5. PRECIPITATION ANALYSIS
As shown in section 4, long-lasting and intense precipitation rates caused the
extreme rainfall amounts over the Vallée de l’Ernz. The RADKLIM precipitation
estimates indicated an hourly accumulation of 30 to 50 mm within a broad area
between Larochette and Bettendorf for the period 17:50 to 18:50 UTC, especially over
the southern part of the White Ernz between Larochette and Ermsdorf, where multiple
pixels exceeded 40 mm with a peak value of 51.1 mm (Fig. 7). However, when
comparing these pixel values with in situ precipitation data, it becomes evident that
RADKLIM underestimated the peak rainfall amounts (Fig. 7). The ASTA weather station
in Christnach reported an hourly precipitation amount of 53.1 mm (30.7 mm between
18:10 and 18:30 UTC), whereas the nearest RADKLIM pixel suggested a value of about
1117 mm. The underestimation is less pronounced for the area near Stegen, where a
private semi-professional weather station even measured 59.6 mm within one hour,
while RADKLIM suggested 34 mm (Fig. 7). Since the measurements in Bettendorf
coincide well with RADKLIM (Fig. 7) and the precipitation in Christnach was measured
at the southern flank of the storm, and thus downstream of the radar beam, strong
beam attenuation may have significantly affected the RADKLIM precipitation
estimation to the south and west of Ermsdorf. Indeed, Kreklow et al. (2019) outlined
that RADKLIM has a negative bias causing an underestimation of extreme precipitation
due to rainfall-induced beam attenuation and spatial averaging. Thus, RADKLIM likely
underestimated the maximum precipitation amounts between Larochette and
Ermsdorf by an approximate factor of 2 (± 0.5). Based on these findings, it can be
reliably estimated that precipitation amounts of 60 to 100 mm accumulated within
one hour over the southern part of the White Ernz valley, which is supported by the
estimations from Pfister et al. (2018).
Figure 7. Accumulated precipitation (shaded; mm) between 17:50 and 18:50 UTC on 22 July 2016 in
the study area, derived by RADOLAN-YW data (Winterrath et al. 2018) and measured by surface
weather stations (towns with yellow text buffer; Bettendorf: 39.6 mm, Christnach: 53.1 mm, Stegen:
59.6 mm).
126. SUMMARY AND CONCLUSIONS
The 22 July Vallée de l’Ernz flash floods were investigated with regard to the
synoptic-scale and mesoscale meteorological context focusing on the atmospheric
ingredients of this event and on the characteristics of the storm as observed with radar
and lightning data.
The large-scale atmospheric conditions were marked by weak pressure gradients.
Strong latent instability and sub-synoptic-scale lifting mechanisms were sufficient to
initiate thunderstorms over the Grand Duchy of Luxembourg on 22 July 2016.
Furthermore, the radar analysis executed in this paper suggests that the merging of
convective cells was most likely a crucial dynamical and microphysical process for the
enhanced precipitation generation over the Vallée de l’Ernz, together with the
presence of high total column atmospheric water vapour, weak lower- to mid-
tropospheric kinematics and moderate upper-level shear. However, further research
is needed to find out which atmospheric conditions favour the merging of convective
cells and subsequent storm intensification, which could potentially cause major
flooding. This severe weather event also highlights the importance of near-real time
radar and lightning data with a high temporal and spatial resolution for operational
nowcasting purposes.
The comparison of radar-based and in situ precipitation data revealed a striking
underestimation by RADKLIM over the southern part of the Vallée de l’Ernz, where
maximum rainfall amounts of 60 to 100 mm likely occurred between 17:50 and 18:50
UTC. The hydrological ingredients (e.g., soil moisture, land use, infiltration rate,
surface runoff) have not been dealt with in this study, but they have been partially
discussed by Pfister et al. (2018).
ACKNOWLEDGEMENTS
ECMWF’s ERA5 reanalysis data is made available by the Copernicus Climate Change
Service (https://cds.climate.copernicus.eu/). RADKLIM/RADOLAN data is accessible
through DWD’s open data portal (https://opendata.dwd.de/climate_environ-
ment/CDC/grids_germany/ ). The author thanks ASTA for providing archived weather
station data (https://www.agrimeteo.lu/Agrarmeteorologie/Archiv/Orginalwerte).
The author thanks the Kachelmann Group for archiving and visualizing operational ra-
dar data and making it freely available on its website (https://kachelmannwet-
ter.com).
13REFERENCES
Bartels, H., Weigl, E., Reich, T., Lang, P., Wagner, A., Kohler, O., and Gerlach, N. (2004):
Projekt RADOLAN, Routineverfahren zur Online-Aneichung der Radar-niederschlags-
daten mit Hilfe von automatischen Bodenniederschlagsstationen (Ombrometer).
DWD, Offenbach, Germany, 111 pp. [Available online: https://www.dwd.de/DE/leis-
tungen/radolan/radolan_info/abschlussbericht_pdf.pdf?__blob=publication-
File&v=2]
Bennetts, D. A., Bader, M. J., and Marles, R. H. (1982). Convective cloud merging and
its effect on rainfall. Nature, 300, 42-45. DOI: https://doi.org/10.1038/300042a0
Betz, H.-D., Schmidt, K., Laroche, P., Blanchet, P., Oettinger, P., Defer, E., Dziewit, Z.,
and Konarski, J. (2009). LINET - an international lightning detection network in Europe.
Atmospheric Research, 91, 564-573. DOI: https://doi.org/10.1016/j.at-
mosres.2008.06.012
Deierling, W., and Petersen, W. A. (2008). Total lightning activity as an indicator of
updraft characteristics. Journal of Geophysical Research, 113, D16210. DOI:
https://doi.org/10.1029/2007JD009598
Doswell, C. A. III, Brooks, H. E., and Maddox, R. A. (1996). Flash flood forecasting: An
ingredients-based methodology. Weather and Forecasting, 11, 560-581. DOI:
https://doi.org/10.1175/1520-0434(1996)0112.0.CO;2
D’Letzeburger Land (1958). Ein Wolkenbruch seltenen Ausmaßes. [Available online:
http://www.eluxemburgensia.lu/BnlViewer/view/index.html?lang=fr#pa-
nel:pp|issue:1710926|article:DTL142|query:wolken-bruch]
Farnell, C., Rigo, T., and Pineda, N. (2017). Lightning jump as a nowcast predictor: ap-
plication to severe weather events in Catalonia. Atmospheric Research, 183, 130-141.
DOI: http://dx.doi.org/10.1016/j.atmosres.2016.08.021
Fu, D., and X. Guo, (2006). A cloud-resolving study on the role of cumulus merger in
MCS with heavy precipitation. Advances in Atmospheric Sciences, 23, 857-868. DOI:
https://doi.org/10.1007/s00376-006-0857-9
Fu, D., and Guo, X. (2012). A Cloud-Resolving Simulation Study on the Merging Pro-
cesses and Effects of Topography and Environmental Winds. Journal of Atmospheric
Sciences, 69, 1232-1249. DOI: https://doi.org/10.1175/JAS-D-11-049.1
14Hersbach, H., et al. (2020). The ERA5 global reanalysis. Quarterly Journal of the Royal
Meteorological Society, 146, 1999-2049. DOI: https://doi.org/10.1002/qj.3803
Jurković, P., Mahović, N., and Počakal, D. (2015). Lightning, overshooting top and hail
characteristics for strong convective storms in Central Europe. Atmospheric Research,
161–162, 153-168. DOI: https://doi.org/10.1016/j.atmosres.2015.03.020
Kreklow, J., Tetzlaff. B., Kuhnt, G., and Burkhard, B. (2019). A Rainfall Data Intercom-
parison Dataset of RADKLIM, RADOLAN, and Rain Gauge Data for Germany. Data, 4,
118. DOI: https://doi.org/10.3390/data4030118
Luxemburger Wort (2018). Sturzflut 1958: Ein grausiges Schauspiel. [Available online:
https://www.wort.lu/de/lokales/sturzflut-1958-ein-grausiges-schauspiel-
5b36531b182b657ad3b8f3dc]
Mathias, L. (2019). Major flood event in the Mullerthal region on 1 June 2018: event
analysis and predictability. Administration de la Navigation Aérienne, MeteoLux, 17
pp. [Available online: https://www.meteolux.lu/fr/produits-et-services/publications/]
Pfister, L., Faber, O., Hostache, R., Iffly, J. F., Matgen, P., Minette, F., Trebs, I., Bastian,
C., Göhlhausen, D., Meisch, C., and Patz, N. (2018). Crue éclair du 22 juillet 2016 dans
la région de Larochette. Luxembourg Institute of Technology, Esch-sur-Alzette, Luxem-
bourg, 16 pp. [Available online: https://eau.gouvernement.lu/fr/services-aux-
citoyens/publications/2021/brochures/Crue-eclair-du-22-juillet-2016.html]
Púčik, T., Groenemeijer, P., Rýva, D., and Kolář (2015). Proximity soundings of severe
and non-severe thunderstorms in central Europe. Monthly Weather Review, 143,
4805-4821. DOI: https://doi.org/10.1175/MWR-D-15-0104.1
Schultz, C. J., Petersen, W. A., and Carey, L. D. (2011). Lightning and severe weather: A
comparison between total and cloud-to-ground lightning trends. Weather and Fore-
casting, 26, 744-755. DOI: https://doi.org/10.1175/WAF-D-10-05026.1
Schultz, C. J., Carey, L. D., Schultz, E. V., and Blakeslee, R. J. (2017). Kinematic and mi-
crophysical significance of lightning jumps versus non jump increases in total flash
rate. Weather and Forecasting, 32, 275-288. DOI: http://dx.doi.org/10.1175/WAF-D-
15-0175.1
Schumacher, R. S. (2017). Heavy rainfall and flash flooding. Oxford Research Encyclo-
pedia of Natural Hazard Science. Oxford University Press, USA. DOI:
https://dx.doi.org/10.1093/acrefore/9780199389407.013.132
15Sinkevich, A. A., and Krauss, T. W. (2014). Changes in Thunderstorm Characteristics
due to Feeder Cloud Merging. Atmospheric Research, 142, 124-132. DOI:
https://doi.org/10.1016/j.atmosres.2013.06.007
Sinkevich, A. A., Popov, V. B., Tarabukin, I. A., Dorofeev, E. V., Dovgalyuk, Y. A., Vere-
mei, N. E., Mikhailovskii, Y. P., Snegurov, V. S., and Snegurov, A. V. (2018). Changes in
Cu Characteristics and Precipitation during Cu Merging. Russian Meteorology and Hy-
drology, 43, 506-515. DOI: https://doi.org/10.3103/S1068373918080022
Stein, A. F., Draxler, R. R., Rolph, G. D., Stunder, B. J. B., Cohen, M. D., and Ngan, F.
(2015). NOAA’s HYSPLIT Atmospheric Transport and Dispersion Modeling System. Bul-
letin of the American Meteorological Society, 96, 2059-2077. DOI:
https://doi.org/10.1175/BAMS-D-14-00110.1
Wapler, K. (2017). The life-cycle of hailstorms: Lightning, radar reflectivity and rotation
characteristics. Atmospheric Research, 193, 60-72. DOI: https://doi.org/10.1016/j.at-
mosres.2017.04.009
Westcott, N.E. (1984). A historical perspective on cloud mergers. Bulletin of the Amer-
ican Meteorological Society, 65, 219-227. DOI: https://doi.org/10.1175/1520-
0477(1984)065%3C0219:AHPOCM%3E2.0.CO;2
Westcott, N.E. (1994). Merging of convective clouds: cloud initiation, bridging, and
subsequent growth. Monthly Weather Review, 122, 780-790. DOI:
https://doi.org/10.1175/1520-0493(1994)122%3C0780:MOCCCI%3E2.0.CO;2
Winterrath, T., Brendel, C., Hafer, M., Junghänel, T., Klameth, A., Walawender, E.,
Weigl, E., and Becker, A. (2017). Erstellung einer radargestützten Niederschlagsklima-
tologie, Abschlussbericht, Berichte des Deutschen Wetterdienstes, Nr. 251. [Available
online: https://www.dwd.de/DE/leistungen/pbfb_verlag_berichte/pdf_einzelba-
ende/251_pdf.pdf?__blob=publicationFile&v=2]
Winterrath, T., Brendel, C., Hafer, M., Junghänel, T., Klameth, A., Lengfeld, K., Wala-
wender, E., Weigl, E., and Becker, A. (2018). RADKLIM Version 2017.002: Reprozes-
sierte, mit Stationsdaten angeeichte Radarmessungen (RADOLAN), 5-Minuten-Nieder-
schlagsraten (YW). DOI: 10.5676/DWD/RADKLIM_YW_V2017.002
16You can also read