Recent increase in black carbon concentrations from a Mt. Everest ice core spanning 1860-2000 AD
←
→
Page content transcription
If your browser does not render page correctly, please read the page content below
GEOPHYSICAL RESEARCH LETTERS, VOL. 38, L04703, doi:10.1029/2010GL046096, 2011

Recent increase in black carbon concentrations from a Mt. Everest
ice core spanning 1860–2000 AD
S. D. Kaspari,1,2 M. Schwikowski,2 M. Gysel,3 M. G. Flanner,4 S. Kang,5,6 S. Hou,6,7
and P. A. Mayewski8
Received 8 November 2010; revised 29 December 2010; accepted 10 January 2011; published 18 February 2011.

[1] A Mt. Everest ice core spanning 1860–2000 AD and                     deposited on snow and ice can significantly reduce the surface
analyzed at high resolution for black carbon (BC) using a                albedo, hasten melt, and trigger albedo feedback [Flanner
Single Particle Soot Photometer (SP2) demonstrates strong                et al., 2009; Hansen and Nazarenko, 2004; Ramanathan
seasonality, with peak concentrations during the winter‐                 and Carmichael, 2008]. BC is estimated to have 55% of the
spring, and low concentrations during the summer monsoon                 radiative forcing effect of CO2 [Ramanathan and Carmichael,
season. BC concentrations from 1975–2000 relative to                     2008], yet BC remains one of the largest sources of uncertainty
1860–1975 have increased approximately threefold, indicat-               in analyses of climate change.
ing that BC from anthropogenic sources is being transported                [3] Records of BC mass concentration and spatial and
to high elevation regions of the Himalaya. The timing of the             temporal distribution in the atmosphere are needed to deter-
increase in BC is consistent with BC emission inventory                  mine the role of BC in climate change. BC has a mean
data from South Asia and the Middle East, however since                  atmospheric residence time of several days, thus the global
1990 the ice core BC record does not indicate continually                distribution is inhomogeneous and strongly correlated to
increasing BC concentrations. The Everest BC and dust                    sources. As a result, BC measurements are needed from many
records provide information about absorbing impurities that              locations. Modern measurements of BC have been made on
can contribute to glacier melt by reducing the albedo of snow            aerosol and precipitation samples, however historical records
and ice. There is no increasing trend in dust concentrations             of BC are scarce. Thus, studies assessing the role of BC in
since 1860, and estimated surface radiative forcing due to               climate change have relied on inventories of carbonaceous
BC in snow exceeds that of dust in snow. This suggests that              particle emissions based on wood and/or fossil fuel con-
a reduction in BC emissions may be an effective means to                 sumption data [Bond et al., 2007; Novakov et al., 2003].
reduce the effect of absorbing impurities on snow albedo and             However, many important BC sources such as residential
melt, which affects Himalayan glaciers and the availability              emissions from cooking and heating are very difficult to
of water resources in major Asian rivers. Citation: Kaspari,             estimate in the present, even more difficult to estimate for the
S. D., M. Schwikowski, M. Gysel, M. G. Flanner, S. Kang, S. Hou,         past, and can vary greatly through time and with location.
and P. A. Mayewski (2011), Recent increase in black carbon con-          Thus, more quantitative measurements of BC emissions and
centrations from a Mt. Everest ice core spanning 1860–2000 AD,           atmospheric concentrations as a function of time are needed
Geophys. Res. Lett., 38, L04703, doi:10.1029/2010GL046096.               to estimate climate change related to BC forcing [Hansen and
                                                                         Nazarenko, 2004; Novakov et al., 2003]. Ice cores from ice
1. Introduction                                                          sheets and mountain glaciers provide a means to reconstruct
                                                                         historical BC concentrations.
  [2] Black carbon (BC, the absorbing component of soot)                   [4] Reconstructing BC concentrations in the Himalayas is
produced by the incomplete combustion of biomass, coal and               particularly important because this region is influenced by
diesel fuels can significantly contribute to climate change by           some of the largest BC sources globally [Bond et al., 2007],
altering the Earth’s radiative balance. BC in the atmosphere             with negative impacts on climate, water resources, agriculture
absorbs light and causes atmospheric heating, whereas BC                 and human health [Auffhammer et al., 2006; Chameides et al.,
                                                                         1999; Menon et al., 2002; Ramanathan and Carmichael,
    1
     Department of Geological Sciences, Central Washington University,   2008]. Furthermore, it is estimated that the largest climate
Ellensburg, Washington, USA.                                             forcing from BC in snow occurs over the Himalayas and
    2
     Laboratory for Radiochemistry and Environmental Chemistry,          Tibetan Plateau [Flanner et al., 2007, 2009; Ramanathan and
Paul Scherrer Institut, Villigen PSI, Switzerland.                       Carmichael, 2008], and modeling studies suggest that BC is
    3
      Laboratory of Atmospheric Chemistry, Paul Scherrer Institut,
Villigen PSI, Switzerland.
                                                                         contributing to glacier retreat via atmospheric heating and
    4
     Department of Atmospheric, Oceanic and Space Sciences, University   BC deposition on glacier surfaces [Lau et al., 2010; Qian
of Michigan, Ann Arbor, Michigan, USA.                                   et al., 2010]. Herein we present a high‐resolution BC record
    5
     Key Laboratory of Tibetan Environmental Changes and Land            from a Mt. Everest ice core spanning 1860–2000 AD. This
Surface Processes, Institute of Tibetan Plateau Research, Chinese        provides the first pre‐industrial to present record of BC
Academy of Sciences, Beijing, China.
    6
      State Key Laboratory of Cryospheric Sciences, Chinese Academy      concentrations from the Himalayas.
of Sciences, Lanzhou, China.
    7
      School of Geographic and Oceanographic Sciences, Nanjing           2. Site Description and Methods
University, Nanjing, China.
    8
     Climate Change Institute, University of Maine, Orono, Maine, USA.     [5] In 2002 a 108 m ice core was collected from the col of
                                                                         the East Rongbuk glacier located on the northeast ridge of
Copyright 2011 by the American Geophysical Union.                        Mt. Everest (28.03 N, 86.96 E, 6518 m) on the north slope
0094‐8276/11/2010GL046096

                                                                  L04703                                                          1 of 6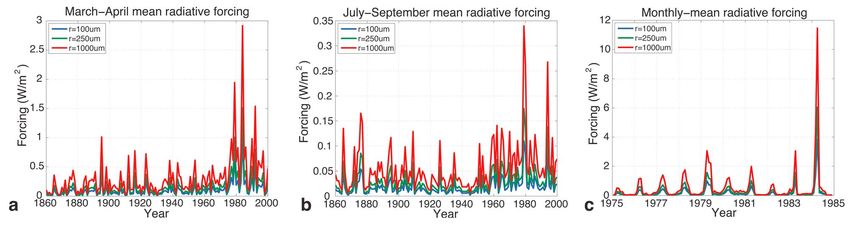
L04703                          KASPARI ET AL.: MT. EVEREST ICE CORE BLACK CARBON                                            L04703

of the Himalaya. The ice core was analyzed for BC using a          pre‐industrial to industrial times (Figure 1b) (herein reported
Single Particle Soot Photometer (SP2, Droplet Measurement          BC concentrations and radiative forcing estimates represent
Technologies), a BC analytical technique first applied to ice      lower limit values due to potential particle losses in the
cores by [McConnell et al., 2007]. The SP2 uses laser‐             nebulizer). The increase is most apparent in peak BC con-
induced incandescence to measure the BC mass in individual         centrations (maximum BC = 32 mg/L in 1984), however
particles quantitatively and independent of particle morphol-      background concentrations also rise from ∼0.05 mg/L prior
ogy and coatings with light scattering material [Schwarz et al.,   to 1960 to ∼0.10 mg/L post 1960. Higher BC concentrations
2006; Slowik et al., 2007; Stephens et al., 2003]. Specifically,   in recent decades indicate that BC from anthropogenic
the SP2 detects only the mass concentration of refractory          sources is being transported to high elevation regions of the
black carbon (sometimes referred to as rBC; the term BC is         Himalaya.
used here for simplicity), while other absorbing aerosol             [9] The increase in Everest BC during the 1970s is simul-
components such as brownish carbon or mineral dust are not         taneous with a rise in BC emissions as estimated from his-
detected by the SP2. The high sensitivity and small required       torical records of energy‐related combustion in South Asia
sample volume enables ice cores to be analyzed at much             and the Middle East [Bond et al., 2007] (Figure 1b). Based
higher resolution than thermal‐optical methods. Additional         on dominant atmospheric circulation patterns and previous
information about the ice core processing, chemical analyses,      back‐trajectory research [Kaspari et al., 2009], these regions
dating, SP2 calibration and BC mass size distribution are          are likely sources of BC that is deposited at Mt. Everest. BC
discussed in the auxiliary material.1                              emissions in South Asia are substantially higher than the
                                                                   Middle East, particularly in recent decades, and northern
3. Results and Discussion                                          regions of India may be a dominant source of BC transported to
                                                                   Everest via the westerlies. However, BC emissions from South
  [6] The high‐resolution BC data demonstrates strong sea-         Asia continue to increase throughout the record, whereas BC in
sonality, with peak concentrations during the winter‐spring        the Everest record does not increase post ∼1990. The Everest
when atmospheric circulation is dominated by the westerlies,       BC record likely represents trends in BC emissions from both
and low concentrations during the summer monsoon season,           regional and long‐range sources, potentially including the
when southerly winds are dominant at the surface. The BC           Former USSR and Eastern Europe, where BC emissions have
seasonality is illustrated by comparing the BC record with: 1)     decreased in recent decades (Figure 1b). Western Europe and
dust source elements (e.g., Fe) that peak during the winter        China are likely not important sources of BC transported to
and spring due to unstable atmospheric conditions and strong       the Everest ice core site, as Western European sources peaked
winds [Kaspari et al., 2009], and 2) the more negative             in 1960 and have since decreased, and BC emissions from
hydrogen stable isotope ratio (dD) due to strong monsoon           China are downwind from the Himalaya. In addition to
activity during the summer [Tian et al., 2003] (Figure 1). The     changes in BC emissions, deposited BC is also controlled by
ice core BC seasonality is consistent with previous findings,      variations in the strength and pathways of winds that transport
including: soot particles measured in snow pits at the same        the BC from source regions to high elevations. Due to the
site [Cong et al., 2009]; atmospheric measurements in the          extreme topography in this region, the mountain meteorology
Khumbu Valley, Nepal (5079 m asl) [Marinoni et al., 2010];         is complex and it is difficult to constrain inter‐annual vari-
and other atmospheric measurements in the region [Adhikary         ability in vertical transport processes that allow BC from
et al., 2007; Ram et al., 2008; Ramanathan et al., 2007; Stone     relatively low elevation source regions to be transported to the
et al., 2010].                                                     high elevation ice core drill site.
  [7] Factors controlling BC seasonality include variations          [10] BC deposited at Everest likely has both fossil and bio‐
in emissions, atmospheric transport, and precipitation. For        fuel sources. BC fossil fuel sources include coal, petrol and
example, in the Kathmandu valley brick kilns that utilize coal     diesel used in power generation, transportation, domestic uses
and other biofuels only operate in the dry months between          and steel and cement manufacturing, whereas major BC bio‐
December and April, and biomass burning emissions from             fuel sources include cattle manure, fuel wood, agricultural
regions in South Asia peak during spring [Adhikary et al.,         residue burning and forest fires [Reddy and Venkataraman,
2007; Streets et al., 2003; Venkataraman et al., 2006]. The        2002a, 2002b]. Previous attempts to apportion BC to bio-
winter‐spring in this region of the Himalayas is particularly      mass and fossil fuel sources have produced varying results
dry, thus the lifetime of BC and other aerosols in the atmo-       depending on the approach used (e.g., ratios of BC to total
sphere can be prolonged. Conversely, the majority of precip-       carbon; emission inventories based on fuel consumption),
itation occurs during the summer monsoon season, resulting         with recent radiocarbon measurements from India indicating
in the wet removal of BC and other aerosols from the atmo-         that one half to two thirds of BC emissions result from bio-
sphere. As a result, summer precipitation in this region typi-     mass combustion [Gustafsson et al., 2009].
cally has low BC concentrations.                                     [11] In addition to providing a record of historical BC
  [8] To investigate changes in BC since 1860, the high‐           concentrations in the atmosphere, the Everest BC and dust
resolution data were re‐sampled to 4 samples/year to correct       records supply information about absorbing impurities that
for differences in sampling resolution with depth in the ice       can contribute to glacier melt by reducing the albedo of snow
core. Average BC concentrations from 1860–1975 and 1975–           and ice. Notably, the Everest Fe record, used as a proxy for
2000 were 0.2 ± 0.3 mg/L and .7 ± 1.0 mg/L, respectively,          dust [Kaspari et al., 2009] (Figure 1b), and dust number and
indicating a threefold increase in BC concentrations from          mass records [Xu et al., 2010] do not show an increasing trend
                                                                   since 1860. This is significant because it suggests that if the
   1
     Auxiliary materials are available in the HTML. doi:10.1029/   recent retreat of glaciers in the region is due, at least in part,
2010GL046096.                                                      to the effect of impurities on snow albedo, the reduced

                                                              2 of 6
L04703 KASPARI ET AL.: MT. EVEREST ICE CORE BLACK CARBON L04703
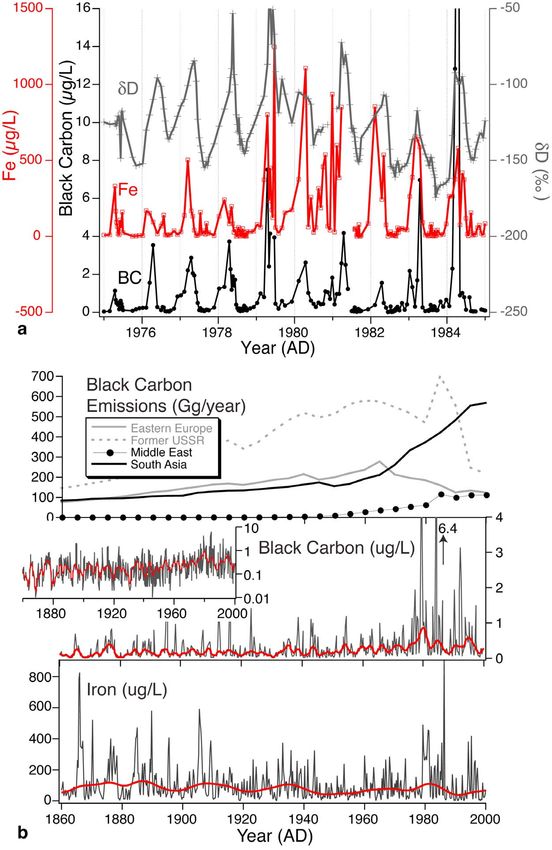
Figure 1. (a) High‐resolution BC, Iron (Fe) and dD from the Everest ice core spanning 1975–1985 AD. (b) BC emission data
[Bond et al., 2007]; Everest ice core BC (including inset with logarithmic scale to show changes in background concentra-
tions), and iron (used as a proxy for dust) [Kaspari et al., 2009]. The Everest ice core data are re‐sampled to 4 samples/year
(black) due to differences in sampling resolution over time, and smoothed with a robust spline (red).
albedo is more likely due to increased BC deposition rather components and thus use a mass absorption cross section of
than dust. 11.3 m2/g [Flanner et al., 2007]. Average (466 ppb) and peak
[12] BC is estimated to be fifty times more effective than (3388 ppb) dust mass concentrations and size distribution are
dust at reducing the visible snow albedo [Warren, 1984], from measurements made on the same ice core [Xu et al.,
although dust absorptivity is highly variable. Due to the 2010] and dust optical properties are derived from [Clarke
prevalence of dust in this region, the relative importance of et al., 2004]. Surface RF measurements were calculated
BC versus dust in reducing snow albedo has not been clear. A with varying snow effective radii, with 250 mm representing a
recent modeling study estimated that the Eurasian spring central estimate, and 100 and 1000 mm bracketing the plau-
radiative forcing (RF) from dust and BC in snow is 1.2 and sible range associated with variable snow grain size (Table 1).
2.7 W/m2, respectively [Flanner et al., 2009]. We used the [13] The average spring (March–April) BC RF in the pres-
Snow, Ice, and Aerosol Radiative (SNICAR) model [Flanner ence of average dust concentrations increased from 0.11250mm
et al., 2007] to estimate the RF from BC and dust in snow. We (0.07100mm; 0.221000mm) W/m2 from 1860–1974 to 0.36250mm
assume that BC is internally mixed with scattering aerosol (0.22100mm; 0.691000mm) W/m2 from 1975–2000, indicating
3 of 6L04703 KASPARI ET AL.: MT. EVEREST ICE CORE BLACK CARBON L04703
Table 1. BC and Surface Radiative Forcing Average From 1860 to 1974 and 1975 to 2000, Increase Factor From 1975 to 2000/1860 to
1974, and Maximum Values From the Mt. Everest Ice Corea
1975–2000/1860–1974
1860–1974b 1975–2000b Increase Factor Maximumc
Black Carbon (mg/L) 0.23 0.69 3 32.42
Mar–Apr Surface Radiative Forcing (W/m2)
r = 250 mm, no dust 0.11 0.36 3.15 6.12
r = 100 mm, dust = 466 ppb 0.07 0.22 3.17 3.85
r = 250 mm, dust = 466 ppb 0.11 0.35 3.16 6.05
r = 1000 mm, dust = 466 ppb 0.22 0.69 3.15 11.46
r = 100 mm, dust = 3388 ppb 0.06 0.20 3.20 ‐
r = 250 mm, dust = 3388 ppb 0.10 0.31 3.20 5.69
r = 1000 mm, dust = 3388 ppb 0.19 0.60 3.19 ‐
r = 250 mm, no BC, dust = 466 ppb (constant) 0.11 0.11 constant 0.15
r = 250 mm, no BC, dust = 3388 ppb (constant) 0.77 0.77 constant 1.01
Jul–Sep Surface Radiative Forcing (W/m2)
r = 100 mm 0.02 0.03 1.95 ‐
r = 250 mm 0.02 0.05 1.95 ‐
r = 1000 mm 0.05 0.09 1.95 ‐
a
Surface radiative forcing (based on SNICAR [Flanner et al., 2007]) is due to BC in snow in the presence of dust, unless specifically noted as no BC, in
which case the radiative forcing is due to dust in snow. Here r is snow effective radius; dust is dust mass concentration [Xu et al., 2010].
b
Average based on 4 samples/year data.
c
Based on high resolution data.
a threefold increase in RF from BC in snow (Table 1 and concentrations (3388 ppb) is less than that with average dust
Figure 2a). Despite higher incoming solar radiation during concentrations because the dust captures some of the solar
the summer, the BC RF in snow is considerably lower during absorption that the BC would receive under less dusty con-
the summer monsoon season (July–September) due to much ditions (Table 1). Omission of dust results in the highest
lower BC concentrations during this time (Figure 2b). Nev- BC RF. Conversely, the dust RF in the absence of BC is
ertheless, average summer monsoon RF from 1975–2000 is highly dependent on dust concentrations, with a spring dust
twofold higher than 1860–1974. As mentioned previously, RF of .11 and .77 W/m2 for average and peak dust con-
the 1860–2000 timeseries is re‐sampled to 4 samples/year. centrations, respectively. This peak dust RF is still consid-
This results in a smoothing of the record, precluding exami- erably less than peak BC RF from the high‐resolution record,
nation of RF from peak impurity concentrations. Thus, the supporting the conclusions from previous studies suggesting
high‐resolution record from 1975–1985, representing the time that a reduction in BC emissions would be the most effective
period with peak impurity concentrations, was re‐sampled at means by which to reduce the impact of absorbing impurities
monthly resolution (12 samples/year) to further examine BC on albedo and snow melt [Hansen and Nazarenko, 2004].
RF peak values and seasonality. Monthly mean RF is highly Full snowpack/glacier modeling would be needed to assess
seasonal, with a peak BC RF of 6.05250mm (3.85100mm, impacts on snowmelt of specific BC reductions. Additionally,
11.461000mm) W/m2 occurring during the spring (Figure 2c). our current analyses do not address other absorbing impurities
[14] The previous analyses consider the BC RF in the in the snowpack that also can contribute to reductions in
presence of average dust levels. Because we are interested albedo such as additional sources of light absorbing carbon
in the relative contributions of BC and dust to the RF and (colored organics) from biomass burning, humic‐like sub-
reductions in snow albedo, we also ran SNICAR for r = stances, snow algae and bacteria [Andreae and Gelencser,
250 mm with BC and varying dust concentrations, and without 2006; Takeuchi, 2002].
BC. The average spring BC RF in the presence of peak dust
Figure 2. BC radiative forcing (W/m2) in the presence of average dust mass concentration (466 ppb) as determined using
SNICAR [Flanner et al., 2007] for snow effective radii (r) = 150 (blue); 250 (green) and 1000 mm from (a) March–April
(b) July–September, and (c) monthly mean. Additional model parameters are discussed in the text.
4 of 6L04703 KASPARI ET AL.: MT. EVEREST ICE CORE BLACK CARBON L04703
[15] Spatial heterogeneity in BC concentrations due to dif- McConnell, J., R. L. Edwards, G. L. Kok, M. G. Flanner, C. S. Zender,
ferences in BC sources and transport is evident when com- E. S. Saltzman, J. R. Banta, D. R. Pasteris, M. M. Carter, and J. D. W.
paring the results of this study with BC ice core records from Kahl (2007), 20th‐century industrial black carbon emissions altered Arctic
climate forcing, Science, 317, 1381–1384, doi:10.1126/science.1144856.
other regions of the Himalaya and Tibetan Plateau spanning Menon, S., J. Hansen, L. Nazarenko, and Y. Luo (2002), Climate effects of
∼1950 to recent time: cores from the Tibetan Plateau have black carbon aerosols in China and India, Science, 297, 2250–2253,
relatively high BC concentrations during the 1950s–1960s, doi:10.1126/science.1075159.
Ming, J., H. Cachier, C. Xiao, D. Qin, S. Kang, S. Hou, and J. Xu (2008),
whereas peak BC concentrations in a core from Zuoqiupu in Black carbon record based on a shallow Himalayan ice core and its
the Eastern Himalaya occurred post 1990 [Liu et al., 2008; climatic implications, Atmos. Chem. Phys., 8, 1343–1352, doi:10.5194/
Ming et al., 2008; Xu et al., 2009]. The BC spatial variations, acp-8-1343-2008.
Novakov, T., V. Ramanathan, J. E. Hansen, T. W. Kirchstetter, M. Sato,
combined with differences in the amount and seasonality of J. E. Sinton, and J. A. Sathaye (2003), Large historical changes of fossil‐
precipitation and dust deposition, results in a heterogeneous fuel black carbon aerosols, Geophys. Res. Lett., 30(6), 1324, doi:10.1029/
pattern of snow and glacier melt across the region. 2002GL016345.
Qian, Y., M. G. Flanner, L. R. Leung, and W. Wang (2010), Sensitivity
studies on the impacts of Tibetan Plateau snowpack pollution on the
Asian hydrological cycle and monsoon climate, Atmos. Chem. Phys.
[16] Acknowledgments. This research was funded by NSF‐OISE‐ Discuss., 10, 22,855–22,903, doi:10.5194/acpd-10-22855-2010.
0653933, NSF‐ATM‐0139491, NSF‐ATM‐0852775, NSF‐ANT‐ Ram, K., M. M. Sarin, and P. Hedge (2008), Atmospheric abundances
0837883, National Natural Science Foundation of China (40830743; of primary and secondary carbonaceous species at two high‐altitude
40825017) and the Swiss National Science Foundation. sites in India: Sources and temporal variability, Atmos. Environ., 42,
6785–6796, doi:10.1016/j.atmosenv.2008.05.031.
Ramanathan, V., and G. R. Carmichael (2008), Global and regional climate
References changes due to black carbon, Nat. Geosci., 1, 221–227, doi:10.1038/
Adhikary, B., G. R. Carmichael, Y. Tang, L. R. Leung, Y. Qian, J. J. ngeo156.
Schauer, E. A. Stone, V. Ramanathan, and M. V. Ramana (2007), Char- Ramanathan, V., et al. (2007), Atmospheric brown clouds: Hemispherical
acterization of the seasonal cycle of south Asian aerosols: A regional‐ and regional variations in long‐range transport, absorption, and radiative
scale modeling analysis, J. Geophys. Res., 112, D22S22, doi:10.1029/ forcing, J. Geophys. Res., 112, D22S21, doi:10.1029/2006JD008124.
2006JD008143. Reddy, M. S., and C. Venkataraman (2002a), Inventory of aerosol and
Andreae, M. O., and A. Gelencser (2006), Black carbon or brown carbon? sulphur dioxide emissions from India. Part II‐Biomass combustion,
The nature of light‐absorbing carbonaceous aerosols, Atmos. Chem. Atmos. Environ., 36, 699–712, doi:10.1016/S1352-2310(01)00464-2.
Phys., 6, 3131–3148, doi:10.5194/acp-6-3131-2006. Reddy, M. S., and C. Venkataraman (2002b), Inventory of aerosol and
Auffhammer, M., V. Ramanathan, and J. R. Vincent (2006), Integrated sulphur dioxide emissions from India: I‐Fossil fuel combustion, Atmos.
model shows that atmospheric brown clouds and greenhouse gases have Environ., 36, 677–697, doi:10.1016/S1352-2310(01)00463-0.
reduced rice harvests in India, Proc. Natl. Acad. Sci. U. S. A., 103, Schwarz, J. P., et al. (2006), Single‐particle measurements of midlatitude
19,668–19,672, doi:10.1073/pnas.0609584104. black carbon and light‐scattering aerosols from the boundary layer to
Bond, T., E. Bhardwaj, R. Dong, R. Jogani, S. Jung, C. Roden, D. G. the lower stratosphere, J. Geophys. Res., 111, D16207, doi:10.1029/
Streets, and N. Trautmann (2007), Historical emissions of black and 2006JD007076.
organic carbon aerosol from energy‐related combustion, 1850–2000, Slowik, J. G., et al. (2007), An inter‐comparison of instruments measuring
Global Biogeochem. Cycles, 21, GB2018, doi:10.1029/2006GB002840. black carbon content of soot particles, Aerosol Sci. Technol., 41, 295–314,
Chameides, W. L., et al. (1999), Case study of the effects of atmospheric doi:10.1080/02786820701197078.
aerosols and regional haze on agriculture: An opportunity to enhance Stephens, M., N. Turner, and J. Sandberg (2003), Particle identification by
crop yields in China through emission controls?, Proc. Natl. Acad. Sci. laser‐induced incandescence in a solid‐state laser cavity, Appl. Opt.,
U. S. A., 96, 13,626–13,633, doi:10.1073/pnas.96.24.13626. 42(19), 3726–3736, doi:10.1364/AO.42.003726.
Clarke, A. D., et al. (2004), Size distributions and mixtures of dust and Stone, E. A., J. J. Schauer, G. G. Pradhan, P. D. Dangol, G. Habib,
black carbon aerosol in Asian outflow: Physiochemistry and optical C. Venkataraman, and V. Ramanathan (2010), Characterization of emis-
properties, J. Geophys. Res., 109, D15S09, doi:10.1029/2003JD004378. sions from South Asian biofuels and application to source apportionment
Cong, Z., S. Kang, and D. Qin (2009), Seasonal features of aerosol particles of carbonaceous aerosol in the Himalayas, J. Geophys. Res., 115, D06301,
recorded in snow from Mt. Qomolangma (Everest) and their environ- doi:10.1029/2009JD011881.
mental implications, J. Environ. Sci., 21, 914–919, doi:10.1016/S1001- Streets, D. G., K. F. Yarber, J. H. Woo, and G. R. Carmichael (2003), Bio-
0742(08)62361-X. mass burning in Asia: Annual and seasonal estimates and atmospheric
Flanner, M. G., C. S. Zender, J. T. Randerson, and P. J. Rasch (2007), emissions, Global Biogeochem. Cycles, 17(4), 1099, doi:10.1029/
Present‐day climate forcing and response from black carbon in snow, 2003GB002040.
J. Geophys. Res., 112, D11202, doi:10.1029/2006JD008003. Takeuchi, N. (2002), Optical characteristics of cryoconite (surface dust) on
Flanner, M. G., C. S. Zender, P. G. Hess, N. Mahowald, T. H. Painter, glaciers: The relationship between light absorbency and the property of
V. Ramanathan, and P. J. Rasch (2009), Springtime warming and organic matter contained in the cryoconite, Ann. Glaciol., 34, 409–414,
reduced snow cover from carbonaceous particles, Atmos. Chem. Phys., doi:10.3189/172756402781817743.
9, 2481–2497, doi:10.5194/acp-9-2481-2009. Tian, L., T. Yao, P. F. Schuster, J. W. C. White, K. Ichiyanagi, E. Pendall,
Gustafsson, O., M. Krusa, Z. Zencak, R. J. Sheesley, L. Granat, E. Engstron, J. Pu, and W. Yu (2003), Oxygen‐18 concentrations in recent precipita-
P. S. Praveen, P. S. P. Rao, C. Leck, and H. Rodhe (2009), Brown clouds tion and ice cores on the Tibetan Plateau, J. Geophys. Res., 108(D9),
over South Asia: Biomass or fossil fuel combustion?, Science, 323, 4293, doi:10.1029/2002JD002173.
495–498, doi:10.1126/science.1164857. Venkataraman, C., G. Habib, D. Kadamba, M. Shrivastava, J.‐F. Leon,
Hansen, J., and L. Nazarenko (2004), Soot climate forcing via snow and ice B. Crouzille, O. Boucher, and D. G. Streets (2006), Emissions from open
albedos, Proc. Natl. Acad. Sci. U. S. A., 101, 423–428, doi:10.1073/ biomass burning in India: Integrating the inventory approach with high‐
pnas.2237157100. resolution Moderate Resolution Imaging Spectroradiometer (MODIS)
Kaspari, S., P. A. Mayewski, M. J. Handley, S. Kang, S. Hou, K. Maasch, active‐fire and land cover data, Global Biogeochem. Cycles, 20,
and D. Qin (2009), A high‐resolution record of atmospheric dust variability GB2013, doi:10.1029/2005GB002547.
and composition since 1650 AD from a Mt. Everest ice core, J. Clim., Warren, S. (1984), Impurities in snow: Effects on albedo and snowmelt
22(12), 3910–3925, doi:10.1175/2009JCLI2518.1. (review), Ann. Glaciol., 5, 177–179.
Lau, W. K. M., M. K. Kim, K. M. Kim, and W. S. Lee (2010), Enhanced Xu, B., et al. (2009), Black soot and the survival of Tibetan glaciers,
surface warming and accelerated snowmelt in the Himalayas and Tibetan Proc. Natl. Acad. Sci. U. S. A., 106, 22,114–22,118, doi:10.1073/pnas.
Plateau induced by absorbing aerosols, Environ. Res. Lett., 5(2), 025204, 0910444106.
doi:10.1088/1748-9326/5/2/025204. Xu, J., et al. (2010), A 108.83‐m ice‐core record of atmospheric dust depo-
Liu, X., B. Xu, T. Yao, N. Wang, and G. Wu (2008), Carbonaceous parti- sition at Mt. Qomolangma (Everest), central Himalaya, Quat. Res., 73,
cles in Muztag Ata ice core, West Kunlun Mountains, China, Chin. Sci. 33–38, doi:10.1016/j.yqres.2009.09.005.
Bull., 53(21), 3379–3386, doi:10.1007/s11434-008-0294-5.
Marinoni, A., et al. (2010), Aerosol mass and black carbon concentrations, M. G. Flanner, Department of Atmospheric, Oceanic and Space Sciences,
two year‐round observations at NCO‐P (5079 m, Southern Himalayas), University of Michigan, Ann Arbor, MI 48109, USA.
Atmos. Chem. Phys. Discuss., 10, 8379–8413, doi:10.5194/acpd-10-
8379-2010.
5 of 6L04703 KASPARI ET AL.: MT. EVEREST ICE CORE BLACK CARBON L04703
M. Gysel, Laboratory of Atmospheric Chemistry, Paul Scherrer Institut, S. D. Kaspari, Department of Geological Sciences, Central Washington
CH‐5232 Villigen PSI, Switzerland. University, Ellensburg, WA 98926, USA. (kaspari@geology.cwu.edu)
S. Hou, State Key Laboratory of Cryospheric Sciences, Chinese Academy P. A. Mayewski, Climate Change Institute, University of Maine, Orono,
of Sciences, Lanzhou, 730000, China. ME 04469, USA.
S. Kang, Institute of Tibetan Plateau Research, Chinese Academy of M. Schwikowski, Laboratory for Radiochemistry and Environmental
Sciences, Beijing, 100085, China. Chemistry, Paul Scherrer Institut, CH‐5232 Villigen PSI, Switzerland.
6 of 6You can also read