Attacking Snacks Opportunities in a Growth Segment - NAMA

Page created by Billy Frank
 
CONTINUE READING
Attacking Snacks Opportunities in a Growth Segment - NAMA
Attacking
Snacks
Opportunities in a Growth Segment
Attacking Snacks Opportunities in a Growth Segment - NAMA
About
Technomic
Only Technomic delivers a 360°
view of the food industry. We
impact growth and profitability
for our clients by providing
consumer-grounded vision and
channel-relevant strategic
insights.

© 2019 Technomic, Inc.            2
Attacking Snacks Opportunities in a Growth Segment - NAMA
Technomic
is Part of
Winsight                 Media   Events

© 2019 Technomic, Inc.                    3
Attacking Snacks Opportunities in a Growth Segment - NAMA
Objectives

  ●Provide situation analysis,
   outlook
  ●Assess customer dynamics
  ●Develop implications

© 2019 Technomic, Inc.           4
Attacking Snacks Opportunities in a Growth Segment - NAMA
What is Snacking?

© 2019 Technomic, Inc.                       5
Attacking Snacks Opportunities in a Growth Segment - NAMA
Snack Definitions
Traditional snack definitions are on the decline
                                                                                                 64%
                    By when it's consumed: nontraditional meal hours                           55%
                                                                                                  68%
                                                                                            44%
                         By item type: items traditionally sold as snacks                     49%
                                                                                            42%
                                                                                           35%
                                                       By size: smaller portions             44%
                                                                                          31%
                                                                                    15%
                                            By prep time: little prep needed         18%                Overall
                                                                                    13%
                                                                                                        18-34
                                                                                   8%
                                                          By purchase location     8%                   35+
                                                                                   8%
                                                                                   7%
                             By price: inexpensive/cheaper than a meal              11%
                                                                                   6%
Base: 1,705 consumers (includes terminates)
Source: 2018 Snacking Occasion Consumer Trend Report
© 2019 Technomic, Inc.                                                                                            6
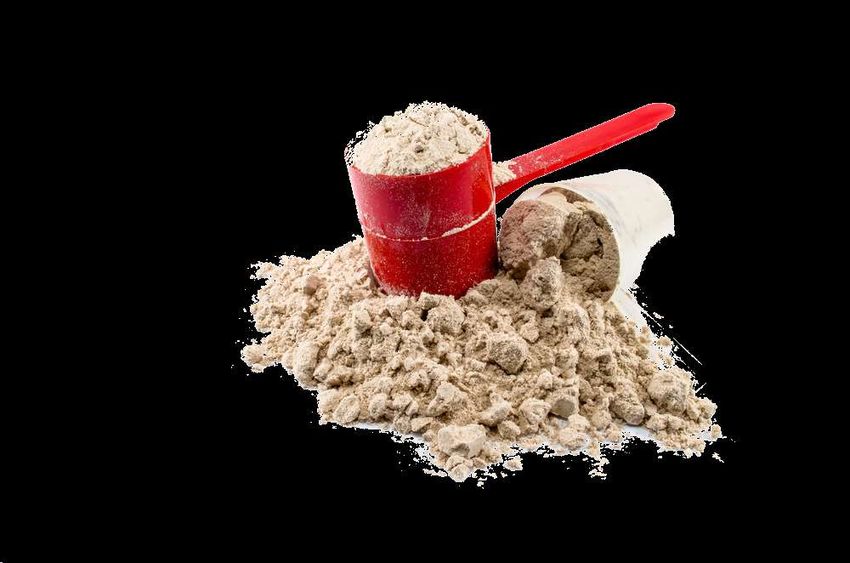
Attacking Snacks Opportunities in a Growth Segment - NAMA
Snack Definition
Shifts
                                                                                                    61%
                                                                     Has not changed              43%
                                                                                                     70%
More younger than older                                              Now includes            22%
consumers have broadened                                           more types of food
                                                                                              33%
                                                                                            16%
their snack definitions
                                                        Now includes more packaged         11%
                                                                                            16%
                                                       items offered at retail locations   8%
                                                                                           10%
                                                             Now includes beverages         17%
                                                                                           7%
                                                                 Now includes a wider      9%
                                                                                            14%
                                                                 variety of beverages      7%              Overall
                                                                                                           18-34
                                                       Now includes foods/beverages        9%
                                                            consumed as meal                               35+
                                                                                            12%
                                                               replacements                7%
                                                            Now includes more items        6%
                                                                    offered at              10%
Base: 1,705 consumers (includes terminates)
Source: 2018 Snacking Occasion Consumer Trend Report         restaurants/foodservice       4%
© 2019 Technomic, Inc.                                                                                               7
Attacking Snacks Opportunities in a Growth Segment - NAMA
Typical Eating
Behavior
Consumers increasingly replace meals with snacks as the
grazing trend continues

      53%
                                                                                                           2016     2018
                   43%
                                          32%
                                27%

                                                                9%        10%    8%
                                                        4%                                 3%     4%        2%      3%

    Three meals a   Usually skip or                    Usually skip or    Three meals a   Three meals a     Usually snack
    day with a few replace one meal                     replace two       day with many    day with no    instead of eating
   snacks between     per day with                     meals per day     snacks between      snacks           full meals
        meals           snacks                          with snacks           meals

Base: 1,500 consumers (2018 & 2016)
Source: 2018 Snacking Occasion Consumer Trend Report
© 2019 Technomic, Inc.                                                                                                        8
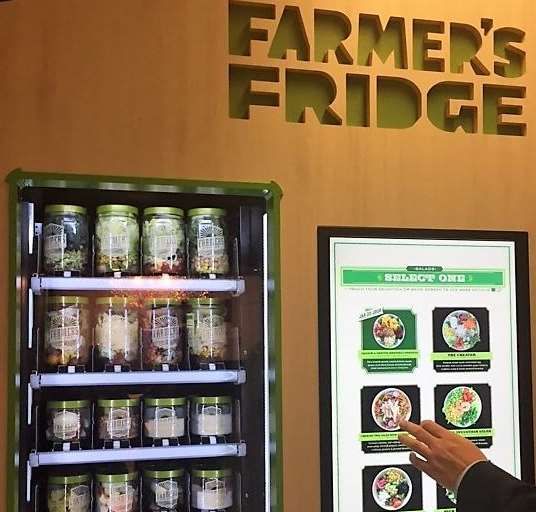
Attacking Snacks Opportunities in a Growth Segment - NAMA
Snacks Per Day
Snacking between meals shows an upward trend since 2013

                                                                                          2.9                     2.8
                                                2.6                                 2.7                     2.7
                     2.5         2.5                          2.4             2.5               2.5   2.4
     2.3

 May '13 Feb. '14 June '14 May '15 Aug. '15 Jan. '16 June '16 Oct. '16 Dec. '16 June '17 Aug. '17 Jan. '18

Base: Approximately 2,000 consumers (varies by survey, includes terminates)
Source: 2018 Snacking Occasion Consumer Trend Report
© 2019 Technomic, Inc.                                                                                                  9
Attacking Snacks Opportunities in a Growth Segment - NAMA
Snack Consumption                                                                                30%
Frequency                                                                                        say snacking between
                                                                                                 meals is part of a healthy
                                                                                                 diet

    31% of                                                                                                     2016     2018
    younger
    consumers
                                                        38%
                                                           34%

                                                                          23%23%
                               16%16%

       6% 7%                                                                          8% 9%
                                                                                                  5% 6%           4% 6%

    4 or more                   3 times                   2 times        Once a day   3-6 days   1-2 days     Less often than
  times per day                 per day                   per day                     per week   per week      once a week

Base: 1,705 (2018), 1,633 (2016) (includes terminates) & 808 (callout)
Source: 2018 Snacking Occasion Consumer Trend Report
© 2019 Technomic, Inc.                                                                                                         10
Consumption by
Daypart
                                                                                      75% 73% 76%

                                                                                                            50%
                                                                                                     42%          39%
                                      44%                                 30%                                                 32%
                                                                 26%                                                    27%         25%
   at least somewhat agree that                                                 24%
     they eat snacks as a second
 breakfast once they get to work
                       or school

                                                                         Morning       Afternoon        Evening          Late night

                                                                                          Overall   18-34    35+
Base: 1,705 (2018), 1,633 (2016) (includes terminates) & 808 (callout)
Source: 2018 Snacking Occasion Consumer Trend Report
© 2019 Technomic, Inc.                                                                                                                    11
Leading Purchase
Drivers

                                                       Top 3 words that
  1. Flavor or taste                                   consumers say best
     (81%)                                             describe the foods they
  2. Freshness (63%)                                   crave:
  3. It will satisfy my hunger                          ● Comfort food
     (63%)                                              ● Fresh
                                                        ● Savory

Base: Approximately 790 consumers
Source: 2018 Snacking Occasion Consumer Trend Report
© 2019 Technomic, Inc.                                                           12
Snacking in the
              Convenience Channel

© 2019 Technomic, Inc.              13
Hyperchoice Impacts
Snack Selection                                                   Supermarket
                                                                  Foodservice
                                                    Convenience
                                                       stores
           New-age
           vending         Pantry
                         foodservice

                                       Food halls                 Dollar stores

         Micromarkets    Food trucks                       QSR

© 2019 Technomic, Inc.                                                            14
Vending Still a
Primary Source for
Snacks
                         Sourced a Snack in the   Among 18-34 year olds
                             Last 3 Months

  Vending                         25%                     41%

  Micromarkets                    12%                     22%

  Office Coffee/Pantry            14%                     23%

© 2019 Technomic, Inc.                                                    15
Among those who use
                           vending machines

                         Purchase
                         once per              48%
                           week+

© 2019 Technomic, Inc.                               16
Top Items in
Vending                                             Still the “go-to”
                                                   channel for many
                                                       traditional
  Item                   % That “Typically” Buy…      snack foods

  Cold Drinks                      78%

  Chips                            76%

  Candy                            56%

© 2019 Technomic, Inc.                                                  17
Micro Markets
Increasingly
Used for
Snacks
Self-serve, self-pay grab-and-go
  ● Business & industry
  ● College & university
  ● Healthcare

© 2019 Technomic, Inc.             18
Among those who use
                               micromarkets

                         Purchase
                         once per              82%
                           week+

© 2019 Technomic, Inc.                               19
Top Items in Micro-
Markets                                            Purchase behavior
                                                    includes many
                                                       additional
  Item                   % That “Typically” Buy…   “non-traditional”
                                                    snacking items
  Cold Drinks                      53%

  Chips                            43%

  Baked Goods                      38%

© 2019 Technomic, Inc.                                                 20
54% 42%
                               Micromarket     Micromarket
                           consumers would     consumers would
                            choose fast-food   choose full-service
                         restaurants instead   restaurants instead
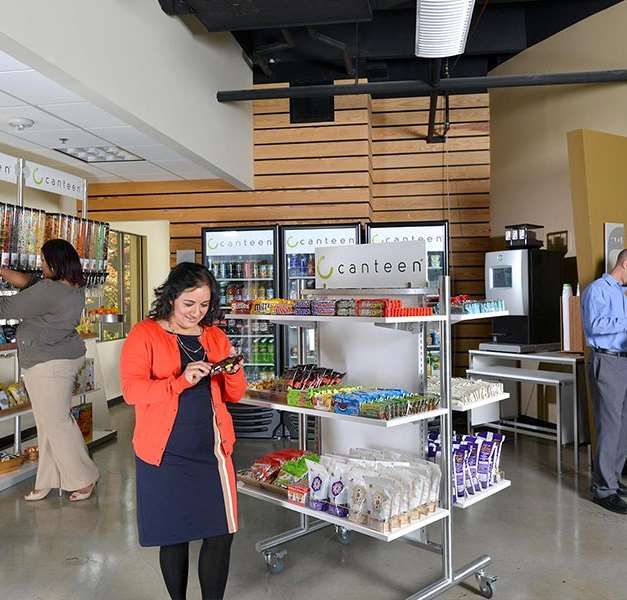
© 2019 Technomic, Inc.                                               21
Pantry
Growth
Exploding
An employee benefit

  ● Corporate settings,
    presented as a perk
  ● Food and beverages are
    typically free
  ● A fixture at companies such
    as Amazon, Apple and
    Google

© 2019 Technomic, Inc.            22
Top Items in
Pantries                                                But Also
                                                     Overindexes on
                                                    Sandwiches, Other
  Item                   % That “Typically” Buy…   Types of Snacks and
                                                      Baked Goods
  Cold Drinks                      50%

  Chips                            40%

  Baked Goods                      33%

© 2019 Technomic, Inc.                                                   23
Among those who use pantries

                         Patronize
                          once per
                            week+
                                          82%
© 2019 Technomic, Inc.                          24
Trends to Watch

© 2019 Technomic, Inc.                     25
Consumption                                                        Compared to two years ago, I am snacking…

Shifts                                                                                                         34%
Health                                                               ...on healthier food                       36%
                                                                                                              33%

                                                                                                      15%
                                                               ...on healthier beverages                19%
                                                                                                     14%
Those with changing habits are
choosing healthier snacks                                                                         7%
                                                                 ...on less healthful food          11%
                                                                                                 6%

                                                                                                6%
                                                           ...on less healthful beverages         10%
                                                                                               4%
Base: 1,500 consumers
Q: In which ways, if any, has your snacking behavior
changed in the last two years? Select all. (Healthy/less                        Overall      18-34   35+
healthy options were mutually exclusive)
© 2019 Technomic, Inc.                                                                                                26
Vending Machines
New-age healthy vending machines are likely to pull in
younger consumers
                                                                                      29%
                                                    I would purchase snacks
                                                     from vending machines                  48%
                                                      offering healthful items
                                                                                     21%   34% of women

                                                                                    20%
                                                     Vending machines are
                                                                                      30%
                                                    a good option for snacks

                                                                                    15%

Base: Approximately 805 consumers
Q: Please indicate how much you agree or disagree
with the following statements. Agree & agree                    Overall     18-34   35+
completely.
© 2019 Technomic, Inc.                                                                                    27
Better for
You
Superfoods and healthy
snack boxes

 ● Nature Box
 ● Graze
 ● Urthbox

© 2019 Technomic, Inc.   28
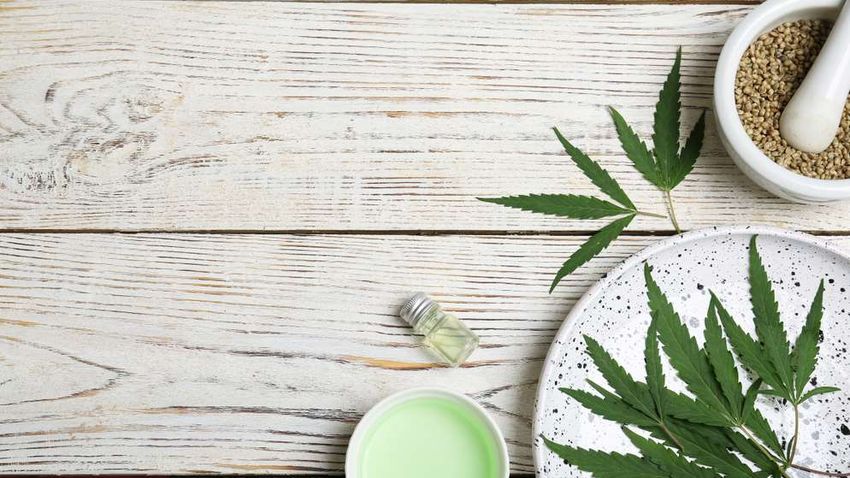
Natural
Enhancements

67% of consumers
would be more likely to buy
food or beverage having
functional benefits

                              32%           would
                              pay more for it

© 2019 Technomic, Inc.                              29
Natural
Enhancements
PHYSICAL                    EMOTIONAL                    MENTAL
Beauty/Hair, Skin + Nails   Stress Relief/Anti-Anxiety   Cognitive Function/Memory
  ●    Collagen              ● Karkade                    ● Turmeric
  ●    Maracuja              ● Acerola                    ● Cannabis
  ●    Goldenberry           ● Lotus                      ● Nutritional Yeast
  ●    Cactus/Nopal

© 2019 Technomic, Inc.                                                               30
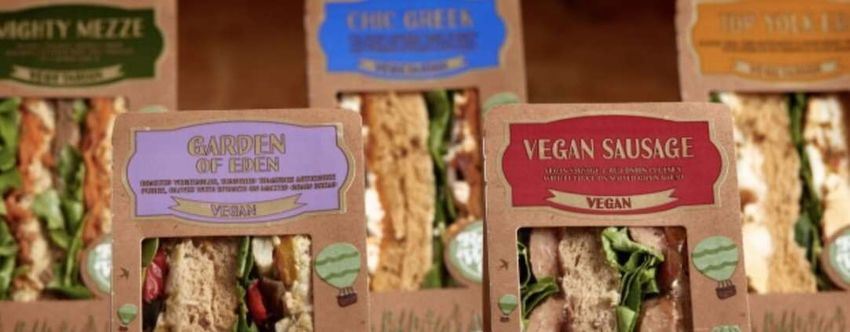
Vegan Vending                      ● 2BU vending
                                   ● Füd Revolution
Serving up the plant-based trend
                                   ● Green Rendez-vous

© 2019 Technomic, Inc.                                   31
Clean
Labels &
Free
Foods
The “new” healthy

  ●    Creates buzz
  ●    Millennial magnet
  ●    “Open-air” restaurant format
  ●    Farmer’s Fridge, Chicago
  ●    $30M investment to expand

© 2019 Technomic, Inc.                32
Protein-Enriched
Snacks

                         52%               of consumers
                         find high-protein snacks
                         appealing

                                                          ●   Nuts and seeds
                                                          ●   New protein sources
                                                          ●   Great grains
                                                          ●   Faux meat
                                                          ●   Plant-based everything

© 2019 Technomic, Inc.                                                                 33
Cannabis Craze
9.0%                             increase of cannabis on menus

171%                           increase of online posts about
CBD over two years

72%                        would visit a restaurant concept
that incorporates marijuana in its food

Base: Q3 2017-Q3 2018; 572 (Consumers in states where legalization of recreational marijuana/cannabis products is
somewhat likely to occur in the next two to three years)
Source: Infegy; Technomic Ignite menu data; The Marijuana Effect Multi
© 2019 Technomic, Inc.                                                                                              34
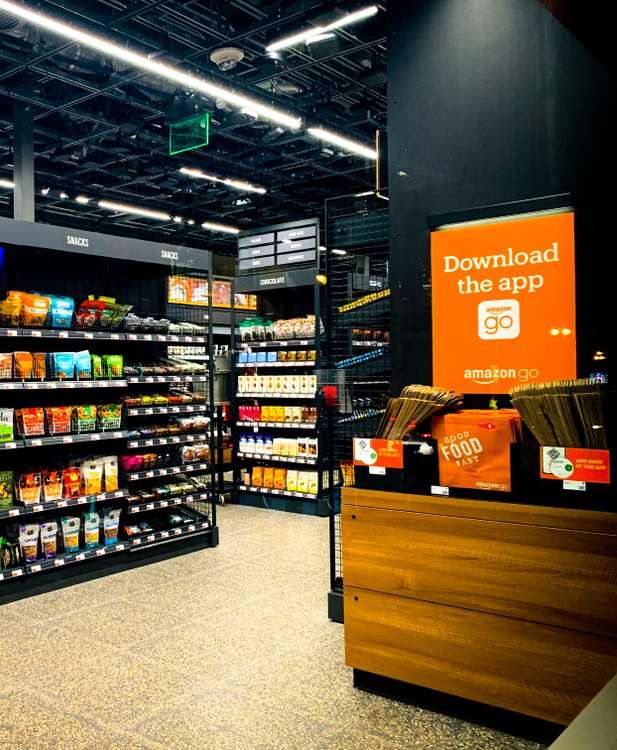
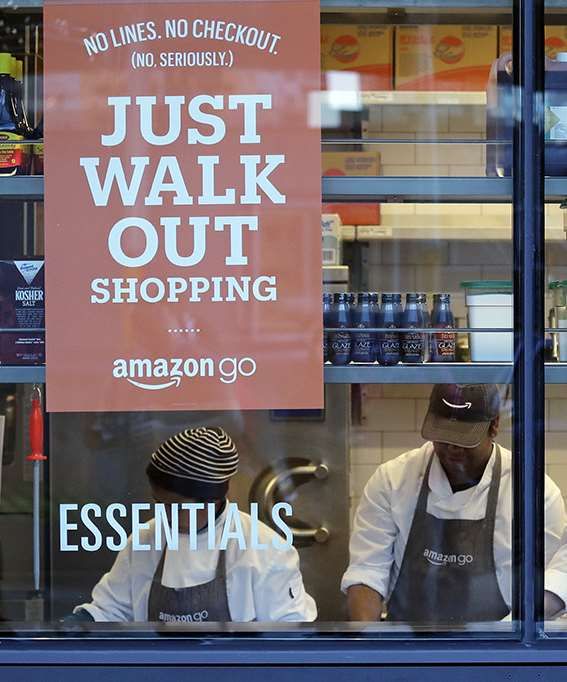
Conclusions and Final
                  Thoughts

© 2019 Technomic, Inc.               35
Final
Thoughts
We are witnessing the battle for
snacking convenience

   ● Amazon Go
   ● Tap-and-go payments
   ● App-enabled everything

© 2019 Technomic, Inc.             36
Takeaways
1.        Snacking is still growing but consumer habits, behavior undergoing
          major shifts

2. Indulgence hasn’t disappeared, but other factors now driving sales

3. Taste/flavor should be top of mind

4. Stay atop regulations, legislation

5. Trends likely to start in the snack mealpart

© 2019 Technomic, Inc.                                                         37
Questions?

                                               David Henkes
                                               Senior Principal
                                               dhenkes@technomic.com
                                               @davidhenkes

312-876-0004 | foodinfo@technomic.com | technomic.com
© 2019 Technomic, Inc.                                                 38
You can also read