Automatic Enrollment: Revisiting the Original Proposal - Annual NERI Labour Market Conference Webinar Jim Stewart
←
→
Page content transcription
If your browser does not render page correctly, please read the page content below
Annual NERI Labour Market Conference Webinar

                 17-18th September 2020

Automatic Enrollment: Revisiting the Original
                 Proposal

                       Jim Stewart

Adjunct Associate Professor in Finance, School of Business,
  Trinity College, Trinity Business School, Trinity College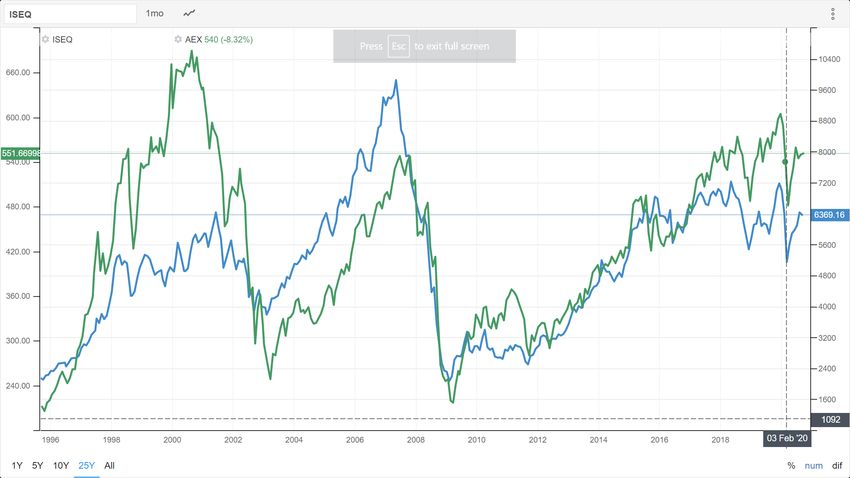
Some Features of Automatic Enrolment
• The program for Government (May 2020) stated that a new
  Automatic Enrolment (AE) pensions scheme “will be introduced”.
• An AE scheme was first discussed in a Green paper on pensions in
  2007.
• In 2010 a Framework document described in some detail a
  proposed AE scheme.
• Employees without pension coverage and with earnings over
  €18000 (indicative) would be automatically enrolled in a pension
  scheme.
• There were variations on the 2010 scheme announced in a
  Roadmap for pensions in 2018 and in October 2019.
• Employee and employer contributions were each set at a maximum
  of 6% of earnings. With the State contribution to be decided.

                                                                 2
Stated Reasons for Introducing AE
• The Roadmap (2018) AE scheme is very similar to the original proposal.
• But reasons for introducing an AE scheme are somewhat different.
• Both proposals argue that pension savings are inadequate.
• Both reports have a policy objective of increasing private sector pension
saving.
• Both reports state that concurrent with inadequate retirement savings the
Social Insurance Fund/State pension funding will face increasing deficits.
• Actuarial Reviews of the Social Insurance Fund have linked changing
demographic structures to the viability of State old age pensions.
• Forecast deficits have proved to be highly inaccurate.
• The Actuarial review for 2010 had forecast a deficit of 3 billion.
• The Acutarial review for 2015 forecast a €0 surplus
• The actual position was a surplus of €1.4 billion for 2019 (although a large
deficit is likely for 2020).
3UK Data and Adequacy
• The Framework document (2010) states that introducing an
AE scheme would increase “coverage and adequacy”.
• The Roadmap (2018) has references to increased coverage
but no reference to increased adequacy from an AE scheme .
• Evidence from the UK shows that following the introduction of
AE, coverage increased, but contribution rates fell (Table 1).
• Savings per eligible saver are low, indicating future problems
with pension adequacy.
• Average contribution to DB type schemes was almost five
times high than DC schemes.
4Table (1) :UK Data: Coverage versus adequacy
2012 2013 2014 2015 2016 2017 2018
Average contribution 9.7 9.1 4.7 4 4.2 3.4 5.0
to DC schemes (%)
(6.6) (6.1) (2.9) (2.5) (3.2) (2.1) (2.4)
Average contribution 20.1 20.6 20.9 21.2 22.7 25..2 25.6
to DB schemes% (16.2)
(15.2) (5.2) (15.8) (16.9) (19.2) (19.2)
Amount saved per £7000 £6957 £6653 £5774 £5418 £5387 £5110
‘eligible saver”
• Employer contributions are in brackets
5Returns assuming 7%
• Reasons given for an AE scheme are broadly similar in both
reports.
• But key assumptions underlying the proposed AE pension
scheme have changed substantially.
• For example (1), Table 2) shows the projected value of returns
using Framework document assumptions.
• Assumed returns are 7% per annum (net of costs); 40 years of
contributions; an annual salary of €40,000 with a contribution
rate of 8% of salary.
• The value of the lump sum after 40 years is €698000, and
assuming an annuity rate of 24 (4.1%), the yearly pension is
€29,000.
6Returns assuming 1%
• Example Table (2) example (6) assumes that returns fall
to 1% per annum and there is a 12% fall in the value of
the accumulated fund at the end of every decade.
• The value of the accumulated fund falls to €113,000 and
the annual pension is €4,721 (assuming the same annuity
rate).
• The total value of all contributions (€127,680) is greater
than the value of the pension fund assets.
• However from an employees perspective, the
accumulated lump sum is still greater than the sum of
employee contributions (€63,840) because of the value
of the employers contribution and tax reliefs.
7Table (2): Returns using different assumptions
Example 1 Example 2 Example 4 Example 5 Example 6
7% return 5.5% return Example 3 7% return, 4.5% return, 1% return, 12% fall
1% return 12% fall at 12% fall at end at end of every
end of every of every decade
decade decade
Annual
Salary 40,000 40,000 40,0000 40,000 40,0000 40,0000
Monthly
salary €3333 €3333 €3333 €3333 €3333 3333
Total
contribution
€266 €266 €266 €266 €266 266
Value of
Fund €698,200 €463,116 €156,911 u€442,168 €240,493 €113,315
Yearly
pension €29,091 €19,296 €6,538 €18,423 €10,020 €4,721
Monthly
pension1
€2424 €1608 € 544 €1535 €835 €393
8How realistic are returns of 1% ?
• Chart (1) shows Euro zone 10 year government bond yields
from 2014 to 2020.
• The figure shows that average Eurozone bond yields have
been under 1% since March 2019.
• Irish 10 year bond yields have varied around 0% since August
2019.
• German 10 bond yields have been negative since April 2019
and were -0.398% in August 2019.
• These low and negative yields are likely to persist because of
ECB policies to support the Eurozone bond market.
9-1
0
1
2
3
4
-0.5
0.5
1.5
2.5
3.5
31/01/2014
31/03/2014
30/05/2014
31/07/2014
30/09/2014
28/11/2014
31/01/2015
31/03/2015
30/05/2015
31/07/2015
30/09/2015
30/11/2015
29/01/2015
31/03/2016
May 31 2015
July 29 2016
30/09/2020
Average for Eurozone countries
30/11/2020
31/01/2020
31/03/2020
31/05/2020
31/07/2020
29/09/2020
Irish bond yield
01/11/2017
01/01/2018
01/03/2018
01/05/2018
01/07/2018
01/09/2018
01/11/2018
Eurozone Bond yields 2014-2020
01/01/2019
German bond yield
01/03/2019
01/05/2019
01/07/2019
01/09/2019
Nov 29 2019
Jan 31 2020
March 31 2020
May 31 2020
July 31 2020
10What about Volatility ?
• Figure 2 shows the main Irish Stock market index for the last
25 years
• Irish stock market indices have shown high volatility and
hence risk, but Fig (2) this is also true of the Netherlands.
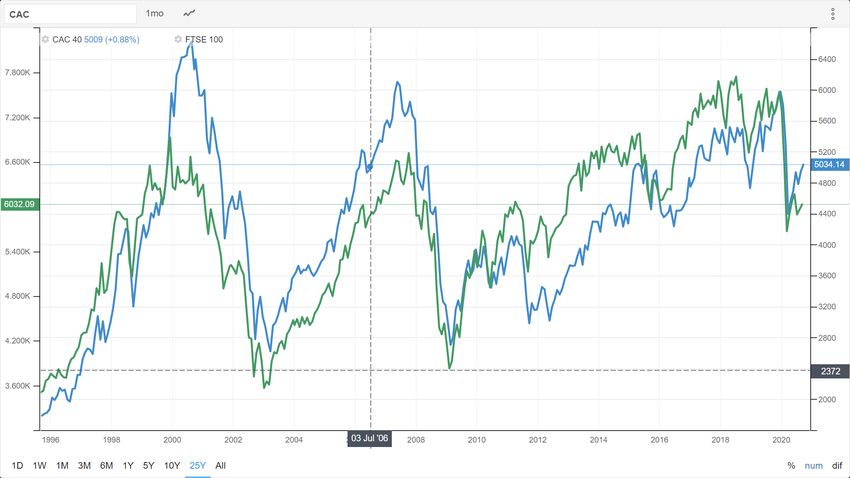
• Fig (3) show similar volaltility for indices for UK and France.
• Indices for many other countries show similar volatility.
• These and many other indices are below their peak in 2000.
• Volatility in stock markets indices is not necessarily indicative
of volatility in pension fund assets.
• However Stock market volatility is likely to be corelated with
other asset prices, such as commodities and certain
derivatives based on assets prices.
11Stock Market Volatility ISEQ index compared with Netherlands index
1996-2020
12Stock Market Volatility: UK index and French index
1996-2020
13Conclusion
• What is the most efficient system to deliver income to those in retirement ,
PAYG or a funded pension system?
• A funded Automatic Enrolment (AE) pension scheme is not a solution for many
of those without pension coverage because:-
(a) Returns are low compared with initial projected returns of 7%
per annum and are likely to remain low due to ECB policies and because
of volatility risk is high;
(b) For employees with low pay, variable work history with periods
of unemployment, and frequent changes in employers, AE type
schemes are unlikely to provide adequate supplementary pensions
for those without pension coverage.
(c) Costs for proposed AE scheme are likely to be large.
For example costs due to, administration; the proposed
Central Processing Authority; financial incentives, and managing funds.
These latter costs will be capped at 0.5%,but this will exclude
certain trading costs, for example in bid and ask spreads.
14You can also read