Automatic Fall Risk Estimation using the Nintendo Wii Balance Board
←
→
Page content transcription
If your browser does not render page correctly, please read the page content below
Automatic Fall Risk Estimation using the Nintendo Wii Balance Board

            Gert Mertes1,2,3 , Greet Baldewijns1,2,3 , Pieter-Jan Dingenen1 , Tom Croonenborghs1,4
                                           and Bart Vanrumste1,2,3
                                              1 KU
                                               Leuven, Campus Geel, AdvISe, Geel, Belgium
                                                2 KU
                                                 Leuven, ESAT-STADIUS, Leuven, Belgium
                                 3 iMinds Medical Information Technology Department, Ghent, Belgium
                               4 KU Leuven, Department of Computer Science, DTAI, Heverlee, Belgium

Keywords:         Wii Balance Board, Center of Pressure, Fall Risk Classification, Machine Learning, Support Vector Machine,
                  K-Nearest Neighbours.

Abstract:         In this paper, a tool to assess a person’s fall risk with the Nintendo Wii Balance Board based on Center of
                  Pressure (CoP) recordings is presented. Support Vector Machine and K-Nearest Neighbours classifiers are
                  used to distinguish between people who experienced a fall in the past twelve months and those who have
                  not. The classifiers are trained using data recorded from 39 people containing a mix of students and elderly.
                  Validation is done using 10-fold cross-validation and the classifiers are also validated against additional data
                  recorded from 12 elderly. A cross-validated average accuracy of 96.49% ± 4.02 is achieved with the SVM
                  classifier with radial basis function kernel and 95.72% ± 1.48 is achieved with the KNN classifier with k = 4.
                  Validation against the additional dataset of 12 elderly results in a maximum accuracy of 76.6% with the linear
                  SVM.

1    INTRODUCTION                                                                  tion of the medication regime or the implementation
                                                                                   of an exercise programme. The home environment
A third of all older persons aged 65 or older fall at                              of the older person could furthermore be adapted to
least once a year (Milisen et al., 2004), (Robertson                               further reduce the risk (e.g.: removing loose carpets,
and Gillespie, 2013). Approximately 10% of these                                   installing new light fixtures, etc.).
fall incidents result in serious injuries. Moreover, 7%                                To date several methods to assess the fall risk of
of emergency room visits are due to fall incidents                                 a person such as the Timed-get-Up-and-Go (TUG)
(Tinetti, 2003).                                                                   test (Martin, 2011), (Podsiadlo and Richardson, 1991)
    Fall incidents, however, not only result in physio-                            and the Tinetti Mobility test (Tinetti et al., 1986) al-
logical injuries but also have an impact on the psy-                               ready exist.
chological health of the person that fell. After all,                                  During the TUG test, the elderly is asked to rise
fall incidents can lead to fear of future falls which                              from a chair, walk three meters, turn around, return to
in turn can cause the elderly to move less and there-                              the chair and sit down. The fall risk is subsequently
fore spend more time indoors (Tinetti and Williams,                                quantified using the manually recorded time to com-
1998), (Milisen et al., 2004), (Noury et al., 2008).                               plete the test combined with the observations of the
The resulting isolation and lack of exercise can in turn                           health care professional (e.g.: visible shuffling, pos-
reduce the muscle strength of the older person which                               ture during the walk, etc.). Typically, the elderly is
causes an increase of the fall risk. Preventing fall inci-                         considered at risk when the time needed to complete
dents would therefore not only contribute to reducing                              the test exceeds 14 seconds or if the person has a very
fall related health care costs, but would also greatly                             unstable gait pattern (Large et al., 2006).
contribute to the quality of life of older persons.                                    The Tinetti test in turn evaluates a person’s bal-
    When an elevated fall risk can be detected at an                               ance and gait using a series of exercises. Balance is
early stage, preventive measures can be taken to re-                               evaluated using nine exercises including, among oth-
duce this risk and hence reduce the number of fall in-                             ers, standing up from a chair and the ability to with-
cidents. These possible measures include an adapta-                                stand a nudge to the chest. Gait is evaluated by ob-

      Mertes G., Baldewijns G., Dingenen P., Croonenborghs T. and Vanrumste B..
      Automatic Fall Risk Estimation using the Nintendo Wii Balance Board.
                                                                                                                                        75
      DOI: 10.5220/0005208700750081
      In Proceedings of the International Conference on Health Informatics (HEALTHINF-2015), pages 75-81
      ISBN: 978-989-758-068-0
      Copyright c 2015 SCITEPRESS (Science and Technology Publications, Lda.)
HEALTHINF2015-InternationalConferenceonHealthInformatics
serving the older person’s step length, step symmetry, methods, e.g. the TUG, and previous studies, our sys-
walking stance, etc. Each exercise is observed and tem does not require trained personnel, no manual in-
subsequently graded on a scale of 0 to 2 after which terpretation of the data is required and no expensive
the grades are summed into a final score. A score be- equipment needs to be present.
low a certain threshold (19 out of 28 points) indicates Fifty-one participants were asked to stand on the
a balance or gait problem (Tinetti et al., 1986). Wii BB for 40 seconds while the pressure on the sen-
Other tests include the Four Test Balance Scale sors was sampled. The pressure measured on the
(Gardner et al., 2001), the Functional Reach test as force plate is used to calculate the CoP trajectory.
described by (Duncan et al., 1992), the Five Times Sit Features are subsequently extracted from the CoP tra-
to Stand Test proposed by (Guralnik et al., 1995), the jectories and used to automatically classify if a person
Berg Balance Scale developed by (Berg et al., 1989) is at risk for falling.
and the Balance Evaluation Systems Test by (Horak In the remainder of the paper the data acquisi-
et al., 2009). While providing insight in a person’s tion, preprocessing, feature extraction and classifica-
balance, all of the previously mentioned tests require tion methods using the data of the participants is pre-
specialised personnel to perform the test. Further- sented in section 2. This is followed by a results
more, these tests are mostly administered when a fall section in which the classification results of a Sup-
incident has already taken place and are therefore not port Vector Machine (SVM) and k-Nearest Neigh-
always useful in preventing future falls. bours (KNN) classifier are presented. These results
The aim of the presented study is therefore the de- are subsequently discussed in depth in section 4. Fi-
velopment of an easy to use tool which can detect an nally we conclude that a good classification can he
elevated fall risk at an early stage without the inter- reached using both the SVM as the KNN classifier.
vention of a health care professional. The tool will
make it possible for informal care givers (e.g.: chil-
dren or neighbours of the older person) to have an 2 METHODS
early assessment of the fall risk of their care receiver.
If the tool shows an elevated fall risk, a more in depth 2.1 Dataset
assessment of the causes of this detected risk should
be initiated by a health care professional which can be 2.1.1 Wii Balance Board
followed by the installation of preventive measures.
For this purpose, a system using a force plate is The Wii Balance Board is a game controller devel-
presented. In recent years, force plates have gained oped by Nintendo and introduced in 2007 for the Wii
popularity as a way to measure a person’s balance. video game console. It ships with the game Wii Fit
Force plates offer the advantage of being able to in which users are required to do exercises with or
quickly measure a person’s balance without requir- around the Wii Balance Board, such as Yoga or Aer-
ing specialised personnel. (Melzer et al., 2004) found obics. The game provides visual feedback as well as
that it is possible to discriminate between elderly who track the user’s performance over time.
have recently experienced falls and non-falling el-
derly persons using parameters of mediolateral (ML)
sway extracted from the Center of Pressure (CoP)
trajectory. (Piirtola and Era, 2006) reviewed nine
prospective studies where force platform measure-
ments have been used as predictors of falls among
elderly people. They found that in five studies, fall-
related outcomes were associated with features mea-
sured with the force platform. These systems, how-
ever, use expensive force plates which are not acces-
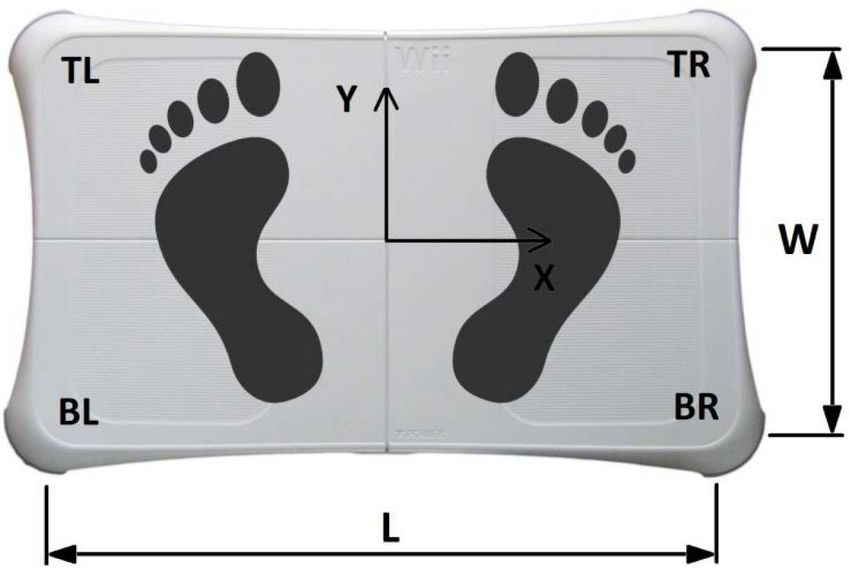
sible for regular care givers. Figure 1: Illustration of the Wii Balance board.
The system proposed in this paper uses a cheap
alternative for these force plates namely the Nintendo The board is shaped like a regular household body
Wii Balance Board (Wii BB). The Wii BB can be used scale. It contains four pressure sensors, one in each
by care givers to quickly and automatically estimate corner as illustrated by figure 1, to measure the forces
if a person is at risk of falling and is, due to the pop- exited by the user on the board. With these 4 forces,
ularity of the Wii console, currently already present the CoP can be calculated using the momentum bal-
in a lot of homes. Compared to current classification ance equations of the board. Communication is han-
76AutomaticFallRiskEstimationusingtheNintendoWiiBalanceBoard
dled by a wireless Bluetooth link. In order to capture tain for the duration of the measurement for all 8 of
the raw sensor data with MATLAB, we used the open- the elderly people who had previously fallen and was
source WiiLab library developed by (Brindza et al., therefore dropped from the study.
2009). Each participant thus performed three different
exercises where each exercise was performed three
2.1.2 Participants times, resulting in nine measurements per participant.
Each measurement lasted 40 seconds, during which
The dataset used for training purposes consists of the data from the 4 pressure sensors was sampled at a
recordings from 39 people. Participants were sorted frequency of 64 Hz.
in three groups: students, elderly without fall history In the remainder of this paper, each exercise is
and elderly with fall history. Participant characteris- addressed using the name of the stance and whether
tics are shown in table 1. the eyes were open or closed, i.e.: Rigid Open (RO),
Sixteen students aged 18 to 22 were recruited on Rigid Closed (RC) and Narrow Open (NO).
campus to act as control group. They declared not
to have any postural balance issues nor experienced a 2.2 Pre-processing
fall due to balance issues.
The group elderly without fall risk consists of 15 Before extracting the CoP trajectory, the raw data is
living at home elderly aged 59 to 79 who declared not pre-processed. The first and last 5 seconds of each
to have fallen in the past 12 months. They were re- measurement are trimmed in order to discard any tran-
cruited by the researchers among family and friends. sient effects, resulting in measurements of 30 sec-
Data from eight elderly people was recorded at a onds. The trimmed data is then filtered using an 8th
nursing home. These people declared to have fallen order Butterworth filter with a cut-off frequency of
at least once in the past 12 months, 6 of which fell at 10 Hz to remove any high frequency noise, which
least twice during this time period. (Salavati et al., 2009) identified as the optimal cut-off
Furthermore, data from an additional 12 elderly, frequency for CoP measurements.
11 females and 1 male, was recorded at a second The CoP trajectory in the ML and anterior-
nursing home. Three persons, with an average age posterior (AP) directions is then calculated using for-
of 84.89 ± 6.88, declared to have fallen at least once mulas 1 and 2, derived from the momentum balance
in the past 12 months. The remaining eight elderly, equations of the board. These formulas contain the
with an average age of 83.67 ± 4.93, had no history forces in each corner of the balance board and its
of falls. This additional dataset is used to validate the width and length (see figure 1).
trained classifiers.
The medical ethical commission of the KU Leu- FT R + FBR − FT L − FBL L
COPML = (1)
ven university hospital approved this study and all FT R + FBR + FT L + FBL 2
participants gave their written informed consent.
FT L + FT R − FBL − FBR W
COPAP = (2)
2.1.3 Procedure FT R + FBR + FT L + FBL 2
Participants were asked to stand on the balance board
2.3 Feature Extraction
and perform standardised exercises. The exercises re-
From the CoP trajectories, we extract the mean ve-
quired the participant to stay as rigid as possible with
locity, standard deviation of the velocity and the stan-
their arms positioned next to their body and looking
dard deviation of the amplitude in both the ML and
straight ahead.
AP directions. Our choice of features is based on
In the first exercise the participant places the feet
the findings of (Piirtola and Era, 2006) and (Melzer
on predefined outlines located on the balance board,
et al., 2004) which show that both velocity and am-
as shown in figure 1. This stance is hereby referred to
plitude can be used as an indicator of falls. While
as the rigid stance. In the second exercise the partic-
other features such as the 95% confidence ellipse area
ipant was asked to stand in the center of the balance
have also proven successful, we hypothesised, based
board with feet and knees pressed together, referred
on the results of the before mentioned studies, that
to as the narrow stance.
two-dimensional features of velocity and amplitude
According to (Melzer et al., 2010), visual feed-
would allow for a classifier with a sufficiently high
back influences postural sway. Participants were
accuracy.
therefore asked to perform the exercises with both
eyes open and eyes closed. The narrow stance exer-
cise with closed eyes proved to be impossible to main-
77HEALTHINF2015-InternationalConferenceonHealthInformatics
Table 1: Characteristics of the participants included in the training data. [mean ± std.dev.]
Students (N = 16) Elderly non-fallers (N = 15) Elderly fallers (N = 8)
Age 19.53 ± 1.77 71.87 ± 5.80 85.40 ± 5.83
Gender [f/m] 4/11 12/3 7/1
Height [cm] 175 ± 7 160 ± 8 152 ± 11
Weight [kg] 86.85 ± 12.55 71.87 ± 5.8 64.40 ± 7.98
2.4 Classification 3 RESULTS
For each measurement per exercise and type of fea- Table 2 shows the average cross-validated accuracy of
ture, a SVM classifier is trained. Two different types the classifiers per exercise together with the standard
of SVM classifiers are evaluated, one with a linear and deviation. The three measurements per exercise are
one with a Gaussian radial basis function (rbf) kernel. averaged to produce this accuracy. The highest accu-
KNN classifiers, with k = 3 and k = 4, are also trained racy of 96.49% ± 4.02 is achieved with the rbf SVM
and validated. using the NO exercise and standard deviation of the
Each exercise was performed three times, result- velocity as feature. The difference between features,
ing in three sets of classifiers per exercise per feature exercises and classifiers seems to be statistically irrel-
(a set being 2 SVM and 2 KNN classifiers). evant, but we can see that the standard deviation of the
The data recorded from 39 people containing 16 amplitude performs the worst of the three features.
students, 15 elderly without and 8 elderly with fall Figure 2 illustrates the separability of the training
history, as described in section 2.1.2, is used to train data. The training data of the first linear SVM RO
the classifiers. All classifiers are of the binary variant classifier (RO1) is shown. Each point represents a
(i.e.: they can only distinguish between two classes). participant’s velocity’s standard deviation for the first
Data from students and elderly without fall history RO exercise. The x and y axis represent the velocity
is grouped together and labelled as the ”non-fallers” in the ML and AP directions respectively. The sup-
class, while the elderly with fall history are labelled port vectors are circled and the linear hyperplane is
as the ”fallers” class. visualised.
2.5 Validation 4
No fall history
Fall history
Support Vectors
3.5
Initial validation of the classifiers is done using 10-
fold cross validation, resulting in accuracy scores for 3
each classifier. Classifier and kernel parameters are
then tuned to achieve the highest possible accuracy. It 2.5
is worth noticing that the classifiers are trained with
AP
one measurement per exercise per participant. This 2
prevents multiple measurements of the same person
to be in different folds which would bias the results. 1.5
The validation dataset described in 2.1.2 of 12 ad-
ditional elderly persons is used to validate the trained 1
SVM classifiers. Data from this dataset is automat-
ically labelled by the SVM classifier and confusion 0 0.5 1 1.5 2 2.5 3 3.5 4
ML
matrices are created from the results. This is done for
each exercise separately. The choice to only validate Figure 2: Plot of the SVM training data with support vectors
the SVM classifier is based on the achieved results and linear hyperplane. Exercise: RO1, feature: std. dev.
in combination with the advantages of the SVM as velocity.
compared to the KNN classifier, which are outlined
in secion 4. Figure 3 shows the effect of the length of the mea-
The validation dataset was recorded in a differ- surement on the accuracy of the SVM classifier. Illus-
ent nursing home with no connection between the two trated here is the average accuracy of the RO exercise.
groups of participants. Table 4 shows the confusion matrices of the val-
idation experiment with the validation dataset. As
mentioned in section 2.5, only the linear SVM is
78AutomaticFallRiskEstimationusingtheNintendoWiiBalanceBoard
Table 2: Average cross-validated accuracy [%] of the classifiers for each exercise and feature. [mean ± std.dev.]
Feature Exercise SVM (lin) SVM (rbf) KNN (3) KNN (4)
std. dev. velocity RO 94.87 ± 2.57 92.31 ± 2.57 94.01 ± 3.92 95.72 ± 1.48
RC 94.87 ± 2.57 91.45 ± 3.92 91.40 ± 2.88 93.09 ± 1.54
NO 92.10 ± 2.63 96.49 ± 4.02 92.98 ± 1.52 93.85 ± 3.04
mean velocity RO 95.72 ± 3.92 94.87 ± 2.57 94.01 ± 2.96 94.87 ± 4.45
RC 93.11 ± 1.40 93.97 ± 1.45 91.38 ± 1.42 93.97 ± 1.45
NO 92.98 ± 1.52 94.73 ± 2.63 92.10 ± 0.00 93.85 ± 3.04
std. dev. amplitude RO 86.32 ± 2.96 83.75 ± 3.92 82.05 ± 5.13 84.61 ± 6.78
RC 87.04 ± 2.77 86.19 ± 3.08 88.75 ± 4.13 89.60 ± 4.67
NO 84.30 ± 0.15 86.84 ± 2.62 83.42 ± 6.17 83.54 ± 4.11
Table 3: Average cross-validated accuracy [%] of the classifiers per feature, averaged across the exercises. [mean ± std.dev.]
Feature SVM (lin) SVM (rbf) KNN (3) KNN (4)
std. dev. velocity 93.95 ± 1.60 93.41 ± 2.70 92.80 ± 1.31 94.22 ± 1.35
mean velocity 93.94 ± 1.55 94.52 ± 0.49 92.50 ± 1.36 94.23 ± 0.56
std. dev. amplitude 85.89 ± 1.42 85.59 ± 1.63 84.74 ± 3.54 85.92 ± 3.24
100 Table 4: Confusion matrices of the validation experiment,
each matrix contains the summed results of an exercise. Top
95
to bottom: RO (N = 36), RC (N = 36), NO (N = 31).
90 Prediction
Faller Non-Faller
85
Faller 9 0
Accuracy [%]
Actual value
80 Non-Faller 13 14
75
Faller Non-Faller
70 Faller 7 2
Actual value
Non-Faller 13 14
65
60 Faller Non-Faller
5 10 15 20 25 30 35 40 45
Time [s] Faller 6 0
Actual value
Figure 3: Average cross-validated accuracy of the linear Non-Faller 17 8
SVM classifier plotted against measurement length. The
dotted lines are the upper and lower limits of the standard velocity perform almost equally well as features, with
deviation. Exercise: RO, feature: std. dev. velocity. only a marginal difference between the two. Table 3
shows the accuracy of each classifier averaged across
validated. Each matrix contains the summed results all exercises. The linear SVM performs best with the
of the three measurements per exercise, i.e.: the standard deviation of the velocity as feature, while the
true and false negatives and positives of the mea- SVM with rbf kernel performs best using the mean
surements were added together per exercise. To velocity. The standard deviation of the amplitude
recap, each person performed three different ex- scores the lowest of the three features across all clas-
ercises, where each exercise was executed three sifiers and exercises. The KNN classifiers perform
times. For the RO and RC exercise this results in almost equally well for both the standard deviation
3 measurements x 12 persons = 36 results. The NO of the velocity and the mean velocity. Again, the
confusion matrix contains a total of 31 results. This is standard deviation of the amplitude scores the lowest.
due to the fact that several participants in the valida- In section 2.3 it was hypothesised that our choice of
tion dataset failed to execute this exercise. features would result in a sufficiently high accuracy,
which is confirmed by the results.
The rbf SVM offers the highest average accuracy
when using the NO exercise and standard deviation
4 DISCUSSION of the velocity, but scores lower than the linear SVM
with the other two exercises. The KNN classifier
The standard deviation of the velocity and the mean scores highest with all exercises and features when
79HEALTHINF2015-InternationalConferenceonHealthInformatics
k = 4. While the KNN classifiers score almost equally give that person a false sense of security. The NO
high as compared to the SVM classifiers, the former exercise performs the lesser of the three. Note that
is prone to be the slowest of the two and require more N = 31 because several participants failed to execute
memory when a lot of data points are present since it this exercise. This is because the narrow stance is dif-
is a form of lazy learning (Atkeson et al., 1997). ficult to maintain for elderly adults. The NO exer-
While previous studies such as (Melzer et al., cise was also recorded as the last of the three. While
2010) suggest that the rigid stance is not suited for participants were able to take a short break between
measurements regarding fall related indicators, our exercises, this still introduced a bias in the results.
results show otherwise. As seen in table 2, all three of The high amount of false positives for all three
the exercises result in roughly the same accuracy for exercises is due to the fact that several non-fallers in
each classifier and feature. While the highest aver- the validation dataset had underlying conditions that
age accuracy was achieved with the rbf SVM and NO influence postural balance. Two non-fallers are sys-
exercise, this exercise was also the most difficult to tematically classified as fallers and account for six of
carry out by the elderly participants. The RO exercise the total amount of false positives per exercise. While
is more suited to be carried out while no specialised these people did not fall in the last year, this wrongful
personnel is nearby without a significant loss in accu- classification can be attributed to the fact that they had
racy. hip-prostheses. Excluding these elderly would bring
In figure 2 we can see that the training data is com- the number of false positives down to seven for the
pletely separable by the hyperplane. A cluster of non- RO and RC exercise. After exclusion, the RO exer-
fallers can easily be distinguished in the lower left cise offers the highest accuracy of 76.6%. False posi-
corner, which is an area of low postural sway. This tives may also be attributed to the fact that the average
group contains all 16 student participants. Fallers are age of non-fallers in the validation dataset is higher as
less grouped together and located more towards the compared to the training dataset.
top right corner.
As seen in figure 3, the length of the measurement
has little effect on the cross-validated accuracy of the 5 CONCLUSION AND FUTURE
SVM classifier. It is only below 20 seconds that a WORK
decline in accuracy is observed. This loss of accu-
racy can be explained due to the fact that in a lim- It is possible to accurately distinguish between el-
ited time frame the CoP trajectory might not change derly who have recently experienced falls and non-
enough in order to extract meaningful features. Fur- falling elderly persons using the Nintendo Wii Bal-
thermore, trimming the measurement length was done ance board in conjunction with machine learning al-
by removing an equal amount of data points at the gorithms. Both the SVM and KNN classifier offer
start and end of the measurement. This might explain good performance with our current dataset.
the increase in accuracy at the 20 second mark. We A few points of improvement, however, remain.
found that at the start of the measurements, several Firstly, the recorded dataset is relatively small and
participants exhibited anticipation effects such as in- contains data from a very specific group of people.
creased stiffening of the muscles. In the same manner, With more data, it may be possible to further increase
participants became tired or anxious towards the end. the accuracy of the classifiers and reduce the amount
Trimming these effects can have a positive influence of false positives. Secondly, the algorithm may be ex-
on the accuracy, as long as a minimum measurement tended to detect different pathologies such as Parkin-
time of 20 seconds is kept. The ideal measurement son’s disease. This would also require more data.
time is thus located between 20 and 40 seconds. While a medical diagnosis would still be required, the
The confusion matrices in table 4 show that the tool could be used as a preliminary indicator. Lastly,
SVM model is capable of classifying all fallers with it would be interesting to see if the algorithm can give
the RO exercise. While the RO and RC exercise offer an indication of the severity of the fall risk instead of
the same amount of false positives and true negatives, a binary classification.
the RC exercise has two false negatives as compared Nevertheless, our results indicate that the Nin-
to zero for the RO exercise. A false negative in this tendo Wii Balance board can be a viable and cheap
context weighs more than the false positive. When a alternative to pressure plates for the detection of fall
person without fall risk is classified incorrectly (false risk in elderly persons.
positive), a follow up by a doctor or care giver will
give exclusion, whereas an incorrect classification for
a person with actual fall risk (false negative) might
80AutomaticFallRiskEstimationusingtheNintendoWiiBalanceBoard
ACKNOWLEDGEMENTS derly fallers and non-fallers. Clinical Biomechanics,
25(10):984–988.
This work is funded by the iMinds FallRisk project. Milisen, K., Detroch, E., Bellens, K., Braes, T., Dier-
The iMinds FallRisk project is co-funded by iMinds ickx, K., Smeulders, W., Teughels, S., Dejaeger, E.,
Boonen, S., and Pelemans, W. (2004). Falls among
(Interdisciplinary Institute for Technology), a re- community-dwelling elderly: a pilot study of preva-
search institute founded by the Flemish Government. lence, circumstances and consequences in flanders.
Companies and organisations involved in the project Gerontol Geriatr., 35:15–20.
are COMmeto, Televic Healthcare, TP Vision, Ver- Noury, N., Rumeau, P., Bourke, A., ÓLaighin, and Lundy,
haert and Wit-Gele Kruis Limburg, with project sup- J. (2008). A proposal for the classification and evalu-
port of IWT. ation of fall detectors. Elsevier Masson, 29:340–349.
The authors would furthermore like to thank the Piirtola, M. and Era, P. (2006). Force platform measure-
nursing homes, students and elderly who participated ments as predictors of falls among older people a re-
in this study. view. Gerontology, 52:1–16.
Podsiadlo, D. and Richardson, S. (1991). The timed ”up &
go”: a test of basic functional mobility for frail elderly
persons. Journal of the American Geriatrics Society,
REFERENCES 39(2):142–148.
Robertson, M. and Gillespie, L. (2013). Fall prevention
Atkeson, C., Moore, A., and Schaal, S. (1997). Lo- in community-dwelling older adults. Journal of the
cally weighted learning. Artificial Intelligence Re- American Medical Association, 309(13):1406–1407.
view, 11:11–73. Salavati, M., Hadian, M., Mazaheri, M., Negahban, H.,
Ebrahimi, I., Talebian, S., Jafari, A., Sanjari, M., So-
Berg, K., Wood-Dauphinée, S., Williams, J., and Gayton,
hani, S., and Parnianpour, M. (2009). Testretest re-
D. (1989). Measuring balance in the elderly: prelim-
liabty of center of pressure measures of postural sta-
inary development of an instrument. Physiotherapy
bility during quiet standing in a group with muscu-
Canada, 41(6):304–311.
loskeletal disorders consisting of low back pain, ante-
Brindza, J., Szweda, J., Liao, Q., Jiang, Y., and Striegel, A. rior cruciate ligament injury and functional ankle in-
(2009). Wiilab: Bringing together the nintendo wi- stability. Gait & Posture, 29:460–64.
imote and matlab. In Frontiers in Education Confer-
Tinetti, M. (2003). Preventing falls in elderly persons. The
ence (FIE). IEEE.
New England Journal Of Medicine, 348:42–49.
Duncan, P., Studenski, S., Chandler, J., and Prescott, B. Tinetti, M. and Williams, C. (1998). The effect of
(1992). Functional reach: Predictive validity in a sam- falls and fall injuries on functioning in community-
ple of elderly male veterans. The Journals of Geron- dwelling older persons. The Journals of Gerontology,
tology, 47(3):93–98. 53(2):112–119.
Gardner, M., Buchner, D., Robertson, M., and Campbell, A. Tinetti, M., Williams, T., and Mayewski, R. (1986). Fall risk
(2001). Practical implementation of an exercise-based index for elderly patients based on number of chronic
falls prevention programme. Age Ageing, 30:77–83. disabilities. The American Journal of Medicine,
Guralnik, J., Ferrucci, L., Simonsick, E., Salive, M., and 80(3):429–434.
Wallace, R. (1995). Lower-extremity function in per-
sons over the age of 70 years as a predictor of sub-
sequent disability. The New England Journal Of
Medicine, 332(9):556–562.
Horak, F. B., Wrisley, D. M., and & Frank, J. (2009). The
balance evaluation systems test (bestest) to differen-
tiate balance deficits. Physical Therapy, 89(5):484–
498.
Large, J., Gan, N., Basic, D., and Jennings, N. (2006). Us-
ing the timed up and go test to stratify elderly inpa-
tients at risk of falls. Clinical Rehabilitation, 20:421–
428.
Martin, F. (2011). Falls risk factors: Assessment and man-
agement to prevent falls and fractures. Canadian Jour-
nal on Aging, 30(1):33–44.
Melzer, I., Benjuya, N., and Kaplanski, J. (2004). Postural
stability in the elderly: a comparison between fallers
and non-fallers. British Geriatrics Society, 33(6):602–
607.
Melzer, I., Kurz, I., and Oddsson, L. I. (2010). A retro-
spective analysis of balance control parameters in el-
81You can also read