B1: Pricing Management Information in the London Market - Matthew Evans Insight Risk Consulting - Institute and Faculty of Actuaries
←
→
Page content transcription
If your browser does not render page correctly, please read the page content below
B1: Pricing Management
Information in the London Market
Matthew Evans
Insight Risk Consulting

06 June 2016
Pricing MI in the London Market
Using pricing data to improve
underwriting decision-making and
profitability

06 June 2016
Agenda
• Problems and excuses
• A poor first effort
• Some glimmers of hope
• New MI platforms
• What makes pricing MI useful?
• Questions and Comments
• References

06 June 2016                      3
Problems and excuses
• A lack of data
                             Statistical
• Heterogeneous risks

• Operational overheads
                             Practical
• Market practice

• IT & development expense   Financial

06 June 2016                               4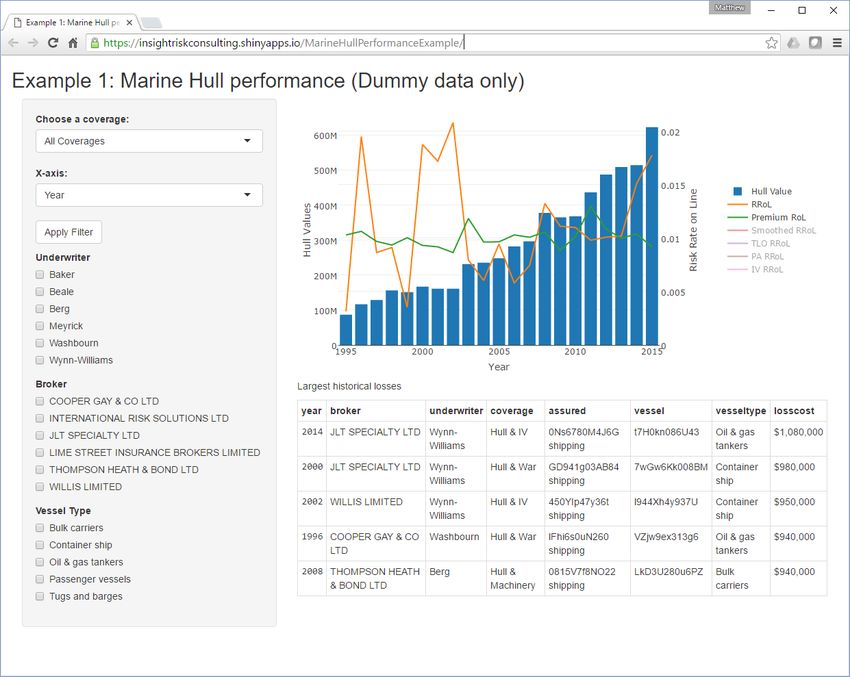
A poor first effort
• MI used by underwriters to assess class performance
               1        2         3         4         5         6         7          8          9          10
   1               7%       22%       33%       43%       53%       64%        67%        69%        74%         75%
   2               7%       24%       41%       64%       72%       79%        89%        94%       102%
   3               7%       31%       53%       77%       95%       98%       110%       117%
   4               7%       32%       49%       84%       90%       98%       102%
                                                                                                                Is there a
   5               5%       13%       25%       34%       40%       45%
                                                                                                                  graph?
   6               6%       21%       34%       47%       58%
   7               6%       19%       35%       51%
   8               6%       24%       49%                                        Do we get this
   9               8%       28%                                                  by sub-class?
   10              8%
                                                                                                           Do we get this
• All too often, not even the easy stuff is done...                                                         by Broker?

• MI lacks granularity and only informs long after the horse
  has bolted.
06 June 2016                                                                                                                 5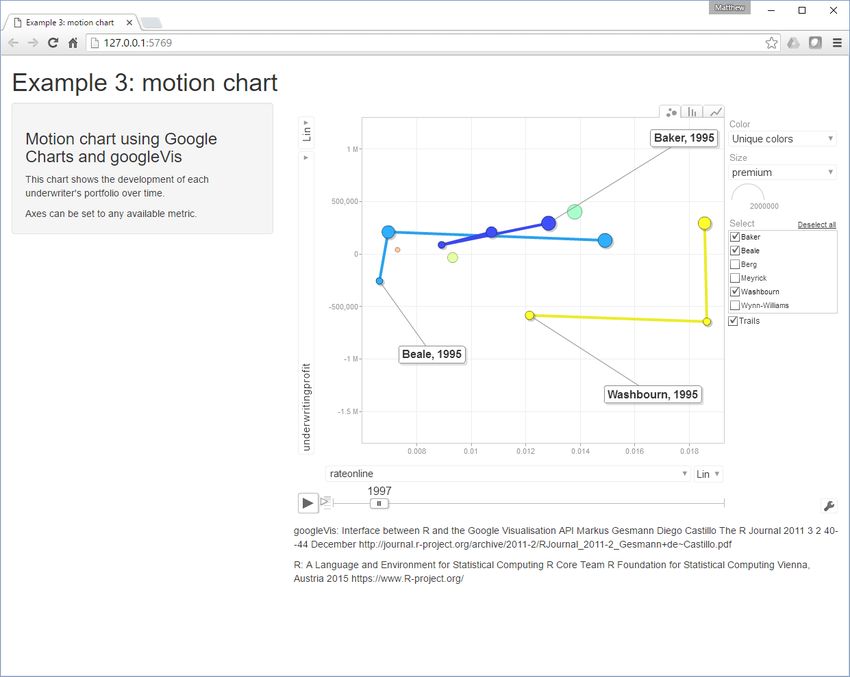
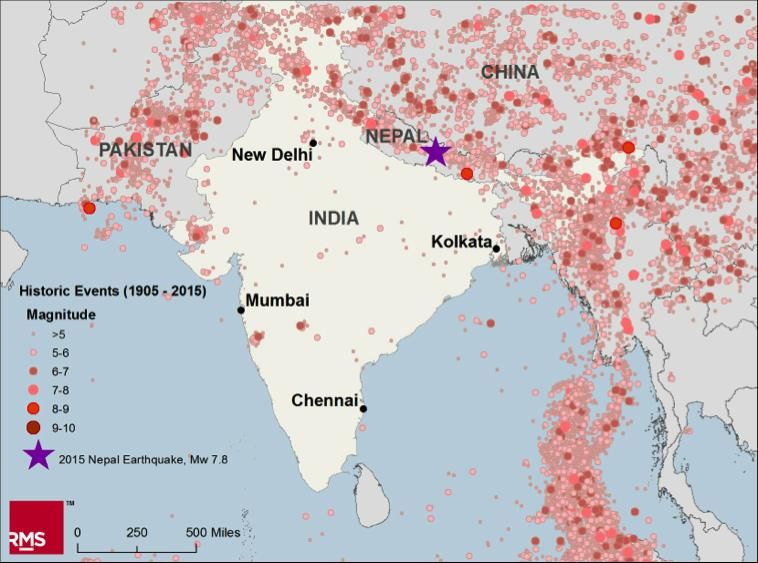
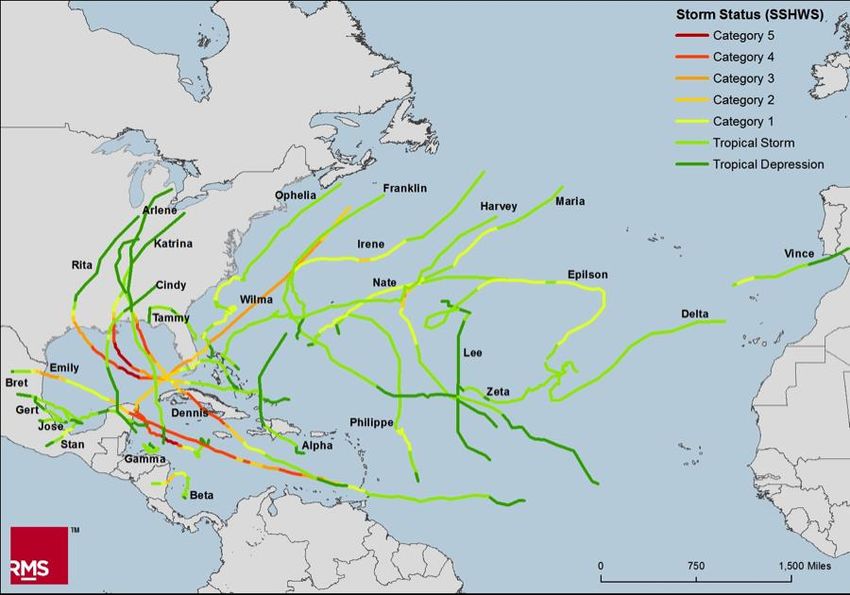
Some glimmers of hope
• Exposure modelling is more developed for nat cat

• Sophisticated MI is
  available when a
  business case can be
  made

• Graphics: RMS

06 June 2016                                         6
New MI platforms
• Excel-based solutions not robust or scalable
• In-house development can be expensive
• New online platforms have emerged to bridge the gap:
     – R/Shiny, Plotly and Google Charts
     – Tableau
     – Microsoft Power BI
                                       Practical   Financial

06 June 2016                                                   7
New platforms: R & Shiny • Open source stats package R talks to excel and databases • Online graphics package Shiny allows R graphics to be deployed using a web browser • Combination offers a cost-effective way of getting actuarial work out into the business without reliance on internal IT. 06 June 2016 8
New platforms: R/Shiny & Plotly
• Plotly charts running
  in Shiny
• Charts are interactive,
  allowing underwriters
  controlled access to
  data

         Practical
               Statistical

•   Dummy Marine data
    shown here uses actual
    underwriter and broker
    names but is randomly
    generated.

06 June 2016                      9
New platforms: R/Shiny & Plotly • Plotly charts running in Shiny • Charts are interactive, allowing underwriters controlled access to data • Dummy underwriting data shown here. 06 June 2016 10
New platforms: R/Shiny & Google Charts
• Animated bubble
chart from Google
Charts in Shiny
• Popularised by Hans
Rosling from WHO
• Used by Lloyd’s to
show development
over time.
• Dummy Marine data
shown here uses actual
underwriter and broker
names but is randomly
generated.
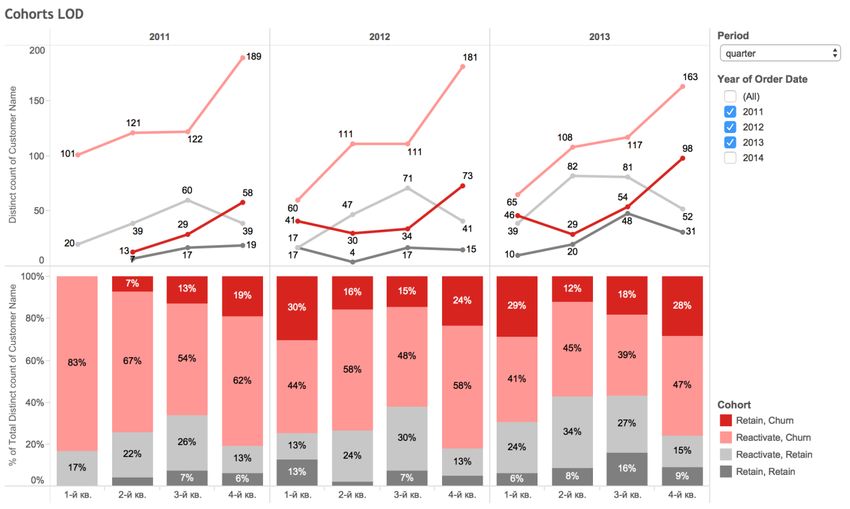
06 June 2016 11New platforms: Tableau
• Tableau is a package
option
• Interactive
dashboards
• Connectivity to
various data sources
• Tableau example shown
here.
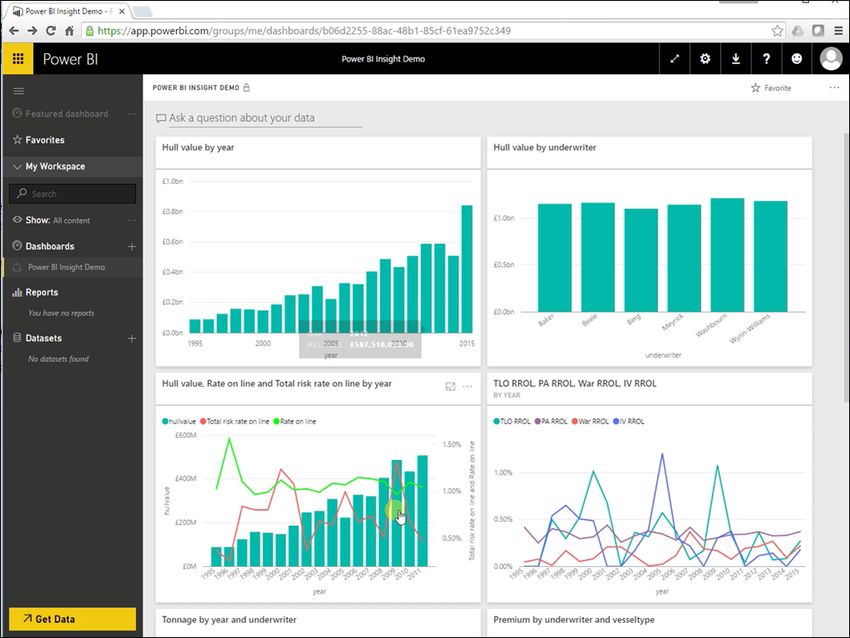
06 June 2016 12New platforms: Microsoft Power BI
• Microsoft Power BI
has excellent
integration with
standard tools
• Similar interactive
dashboards and data
visualisation
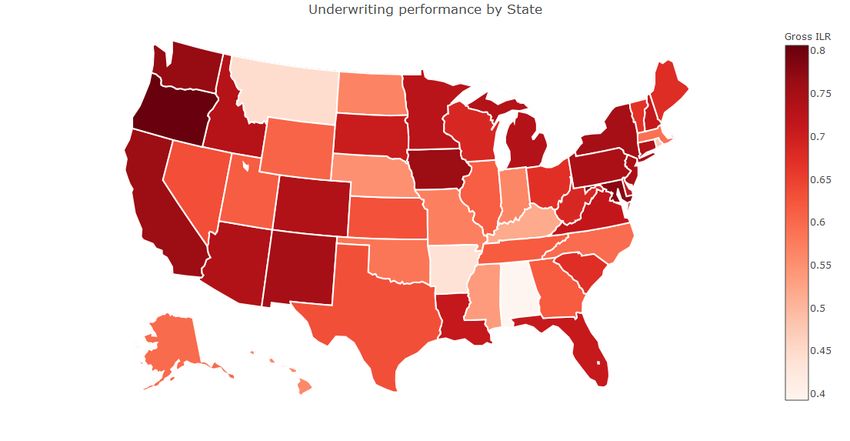
• Dummy Marine data
shown here uses actual
underwriter and broker
names but is randomly
generated.
06 June 2016 13What makes pricing MI useful?
• For analytics to be most useful to underwriters they must be
presented in underwriting terms:
– Show risk rates on line
Statistical
– Show results by rating factor
– Show results by segment
– Record exposure
Practical
– Benchmark risks
• By matching the underwriter’s own rating process, pricing model data
can feed directly into improved insight
• Loss ratios aren’t enough on their own, nor Achieved to Technical.
06 June 2016 14What makes pricing MI useful?
• With full underwriter engagement a virtuous circle emerges...
More UW
Better MI
engagement
Better Models Better Data
• Circle feeds improved underwriting decision-making and
profitability.
06 June 2016 15Questions Comments Expressions of individual views by members of the Institute and Faculty of Actuaries and its staff are encouraged. The views expressed in this presentation are those of the presenter. 06 June 2016 16
References
• Matthew Evans   www.insightriskconsulting.co.uk

• Hans Rosling    https://www.ted.com/talks/hans_rosling_at_state

• R Shiny         http://shiny.rstudio.com/
• Plotly          https://plot.ly/
• Tableau         http://www.tableau.com/
• Google Charts   https://developers.google.com/chart/
• MS Power BI     https://powerbi.microsoft.com/en-us/

06 June 2016                                                        17
You can also read