Bay of Plenty PHYSICAL ACTIVITY INSIGHTS - Sport BOP
←
→
Page content transcription
If your browser does not render page correctly, please read the page content below
Bay of Plenty PHYSICAL ACTIVITY INSIGHTS
Contents
                                                            The benefits of physical activity           1
                                                            Understanding the landscape                 2
                                                            Our communities                             3
                                                            Participation by ethnicity                  7
                                                            Young people and physical activity          9
                                                            Adults and physical activity               14
                                                            Older people (65+) and physical activity   20
                                                            Deprivation and physical activity          22
                                                            References                                 25

Data note
Sport NZ, Active NZ 2019 and Census data 2018 are
primarily used throughout this document to provide
the best representation of populations, attitudes and
activities. Where possible, regional data is used, except
when sample sizes are not a sufficient representation. In
this case, national data has been used and indicated. For
all full references, please refer to the final page.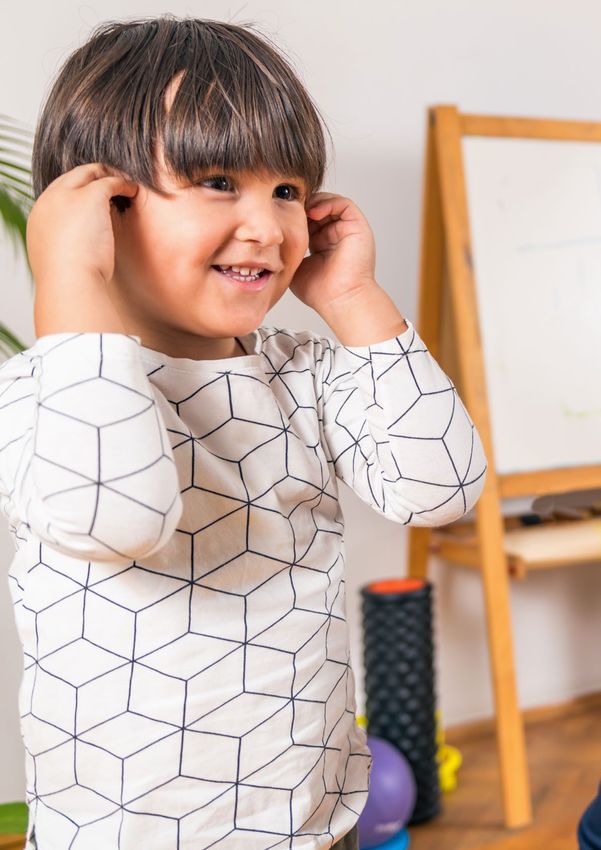
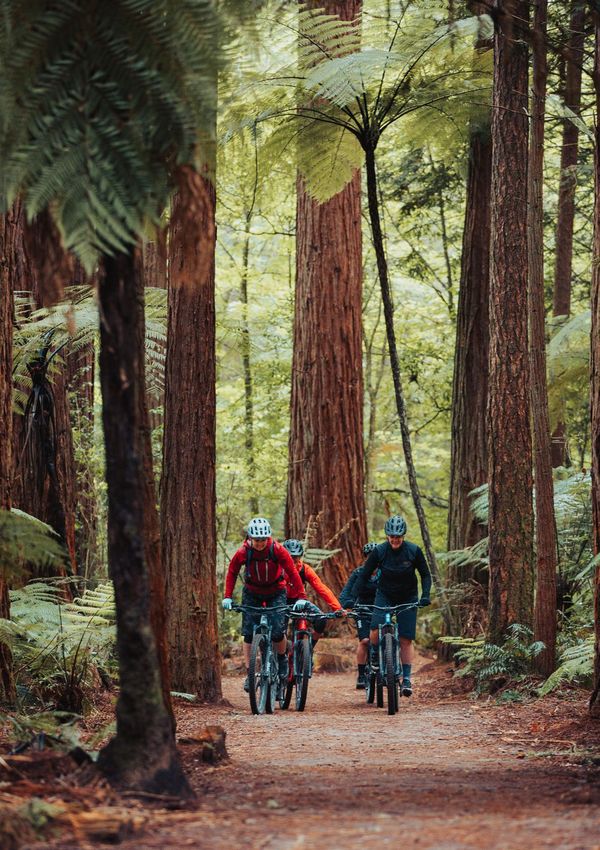
The benefits of physical activity
                  Being physically active improves physical and
                  mental health, quality of life, individual wellbeing
                  and connection.

                                    Physical inactivity can lead to poor health, a rise in health costs, loss of
                                    productivity and negative wellbeing impacts for individuals and families.
                                    Physical activity, including play, active recreation and sport, is therefore
                                    vital to our region’s social and economic recovery from the COVID-19
                                    pandemic.

Purpose of this document
This document provides high-level insights into target communities across
the Bay of Plenty region (BOP). Information has been pulled from a variety of
national and regional sources. These insights aim to support the delivery and
development of more active communities.

This document includes:

• Information about our region and New Zealand landscape
• Physical activity summaries for young people and adults
• Community insights:

Young people       Adults          Older people      Deprivation       Ethnicity        Attitudes     Activities

                                                                                                                   1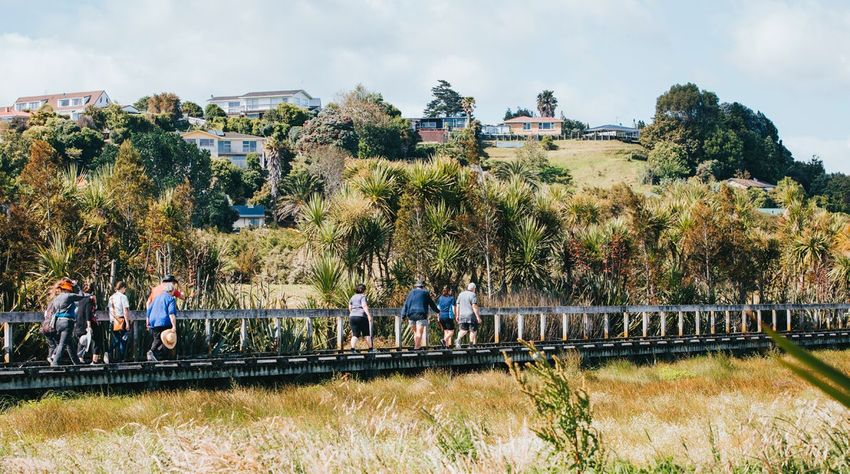
Understanding the landscape

                  Inactivity has increased across New Zealand
                  in the past 15 years.1

    BOP    NZ
                  The BOP’s young people and adults have
                  physical activity levels similar to the national
                  average.2

                  Inactivity is the fourth biggest risk for non-
                  communicable diseases i.e. stroke, diabetes,
                  most cancers, heart disease.3
                  In 2016, 32% of adults (57,000) and 8.6% of
                  young people (4,000) in the BOP are obese.5

           $$
                  Physical inactivity continues to cost New
                  Zealand upwards of $1.3 billion every year.4

2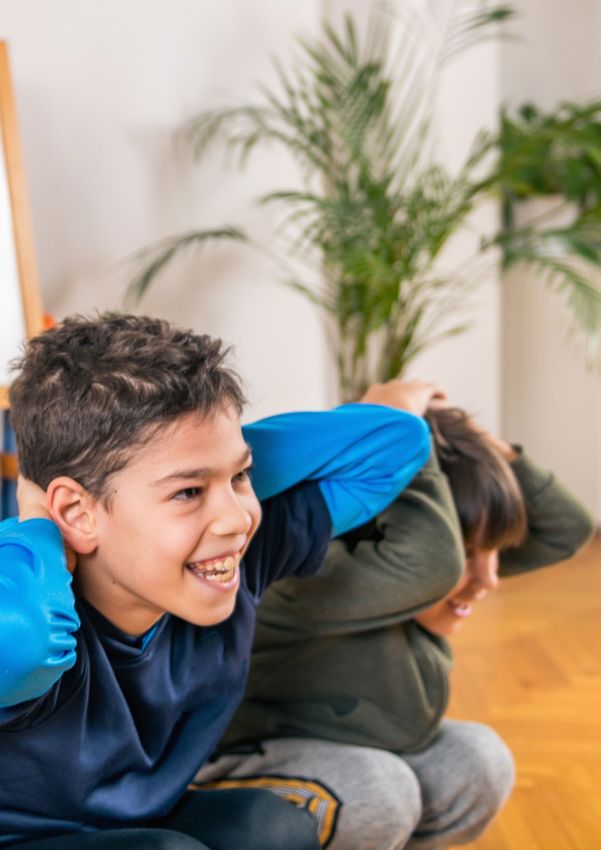
Our communities
                               Percentage of BOP population in
                               each of the six districts 6

     44%
     Tauranga City

                                     Bay of Plenty

17%
Western BOP

   Waikato

                                                                2%
                                                                Ōpōtiki

   23%
    Rotorua
                                                     Gisborne

                                               11%
                     3%         Hawke’s Bay
                                                Whakatāne
                     Kawerau

                                                                          3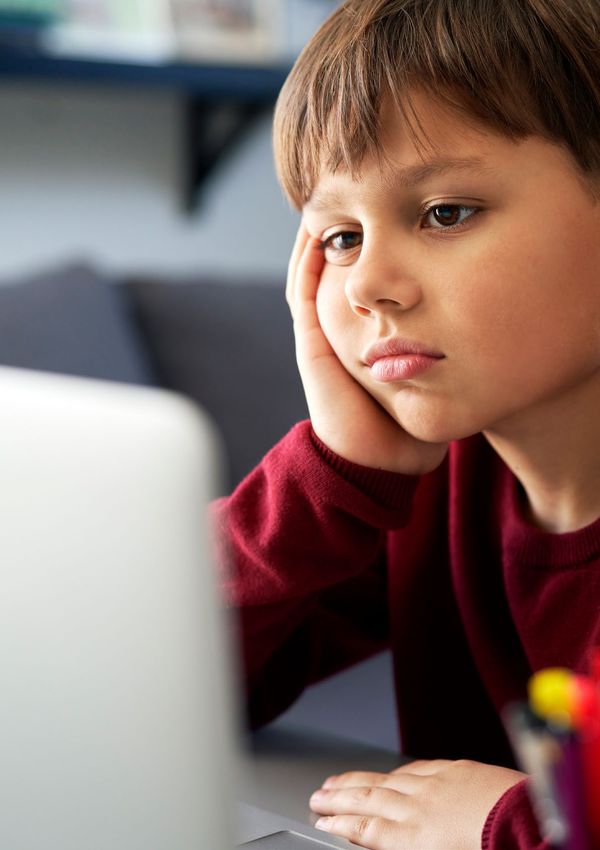
Population breakdown by age 6

    BOP population breakdown by age6
    Total BOP population (2020 Census projections): 337,350

      Young people                                                                                                      Adults
       88,470                                                                                                          248,880
                     21,300

                               23,050

                                        23,600

                                                 20,520

                                                            38,950

                                                                     41,800

                                                                              62,130

                                                                                          42,530

                                                                                                    48,210

                     0-5       5-9      10-14    15-19     20-29     30-39    40-54    55-64       65-79
                                                                                                              15,260
                                                                                                              80+

        The Bay of Plenty had the highest population growth out of all regions in 2019-20.6

    Mean ages in the BOP region6

       40.1                   34.8                        40.4                  37.8                         34.1           47.6
        years                  years                      years                   years                       years          years

      Tauranga                Rotorua               Whakatāne                  Kawerau                       Ōpōtiki     Western Bay
                                                                                                                          of Plenty

4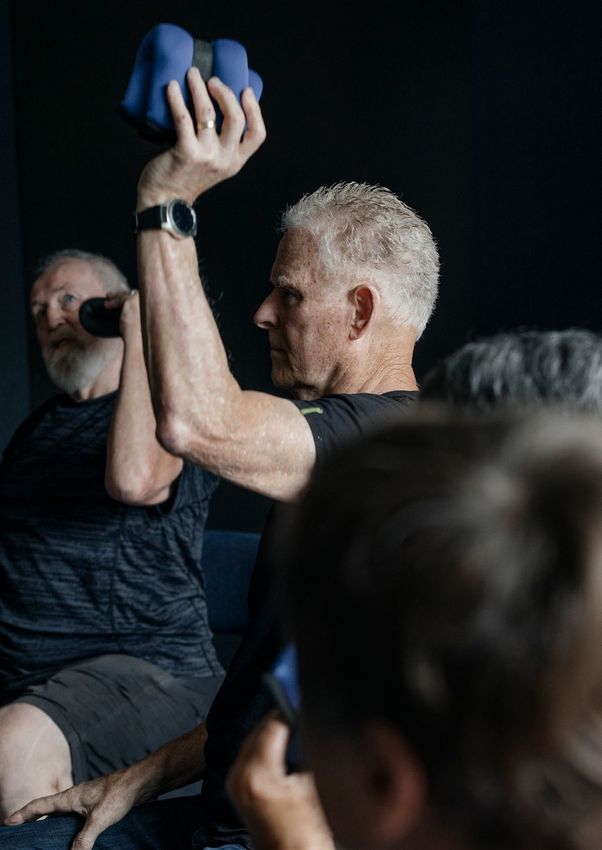
Population breakdown by ethnicity 6

National population breakdown by ethnicity
*Percentages exceed 100% due to individuals identifying with one or more ethnicities.

100%

75%

50%

25%

0%

              70%             16%             15%              8%             2%                1%
            NZ European        Māori           Asian          Pasifika    Middle Eastern/   Other Ethnicity
                                                                          Latin American/
                                                                              African

Bay of Plenty population breakdown by ethnicity
The Bay of Plenty has a significantly higher population of Māori compared to the national average.
*Figures are rounded

100%

75%

50%

25%

0%

              74%             29%              7%              4%            0.7%               1%
            NZ European        Māori           Asian          Pasifika    Middle Eastern/   Other Ethnicity
                                                                          Latin American/
                                                                              African

                                                                                                              5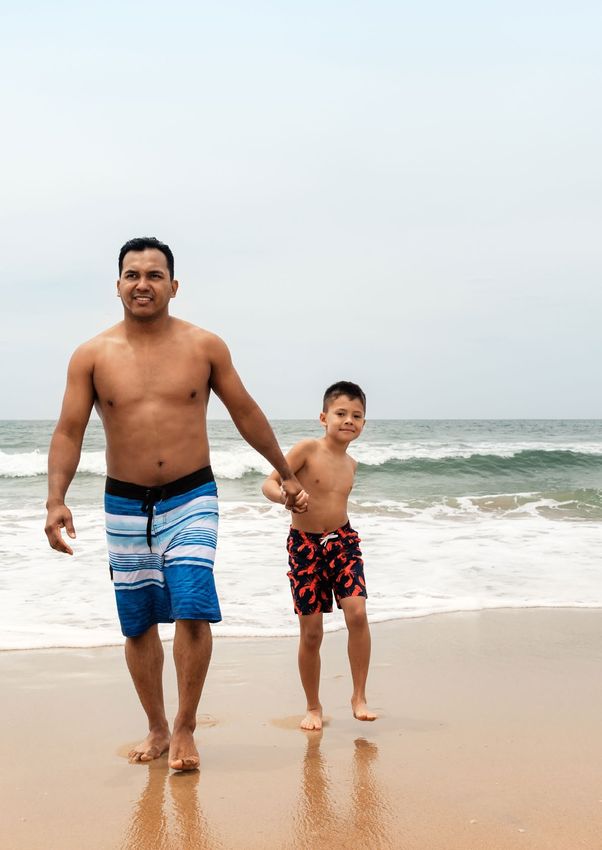
6
Participation by ethnicity
                 The Bay of Plenty has an ethnically diverse population - some areas
                 in our region have a higher density of ethnicities than other regions
                 throughout New Zealand.

    There are differences in physical activity levels
    based on ethnic backgrounds. Working with diverse
    populations means we may have to tailor activities
    to align with cultural beliefs and preferences.

Adult activity levels by ethnicity2

                                                                  Bay of Plenty adult
                  National adult activity levels by               activity levels by
MINUTES

                  ethnicity (average per week)                    ethnicity (average
                                                                  per week)
          100%

150+

          75%                            47%          46%
                                 56%                                             57%
                     62%                                             63%

          50%
30-                                                   15%
149                                      17%
                                 8%                                              8%
                      9%                                             8%
          25%

                                 36%     36%          39%                        35%
Ethnic distribution throughout the
Bay of Plenty (2018)6
*Percentages exceed 100% due to individuals identifying with one or more ethnicities.
Ethnicity WBOP Tauranga Rotorua Whakatāne Kawerau Ōpōtiki
NZ European 81% 81% 62% 62% 50% 50%
Māori 19% 17% 38% 46% 60% 63%
Pasifika 2% 2% 4% 2% 3% 3%
Asian 6% 7% 9% 3% 3% 2%
Bay of Plenty
Tauranga
City
Western
BOP
Waikato
Ōpōtiki
Rotorua Gisborne
Hawke’s Bay
Whakatāne
Kawerau
8Summary Young people
& physical activity
Sit less, move more, sleep well
Ministry of Health physical activity guidelines for young people 7
An accumulation of at least 60 Incorporate physical activities that
minutes of moderate to vigorous help strengthen muscles and bones
physical activity every day at least three times a week.
The information presented in this section is from national data.
Activity levels of young people over 12 months2
6% 68%
inactive (Top five activities for young people2
Tamariki (5-11)
53%
51% (both)
41%
4 Cycling 38%
Running, jogging
or cross country
5
Playing on play- Games (four square,
33%
1
ground/ Playing tag, dodgeball etc.)
2
Swimming
(running around,
climbing trees, make
3
believe)
*Of the 3,000 tamariki and
Rangatahi (12-17) 1,800 rangatahi surveyed nationally
61%
36%
35%
4 Cycling 27%
Running, jogging
Games (four square, or cross country
5
Workout
26%
1
tag, dodgeball etc.) (weights/cardio)
Walking for fitness
2
3
10Time young people spend participating 2
Time young people spent being active over the past 7 days
100%
420+
75% 47%
60% 58% 64%
MINUTES
50%
419-
150 30%
23% 27%
25%
149- 26%
30 12%
10%
10% 6%Attitudes and barriers for young people 2
While the majority of young people claim to have been active in
the last seven days, only 1 in 4 young people are meeting physical
activity guidelines over a year.
In order to help our young people sit less and move more we need to
understand their attitudes, perceived barriers and motivations.
Creating quality and positive physical
activity experiences at a young age will
increase the likelihood or sustaining good
physical activity levels for life.
Top 5 barriers for young people not Top 5 barriers for young
wanting to do more (ages 8-17) people wanting to do more
Aside from the top response of ‘I already do a good
(ages 8-17)
amount’, these are the top five barriers to participation for
young people who don’t want to do more.
10% 15%
11% 32% 15% 43%
19%
20%
23%
20%
Too busy Too tired/ don’t have the energy Not interested in sport
or physical activity
I prefer to do other things No places nearby to do what I want
Too hard to motivate myself My family can’t afford it
12Too busy
How can physical activity
be incorporated into
existing activities?
Young people rank school
work as the top activity that
keeps them busy, followed by
spending time with friends/
family, electronic games and
reading.
13Summary Adults
and physical activity
Ministry of Health physical activity guidelines for adults 7
At least 150 minutes For added health benefits, aim for 5 hours
of moderate; or 75 of moderate or 2 ½ hours of vigorous
minutes of vigorous physical activity spread throughout the
physical activity spread week, incorporating muscle-strengthening
throughout the week. activities on at least 2 days.
The information presented in this section is from Bay of Plenty data.
Activity levels of BOP adults over 12 months2
27% inactive
23% Meet guidelines
(150+ minutes per week and intensity required)
(no activity)
6% Not very active 44% Could do more
(Time BOP adults spend participating 2
Time adults spent being active over the past 7 days
100%
28% 23%
420+ 31% 33% 36% 39%
75%
25%
MINUTES
27% 28% 38%
50% 28% 21% 7%
419-
150 9% 10%
14% 9% 7%
25%
149- 45%
30 32% 30%
25% 26% 29%Top five activities for BOP adults2
On average BOP adults
Ages 18-64 participate in 2.4 activities
per week.
Walking
4 Swimming / Gardening /
Playing games with kids
Running or jogging
1
Individual workout
using equipment
5
2
Cycling
3
**The percentages
Where are adults active? 2 contained within this
graph exceed 100% due
to individuals selecting
multiple locations
Bay of Plenty adults make use of the region’s
abundant outdoor spaces and facilities.
Locations where Bay of Plenty adults are active
50%
50%
40% 46% 45%
30%
30%
20%
10%
0%
5%
Outdoor locations Outdoor facilities At home Indoor facilities Other
(beach, lake, river, sea, (footpath, cycleway, (gym, marae, church,
bush, off-road bike/ playground, park, field, indoor pool, community
walking track) outdoor pool, AstroTurf) hall)
16Do we pay for physical activity?2
37% only 4% have 32% have
participate in free only participated participated in a
physical activities in paid physical mixture of paid and free
activities physical activities
39% Older adults (65+) are much more likely to only
participate in free physical activities
*Percentages do not add to 100% as it excludes non-participants
17Attitudes, barriers & motivations for adults 2
The majority of Bay of Plenty adults are
Barriers not meeting physical activity guidelines.
However, 75% of people surveyed indicate
they would like to do more exercise.
Understanding attitudes, motivations and barriers for
adults will enable us to better support our community
and help people be more physically active.
Top 10 barriers for BOP adults
59% Other commitments taking priority
22% I am too tired 21% I struggle to 18% I prefer to
or don’t have the energy spend my time on other
motivate myself
interests
17% I already do a 16% I have got out 13% I am not fit
good amount of physical of the habit enough
activity
12% The weather 12% The activity 10% The activity of
of my choice is too my choice doesn’t fit my
expensive routine
Pasifika females in the Bay of
Plenty are more likely to face
more barriers compared to
any other group.
18Quality experiences and a sense of
Motivations belonging are important for ongoing
participation.
Understanding the motivations of Bay of Plenty adults can help inform and
influence decisions within sport, active recreation and play systems.
Top 5 motivations for BOP adults 10
1. Physical 2. To spend 3. For emotional 4. For fun 5. To lose or
wellbeing (fitness time with family wellbeing (unwind, maintain weight or
or health) and friends relax) look good
83% of BOP
adults are active for physical
and emotional wellbeing
37%
of BOP adults are
physically active
for social wellbeing
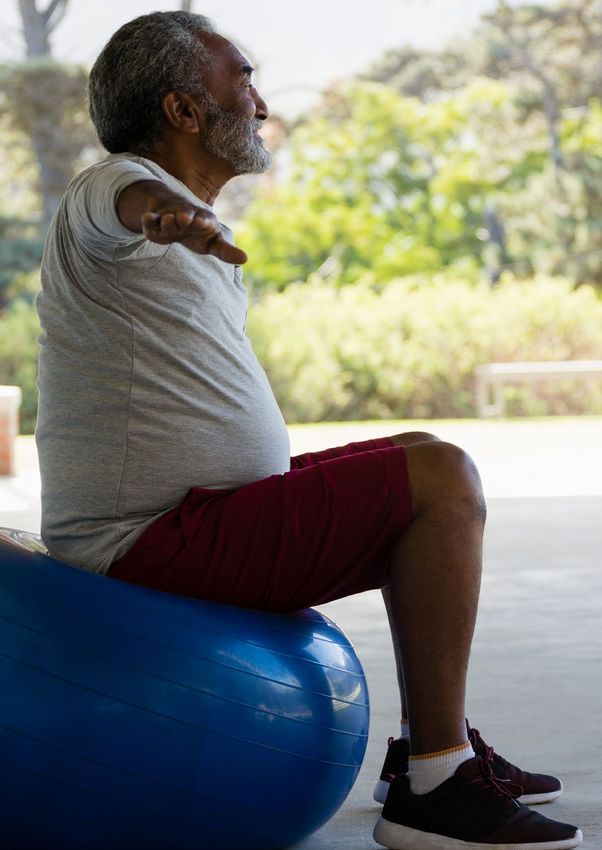
Activity interests for the least active adults (Summary Older people
(65+) and physical activity
Remaining active in older years helps prevent falls and
maintain good overall health and wellbeing.11 However,
in later years we see a significant drop-off in physical
activity.
Top five activities for older people 2
Walking 4 Swimming
1
Gardening Individual workout
5
using equipment
2
Cycling
3
49% 28% 49%
are not interested
of 65+ year olds are meeting the
are not interested recommendation for in doing more
physical activity
in trying any new muscle strengthening
activities in the next each week, and 20%
12 months for aerobic physical
activity
2021
Summary Deprivation and
     physical activity
                        Physical activity is an effective and positive way to
                        improve health5. However, not everyone has the same
                        opportunities to participate.

     Social, cultural and economic factors heavily influence health,
     and higher income can improve access, opportunities and
     overall wellbeing.

     Understanding the NZ Deprivation Index                                          School deciles
     The New Zealand Deprivation Index (NZDep) is based on nine                      The school decile scale is opposite to
     Census variables. NZDep is a relative measurement for areas,                    the NZDep scale:
     not people. 8                                                                   Decile 1 = high deprivation school/
     1= Least deprived/ Low deprivation                                              highest proportion of students from
     10= Most deprived/ High deprivation                                             low socio-economic communities
                                                                                     Decile 10 = low deprivation school/
     The Bay of Plenty has a higher than average level of deprivation                lowest proportion of students from
     and the most deprived are over-represented.                                     low socio-economic communities

     Comparing average BOP adult to most deprived 2
                                                                     BOP average          Adults High Dep (8-10)

      Inactive in the past 12 months                                     3%                          5%

      Participated in PA in past 7 days                                  73%                         67%

      Average no. of activities tried in past 12 months                  5.8                          5.4

      Average no. activities participated in last week                   2.4                          2.2

      Average hours PA per week                                     5.5 hours/week             5.1 hours/week

      150+ mins + intensity required per week                            23%                         16%

     Adults living in high deprivation areas have lower physical activity levels than the average BOP adult.8

22
Areas in the Bay of Plenty region with
highest averages of deprivation 6
Western Bay of Central Bay of Eastern Bay of
Plenty Plenty Plenty
• Matakana Island (9) • Ngongotaha Valley (8) • Galatea (10)
• Judea (8) • Ngongotaha East (8) • Waingarara-Waimana (10)
• Tauranga Hospital (9) • Rotoiti-Rotoehu (8) • Wainui (10)
• Gate Pa (9) • Holdens Bay-Rotokawa (9) • Whakatane West (10)
• Greerton South (9) • Owhata West (9) • Trident (10)
• Te Puke West (9) • Ngapuna (10) • Allandale (9)
• Te Puke East (8) • Fenton Park (9) • Whakatane Central (9)
• Greerton North (8) • Rotorua Central (9) • Waiotahi (8)
• Yatton Park (10) • Kuirau (10) • Oponae (10)
• Poike (8) • Koutu (10) • Ōpōtiki (10)
• Matapihi (9) • Glenholme North (10) • Otara-Tirohanga (9)
• Te Maunga North (8) • Victoria (10) • Cape Runaway (10)
• Baypark-Kairua (10) • Mangakakahi Central (9) • Te Teko Lakes (10)
• Maketu (9) • Mangakakahi West (10) • Monika Reserve (9)
• Western Heights (10)
• Selwyn Heights (10)
• Hillcrest (9)
• Utuhina (8)
• Fordlands (10)
• Pukehangi North (10)
• Pleasant Heights (10)
• Tarawera Park (10)
23Households in the Bay of Plenty region
The median household income in the Bay of Plenty is $66,600.6
25% $107,000 9% $31,800
Couple with Children Single Parent
23% $26,600
One person household
29% $73,700
Couple Only
Median Income/ 14% $83,600
Household Composition Other
Changes in income can have the largest influence on health
JOB
4.1% 25%
of adults in the BOP are of young people in NZ live in
unemployed6 relative poverty9
More than half the children in the BOP live in the most deprived areas 5,9
100%
1,710 2,020
80%
6,350
60%
26,150
40% 12,440
3,630
20%
0%
Tauranga Western BOP Whakatāne Kawerau Ōpōtiki BOP total
24References
1. Ministry of Health. 2019. Annual Data Explorer 2018/19: New Zealand Health Survey. www.minhealthnz.
shinyapps.io/nz-health-survey-2018-19-annual-data-explorer/_w_9d09e8c2/#!/home
2. Sport New Zealand. 2019. Active NZ survey 2019. www.sportnz.org.nz/resources/active-nz-survey-2019/
3. Sport New Zealand. The value of sport. 2017. www.sportnz.org.nz/resources/the-value-of-sport/
4. The costs of physical inactivity: Toward a regional full-cost accounting perspective. 2010. www.
waikatoregion.govt.nz/assets/PageFiles/25488/The_Costs_of_Physical_Inactivity.PDF
5. Bay of Plenty District Health Board. 2016. Bay of Plenty Health & Service Profile. www.bopdhb.govt.nz/
media/60565/health-and-service-profile-2016.pdf
6. Stats NZ. 2018. Census. www.stats.govt.nz/2018-census/
7. Ministry of Health. 2021. Physical activity. www.health.govt.nz/our-work/preventative-health-wellness/
physical-activity
8. Environmental Health Indicators New Zealand (EHINZ). Socioeconomic deprivation profile. www.ehinz.
ac.nz/indicators/population-vulnerability/socioeconomic-deprivation-profile/
9. Stats NZ. 2018/2019. Child Povery statistics: Technical appendix 2018/19. www.stats.govt.nz/methods/
child-poverty-statistics-technical-appendix-2018-19
10. Sport New Zealand. 2018. Active NZ survey 2018. www.sportnz.org.nz/resources/active-nz-survey-2018/
11. Ministry of Health. 2013. Physical Activity for Older People. www.health.govt.nz/system/files/
documents/publications/physical-activity-for-older-people-factsheet-v2.pdf
Notes
25sportbop.co.nz
You can also read