Verification of Material Parameters of Earthen Dams at Diamond Valley Lake Using Geodetic Measurements
←
→
Page content transcription
If your browser does not render page correctly, please read the page content below
Verification of Material Parameters of Earthen Dams at Diamond Valley
                   Lake Using Geodetic Measurements

      Dr. Anna SZOSTAK-CHRZANOWSKI, Michel MASSIERA, Dr. Adam
   CHRZANOWSKI and Fabien LE HOAN, Canada and Cecilia WHITAKER, USA

Key words: Deformation modelling, earth dam, geotechnical parameters.

ABSTRACT

Safety of earth dams depends on the proper design, construction, and monitoring of actual
behaviour during the construction and during the operation of the structure. Deformation
monitoring of large dams and their surroundings supplies information on the behaviour of the
structure and its interaction with the bedrock. Monitoring results may also be used in
verifying design parameters where the geotechnical parameters are of the highest importance.
The determination of geotechnical parameters may be done in situ or in the laboratory. In
laboratory testing, the selected samples may differ from one location to another, they may be
disturbed during the collection, or the laboratory loading conditions may differ from natural
conditions. Therefore, the comparison of the monitored data with the predicted data, obtained
during the design, may give important information concerning the quality of the accepted
geotechnical parameters. This paper presents a method, using finite element analysis, for
modeling effects of saturation of the dam materials in order to determine expected
displacements during the reservoir filling.

Two large earthen dams of the recently built Diamond Valley Lake (DVL), the largest water
storage reservoir in South California, have been used as an example in verifying geotechnical
parameters through a comparison of modelled and observed displacements. The DVL
reservoir, constructed by Metropolitan Water District (MWD) of Southern California, is
located about 160 km south-east of Los Angeles. It has been created by enclosing the
Domenigoni/Diamond valleys by three large earth/rock filled dams.
This largest in the United States earthfill dam project consists of:
•West Dam, about 85 m high and 2.7 km long, volume 49.7 106 m3,
•East Dam, about 55 m high and 3.2 km long, volume 32.9 106m3, and
•Saddle Dam, about 40 m high and 0.7 km long, volume 1.9 106 m3.
Construction of the dams was finished in 1999 and filling of the reservoir started in
December 1999. At the time of writing this paper (January 2002) the reservoir, of a capacity
of almost one billion cubic metres, has been 67% filled. It is estimated that filling will be
completed in 2-3 more years

In October 2000 a fully automated system with a capability of the continuous monitoring of
the behaviour of the dams was implemented. The automated system consists of 8 robotic total
stations (Leica TCA1800S) with the automatic target recognition and electronic
measurements of angles and distances. In addition, 5 continuously working GPS receivers,

TS6.4 Deformation Measurement and Analysis II                                                   1/13
Szoztak-Chrzanowski, Anna, Michel Massiera, Adam Chrzanowski, Fabien Le Hoan, Cecilia Whitaker
Verification of Design Parameters of Earthen Dams at Diamond Valley Lake Using Geodetic Measurements

FIG XXII International Congress
Washington, DC USA April 19-26, 2002
have been permanently installed on the crests of the dams to provide a warning system that will “wake up” the robotic total stations in case of abnormally large displacements. The monitoring data is automatically collected at preselected time intervals and is controlled by an office computer located about 100 km away. All the data collection and automatic data processing are controlled by DIMONS software developed at the University of New Brunswick. The main objective of the presented study has been to verify whether the behaviour of the West Dam and East Dam during the filling of the reservoir follows a pattern derived from a numerical model using the finite element analysis. In the analysis, the main two effects were considered at the stage of filling the reservoir: pressure of water and effect of wetting. During the process of wetting, the values of geotechnical material parameters and the derived values of Young modulus (E) decrease. Young modulus of the wet material in the submerged sections of the structure becomes smaller and buoyancy force is developed producing dam deformation. The determination of deformation of the dams due to wetting was performed assuming the behaviour of earth dam and the bedrock as linear elastic materials. Values of the Young modulus in the investigated cross-sections of the dams were obtained from the non-linear analysis in dry conditions (Szostak-Chrzanowski et al. 2000). The determined values shown a large variation of the Young modulus through the structure. In the analysis in wet conditions, the values of Young modulus were decreased according to known empirical formulae and averaged over selected zones. In the presented example, modeling of the dam deformation due to wetting shows that the predicted displacements, at the crest and at the downstream face, are of the magnitude that can easily be detected by the automated geodetic monitoring system at DVL project. A very good agreement has been obtained between the calculated (modelled) displacements and geodetic monitoring data on the crests of the dams in the process of filing the reservoir. This agreement confirms that the geotechnical parameters and the values of Young modulus, as used in the FEM analysis, as well as the presented method of modelling the dam behaviour, are correct. This is an important conclusion for a possible use of the verified parameters in future analyses of possible effects of additional loads arising, for example, from tectonic movements. CONTACT Anna Szostak- Chrzanowski and Adam Chrzanowski Canadian Center for Geodetic Engineering University of New Brunswick Fredericton N.B. E3B 5A3 CANADA Tel. + 1 506 453 5195 E-mail: AMC@UNB.CA and ADAMC@UNB.CA, web site: www.unb.ca/gge/ TS6.4 Deformation Measurement and Analysis II 2/13 Szoztak-Chrzanowski, Anna, Michel Massiera, Adam Chrzanowski, Fabien Le Hoan, Cecilia Whitaker Verification of Design Parameters of Earthen Dams at Diamond Valley Lake Using Geodetic Measurements FIG XXII International Congress Washington, DC USA April 19-26, 2002
Michel Massiéra and Fabien Le Hoan
Faculté d'ingénierie (Génie civil)
Université de Moncton
Moncton, NB
E1A 3E9 CANADA
E-mail: massiem@umoncton.ca

Cecilia Whitaker
Metropolitan District of Southern California (MWD)
Los Angeles, CA, 90054
USA
E-mail: cwhitaker@mwdh2o.com

TS6.4 Deformation Measurement and Analysis II                                                   3/13
Szoztak-Chrzanowski, Anna, Michel Massiera, Adam Chrzanowski, Fabien Le Hoan, Cecilia Whitaker
Verification of Design Parameters of Earthen Dams at Diamond Valley Lake Using Geodetic Measurements

FIG XXII International Congress
Washington, DC USA April 19-26, 2002
Verification of Material Parameters of Earthen Dams at Diamond Valley
Lake Using Geodetic Measurements
Dr. Anna SZOSTAK-CHRZANOWSKI, Michel MASSIERA, Dr. Adam
CHRZANOWSKI and Fabien LE HOAN, Canada and Cecilia WHITAKER, USA
1. INTRODUCTION
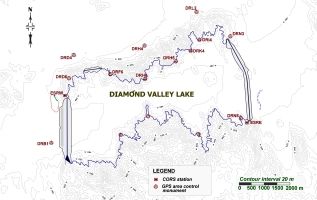
Diamond Valley Lake (DVL), located about 160 km south-east of Los Angeles, when filled
up, will be the largest water storage reservoir in Southern Califonia of a capacity of nearly
one billion cubic metres. It has been created by Metropolitan Water District (MWD) of
Southern California by enclosing the Domenigoni/Diamond valleys by three large earth/rock
filled dams (Fig.1). This largest in the United States earthfill dam project consists of:
•West Dam, about 85 m high and 2.7 km long, volume 49.7 106 m3,
•East Dam, about 55 m high and 3.2 km long, volume 32.9 106m3, and
•Saddle Dam, about 40 m high and 0.7 km long, volume 1.9 106 m3.
Filling of the reservoir started in December 1999. At the time of writing this paper (January
2002) the reservoir, of a capacity of almost one billion cubic metres, has been 67% filled. It is
estimated that the complete filling will take 2-3 more years, depending on the water
availability.
Safety of earth dams depends on the proper design, construction, and monitoring of actual
behaviour during the construction and during the operation of the structure. Deformation
monitoring of large dams and their surroundings supplies information on the behaviour of the
structure and its interaction with the bedrock. Monitoring results may also be used in
verifying design parameters where the geotechnical parameters are of the highest importance.
The determination of geotechnical parameters may be done in situ or in the laboratory. In
laboratory testing, the selected samples may differ from one location to another, they may be
disturbed during the collection, or the laboratory loading conditions may differ from natural
conditions. Therefore, the comparison of the monitored data with the predicted data, obtained
during the design, may give important information concerning the quality of the accepted
geotechnical parameters.
In October 2000, a fully automated system with a capability of the continuous monitoring of
the behaviour of the dams was implemented at DVL (Whitaker et al. 1999, Duffy et al. 2001).
The automated system consists of an array of geotechnical instrumentation with the automatic
data acquisition and a geodetic system consisting of 8 robotic total stations (Leica
TCA1800S) with the automatic target recognition and electronic measurements of angles and
distances to about 300 targets (prisms) located on the crests and faces of the dams. In
addition, 5 continuously working GPS receivers, have been permanently installed on the
crests of the dams to provide a warning system that will “wake up” the robotic total stations
in case of abnormally large displacements. All functions of the robotic total stations,
automatic data collection at preselected time intervals, and automatic processing of the
geodetic data are controlled by an office computer located about 100 km away, using
TS6.4 Deformation Measurement and Analysis II 4/13
Szoztak-Chrzanowski, Anna, Michel Massiera, Adam Chrzanowski, Fabien Le Hoan, Cecilia Whitaker
Verification of Design Parameters of Earthen Dams at Diamond Valley Lake Using Geodetic Measurements
FIG XXII International Congress
Washington, DC USA April 19-26, 2002DIMONS software developed at the University of New Brunswick (Duffy et al., 2001, Lutes
et al., 2001).
At the design stage of the DVL Project, MWD performed a thorough analysis of the expected
dam deformations during and after the construction including, among others, analyses of
gravitational consolidation and settlement, effects of seepage, and earthquake- induced
deformations. As a result of the analysis, post-construction threshold values of observed
deformation have been established for the normal behaviour of the structures as listed in
(MWD, 1997). Based on those values, the overall accuracy of the monitoring surveys has
been designed to detect displacements with the accuracy of 0.01m at the 95% confidence
level.
A preliminary study on the use of geodetic monitoring data in verifying geotechnical
parameters of the dam material was performed at the stage of dam construction in dry
condition (Szostak-Chrzanowski et al., 2000). In the process of filling the reservoir, the
wetting of the dam material may cause significant changes to the material parameters. The
main objective of the study presented in this paper has been to verify whether the behaviour
of the West Dam and East Dam during the filling of the reservoir follows a pattern derived
from a numerical model using the finite element analysis.
East Dam
West Dam
Fig. 1. Diamond Valley Lake Reservoir in California
3. METHODOLOGY OF DEFORMATION ANALYSIS DUE TO WETTING
Effects of wetting have been analysed and compared with monitoring data at selected cross-
sections of the West and East dams (Fig.1). The determination of deformation of the dams
due to wetting was performed assuming the behaviour of earth dam and the bedrock as linear
elastic materials. The initial values of Young modulus in the investigated cross-sections of
the dams were obtained from the non-linear construction analysis in dry conditions (Szostak-
TS6.4 Deformation Measurement and Analysis II 5/13
Szoztak-Chrzanowski, Anna, Michel Massiera, Adam Chrzanowski, Fabien Le Hoan, Cecilia Whitaker
Verification of Design Parameters of Earthen Dams at Diamond Valley Lake Using Geodetic Measurements
FIG XXII International Congress
Washington, DC USA April 19-26, 2002Chrzanowski et al. 2000). The determined values shown a large variation of the Young modulus through the structure. In the analysis in wet conditions, the values of Young modulus were averaged over selected zones. At the stage of filling the reservoir, the main two effects were considered: pressure of water and effect of wetting. During the process of wetting, the values of geotechnical material parameters and the derived values of Young modulus (E) decrease. Young modulus of the material in the submerged sections of the structure becomes smaller and buoyancy force is developed producing dam deformation. In the process of the calculation of displacements, one has to determine the change of E between dry and wet conditions. Thus, the analysis of the effects of wetting has been performed in the following steps. 1. Determination of Young modulus for dry conditions (Edry) of the dam and foundation using non-linear analysis of the dam construction. 2. Determination of Young modulus for partially wet conditions (Esat) of the dam structure using non-linear analysis. The wet conditions are function of the reservoir water level. 3. Determination of the displacements of the dam structure caused by the difference between Edry and Esat using linear elastic analysis. In the analysis of construction process (step 1 and step 2), the dams were assumed to have non-linear material characteristics and were modelled using the hyperbolic model (Duncan and Chang, 1970). In the hyperbolic model, the non-linear stress- strain curve is a hyperbola in σ1−σ3 versus axial strain plane. During the construction of the dam, the non-linear behaviour of the soil was modelled by successive increments of loading. Within each increment of the load, the soil behaviour was assumed to be linear, with the re-evaluated values of Young modulus. After achieving full compaction, the material of the embankment dam was modelled as a linear-elastic material. The rock mass on which the embankment dam is located has been assumed to behave as a linear-elastic material under the load of the weight of the dam and the weight of water in the reservoir. 4. GEOTECHNICAL PARAMETERS OF THE DAM MATERIAL The DVL dams have been constructed from soil and rock. The core materials are silty and clayey sandy alluviums obtained from the floor of the reservoir and the rock fill was obtained from bedrock hills of the reservoir. Fig. 2 shows as an example a typical cross-section of the West Dam. Table 1 lists geotechnical parameters used in the analysis of West and East Dams. TS6.4 Deformation Measurement and Analysis II 6/13 Szoztak-Chrzanowski, Anna, Michel Massiera, Adam Chrzanowski, Fabien Le Hoan, Cecilia Whitaker Verification of Design Parameters of Earthen Dams at Diamond Valley Lake Using Geodetic Measurements FIG XXII International Congress Washington, DC USA April 19-26, 2002
Table 1. Geotechnical Parameters for the West and East Dams.

                      Parameters                        Core                        Filters                       Rockfill shell

                          γ (kN/m3)                      22                         20.42                               22
                              φ                         38°                          47°                               45°
                              Ko                         0.5                          0.5                               0.5
                              K                         500                          560                               560
                              Kb                        210                          330                               330
                              n                         0.55                         0.48                              0.48
                              m                          0.4                         0.33                              0.33
                              Rf                         0.7                         0.65                              0.65

In Table 1, φ is an angle of friction, γ is unit weight, K is loading modulus number, and n is
exponent for loading behaviour. Kb is bulk modulus number, m is bulk modulus exponent, Ko
is the earth’s pressure ratio, and Rf is the failure ratio. The wet parameters are smaller than
dry parameters for the same soil. The wet parameters were obtained using the relations shown
in Table 2 for filter and shell (Touileb et al. 2000). For core, the wet parameters are given for
the 0 m, 20m, 40m, 60m, and 80m height of water at the West Dam in Table 3 and for the 0
m, 14.25m, 28.5m, 42.75m, and 52.25m height of water at the East Dam in Table 4.
                620
                600
                580
Elevation [m]

                560                      Core
                                         Filter                     SPE-4
                540                                                                          Filter
                520               Rock Shell                                SPE-3
                                                                                             Rock Shell
                500         Backfill                                                 SPE-2
                                                                                                      Backfill
                480                                                                     SPE-1

                460
                440
                420
                      0      50    100     150    200   250   300   350      400       450      500   550    600 650
                                                               Length [m]
Fig.2 Schematic cross-section of the West Dam

Table 2.Geotechnical parameters for saturated conditions at West and East Dams.

                     Zone                                         Ksat                                                     Kb sat
                     Filter                               Ksat = 0.85 K = 476                                    Kb sat = 0.85 Kb = 280.5
                  Rockfill shell                          Ksat = 0.60 K = 336                                    Kb sat = 0.60 Kb= 198.0

TS6.4 Deformation Measurement and Analysis II                                                   7/13
Szoztak-Chrzanowski, Anna, Michel Massiera, Adam Chrzanowski, Fabien Le Hoan, Cecilia Whitaker
Verification of Design Parameters of Earthen Dams at Diamond Valley Lake Using Geodetic Measurements

FIG XXII International Congress
Washington, DC USA April 19-26, 2002
Table 3. Geotechnical parameters for core in saturated conditions as a function of the height
of the water at the West Dam.
Height of water (m) Ksat Kb sat
0 Ksat = 0.9 K = 450 Kb sat = 0.9 Kb = 189
20 Ksat = 0.8 K = 400 Kb sat = 0.8 Kb = 168
40 Ksat = 0.8 K = 400 Kb sat = 0.8 Kb = 168
60 Ksat = 0.7 K = 350 Kb sat = 0.7 Kb = 147
80 Ksat = 0.6 K =300 Kb sat = 0.6 Kb = 126
Table 4. Geotechnical parameters for core in saturated conditions as a function of the height
of the water at the East Dam.
Height of water(m) Ksat Kb sat
0 Ksat = 0.9 K = 450 Kb sat = 0.9 Kb = 189
14.25 Ksat = 0.8 K = 400 Kb sat = 0.8 Kb = 168
28.5 Ksat = 0.7 K = 350 Kb sat = 0.7 Kb = 147
42.75 Ksat = 0.6 K = 300 Kb sat = 0.6 Kb = 126
52.25 Ksat = 0.6 K = 300 Kb sat = 0.6 Kb = 126
5. DETERMINATION OF YOUNG MODULUS
The values of Young modulus were obtained from the construction analysis using
geotechnical parameters for dry and wet conditions. Figure 3 shows the investigated cross-
section of the West Dam with the delineated wet (saturated) zones during filling of the
reservoir. The obtained values of Young modulus significantly vary through the structure.
Table 5 and Table 6 list average values of Edry and Esat for different zones of dry and wet
material in the West Dam and East Dam respectively.
620
600
580
Elevation [m]
560 Filter Filter
540
520 Rock backfill Rock shell
500
Rock backfill
480
460 Berm
Rock shell Core
440
420
0 50 100 150 200 250 300 350 400 450 500 550 600 650
Length [m]
Fig 3. Schematic cross-section of the West Dam with dry and wet zones.
TS6.4 Deformation Measurement and Analysis II 8/13
Szoztak-Chrzanowski, Anna, Michel Massiera, Adam Chrzanowski, Fabien Le Hoan, Cecilia Whitaker
Verification of Design Parameters of Earthen Dams at Diamond Valley Lake Using Geodetic Measurements
FIG XXII International Congress
Washington, DC USA April 19-26, 2002Table 5. Calculated values of E at selected heights for dry and saturated conditions at the
West Dam.
Dry Materials – E, MPa Saturated Materials – Esat, MPa
Rockfill Shell Rockfill Shell
Core Filters Upstream Downstream Core Filters Upstream Downstream
Construction 44 53 56 54
Water Level (m)
0 43 53 48 55 42 54 40
20 44 55 47 44 39 53 37 62
40 43 51 43 45 32 50 33 55
60 35 41 32 44 28 49 30 50
80 34 40 32 44 23 45 27 50
Table 6. Calculated values of E at selected heights for dry and saturated conditions at the East
Dam.
Dry Materials – E, MPa Saturated Materials – Esat, MPa
Rockfill Shell Rockfill Shell
Core Filters Upstream Downstream Core Filters Upstream Downstream
Construction 42 50 47 47
Water Level (m)
0 40 47 44 47 39 46 38
14.25 40 47 43 46 34 45 34 42
28.50 37 45 36 42 32 43 30 39
42.75 37 45 36 41 25 43 28 39
52.25 37 45 36 41 23 43 26 38
The Young modulus of the rock backfill in West Dam and East Dam is E = 45 MPa and Esat =
40 MPa.
6. MODELLING OF DISPLACEMENTS DURING FILLING OF RESERVOIR
6.1. Determination of Vertical Displacements at the West Dam
The investigated cross-section of West Dam is located in the middle of the dam. At this
location the dam is 843 m high. The cross-section of the model is shown in Fig. 3. The
calculated values of Young modulus for dry and wet conditions are given in Table 5. The
analysis was performed for the water level reaching toe of the dam, and 20 m, 40 m, 60 m,
and 80 m above the toe of the dam. The calculated vertical displacements are shown in Fig 4.
TS6.4 Deformation Measurement and Analysis II 9/13
Szoztak-Chrzanowski, Anna, Michel Massiera, Adam Chrzanowski, Fabien Le Hoan, Cecilia Whitaker
Verification of Design Parameters of Earthen Dams at Diamond Valley Lake Using Geodetic Measurements
FIG XXII International Congress
Washington, DC USA April 19-26, 2002540
530
520
Elevation (m)
510
500
490
480
470
-0.270 -0.170 -0.070 0.030
Vertical Displacements (m)
0m 20 m 40 m 60 m 80 m
Fig. 4. Vertical displacements of the West Dam at the pt (SPE-1 to SPE-3) and at the crest
(SPE-4)
The FEM calculated displacements could be compared only with one measured value
obtained to a point on the crest of the dam (Fig. 5) because the manual surveys (prior to the
commencement of automated measurements in December 2000) did not include points on the
downstream face. At the end of December of 2001 the calculated vertical displacement was
0.172 m and measured was 0.173 m. The predicted vertical displacement at the end of the
filling of reservoir is 0.174m.
0.000
-0.040
Displacement (m)
-0.080
-0.120
-0.160
-0.200
0 20 40 60 80 100
Water Level (m)
Calculated Measured
Fig. 5. Calculated and measured displacements at the crest of the West Dam
TS6.4 Deformation Measurement and Analysis II 10/13
Szoztak-Chrzanowski, Anna, Michel Massiera, Adam Chrzanowski, Fabien Le Hoan, Cecilia Whitaker
Verification of Design Parameters of Earthen Dams at Diamond Valley Lake Using Geodetic Measurements
FIG XXII International Congress
Washington, DC USA April 19-26, 20026.2 Determination of Vertical Displacements at the East Dam
The investigated cross-section of East Dam is located in the middle of the dam. At this
location the dam is 56.3 m high. The calculated values of Young modulus for dry and wet
conditions are given in Table 6. The analysis was performed for the water level reaching toe
of the dam, and 14.25m, 28.5m, 42.75m, and 52.25m height of water above the toe of the
dam. The calculated vertical displacements are shown in Fig 6. At the end of December of
2001 the calculated vertical displacement was 0.048m and measured was 0.046m This
comparison gave a very good agreement indicating that the behaviour of the dam is as
expected. The calculated maximum vertical displacement of the crest is 0.074m.
540
530
Elevation (m)
520
510
500
490
-0.100 -0.050 0.000 0.050
Displacement (m)
0m 14.25 m 28.50 m 42.75 m 52.25 m
Fig. 6. Vertical displacements of the East Dam at the pt (SPE-1 to SPE-3) and at the crest
(SPE-4)
0
-0.01
Displacements (m)
-0.02
-0.03
-0.04
-0.05
-0.06
-0.07
-0.08
0 10 20 30 40 50 60
Water Level (m)
measured displacements calculated displacement
TS6.4 Deformation Measurement and Analysis II 11/13
Szoztak-Chrzanowski, Anna, Michel Massiera, Adam Chrzanowski, Fabien Le Hoan, Cecilia Whitaker
Verification of Design Parameters of Earthen Dams at Diamond Valley Lake Using Geodetic Measurements
FIG XXII International Congress
Washington, DC USA April 19-26, 2002Fig.7. Calculated and measured displacements at the crest of the East Dam.
7. CONCLUSIONS
Due to possible uncertainties of the values of geotechnical parameters of the construction
material, one may expect large uncertainties in the determined post-construction Young
modulus. This affects the determination of the expected deformations of the embankment
dams. The developed method for modelling effects of the saturation of the dam material gives
displacement results comparable to the observed values. The presented examples of modeling
the dam deformation due to wetting shows that the predicted displacements, at the crest and
at the downstream face, are of the magnitude that can easily be detected by geodetic
measurements. A very good agreement has been obtained between the calculated (modelled)
displacements and geodetic monitoring data on the crests of the dams in the process of filing
the reservoir. This agreement confirms that the geotechnical parameters and the values of
Young modulus, as used in the FEM analysis, as well as the presented method of modelling
the dam behaviour, are correct. This is an important conclusion for a possible use of the
verified parameters in future analyses of possible effects of additional loads arising, for
example, from tectonic movements.
The research is in progress and additional modeling of the DVL dams will be performed
when filling of the reservoir will be completed and when more geodetic data will become
available for the verification of the results.
8. ACKNOWLEDGEMENTS
The Natural Sciences and Engineering Research Council provided the financial support for
the research on the presented topic. Dr. C. Hill of MWD delivered the data on the water
levels.
REFERENCES
Duffy, M., Hill, C., Whitaker, C., Chrzanowski, A., Lutes, J. and Bastin, G., 2001. An
automated and integrated monitoring program for Diamond Valley Lake in California.
Proceedings of the 10th FIG International Symposium on Deformation Measurements,
Orange, California, pp. K-1 to K-23.
Duncan, J.M. and Chang, C.Y., 1970. Non-linear analysis of stress and strain in soils.
Journal of the SMFD, ASCE, 96(5) : pp. 1629-1653.
Lutes, J., Chrzanowski, A., Bastin, G., and Whitaker, C., 2001. DIMONS software for
automatic data collection and automatic deformation analysis. Proceedings of the 10th
FIG International Symposium on Deformation Measurements, Orange, California, pp.
101-109.
Metropolitan Water District of Southern California, 1997. Eastside Reservoir Project at a
Glance. MWD Public Affair Division, Los Angeles, California, USA.
Szostak-Chrzanowski, A., Massiéra, M., Chrzanowski, A., Whitaker, C. and Duffy, M, 2000.
Verification of design parameters of large dams using deformation monitoring data –
TS6.4 Deformation Measurement and Analysis II 12/13
Szoztak-Chrzanowski, Anna, Michel Massiera, Adam Chrzanowski, Fabien Le Hoan, Cecilia Whitaker
Verification of Design Parameters of Earthen Dams at Diamond Valley Lake Using Geodetic Measurements
FIG XXII International Congress
Washington, DC USA April 19-26, 2002potentials and limitations. Proceedings of the Canadian Dam Association, 3rd Annual
Conference, Regina, pp. 193-202.
Touileb, B.N., Bonnelli, S., Anthiniac, P., Carrere, A., Debordes, D., La Barbera, G, Bani, A.
and Mazza, G., 2000. Settlement by wetting of the upstream rockfills of large dams.
Proceedings of the 53rd Canadian Geotechnical Conference, Montreal, Vol. 1, pp.
263-270.
Whitaker, C., Duffy, M.A. and Chrzanowski, A., 1999. Installation of a continuous
monitoring scheme for the eastside reservoir project in California. Proceedings of the
9th FIG International Symposium on Deformation Measurements, Olsztyn, Poland, pp.
72-84.
BIOGRAPHICAL NOTES
Anna Szostak-Chrzanowski Ph.D., P.Eng., Adjunct Professor and Senior Research Associate
in the Canadian Centre for Geodetic Engineering at University of New Brunswick and
Adjunct Professor in Civil Engineering at the Université de Moncton. She is a specialist in
numerical modeling of displacement and stress field in structural engineering, rock
mechanics and geotechnical problems. She is a specialist in combined numerical modeling of
calculated and monitored displacements using back analysis and error propagation technique.
TS6.4 Deformation Measurement and Analysis II 13/13
Szoztak-Chrzanowski, Anna, Michel Massiera, Adam Chrzanowski, Fabien Le Hoan, Cecilia Whitaker
Verification of Design Parameters of Earthen Dams at Diamond Valley Lake Using Geodetic Measurements
FIG XXII International Congress
Washington, DC USA April 19-26, 2002You can also read