BCCDC Data Summary 5 August 2021
←
→
Page content transcription
If your browser does not render page correctly, please read the page content below

BCCDC Data Summary
     5 August 2021

                     1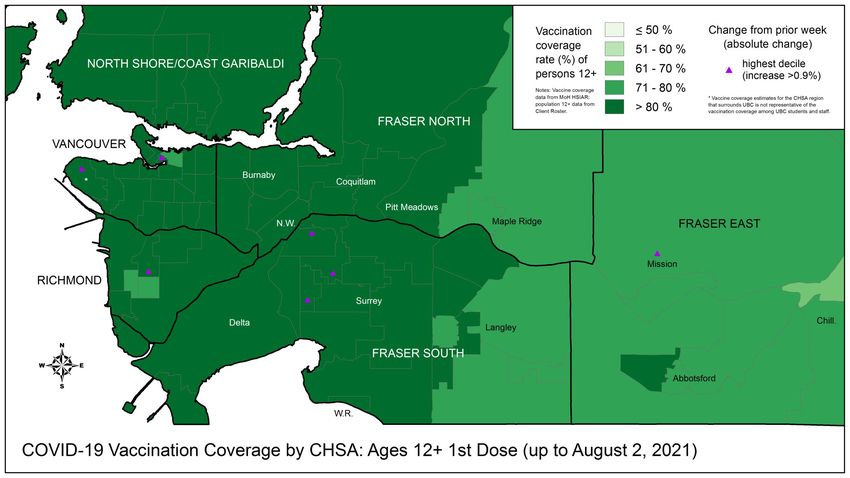
Purpose
The surveillance deck is a summary of COVID-19 related indicators that can help inform the pandemic
response in British Columbia. This surveillance monitoring constitutes the medical chart for population
health assessment that guides the public health community of practice. As such this is a working
document that reflects a snapshot in time and may differ from other published reports.
Data Sources
The collection, use and disclosure of case data is subject to the Public Health Act. COVID-19 cases are
reported under the Public Health Act to the health authority of residence. Public health case
notification, clinical management, contact tracing and follow-up contributes surveillance data for
regional and provincial COVID-19 monitoring. Each regional health authority have their own workflows
and information systems for capture of relevant data. This data foremost serves the public health and
clinical management of the case and their contacts.
Disclaimer
• Data and key messages within these documents are not finalized and considered to be work in
  progress that is subject to retroactive changes as more data and information become available.
• Accurate interpretation of figures may be difficult with the limited inclusion of data notes and
  methodology descriptions in this document.
                                                                                                   2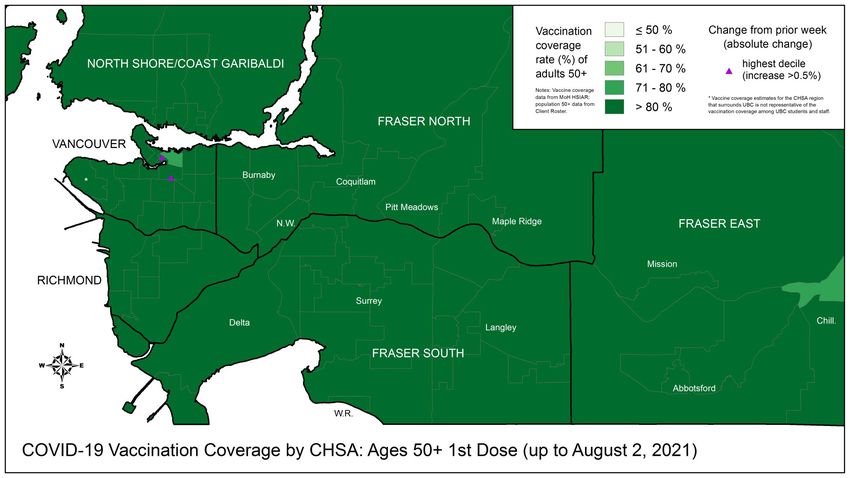
Table of Contents
 Overall Summary ……….…………………………………………………………………………………………………………………………4

 Surveillance ………………………………………………………………………………………………………………………………………….5

       BC Epidemiology………………………………………………………………………………………………………………….….5

       Vaccinations…………………………………………………………………………………………………………………………..15

       Labs/Genomics…………………………………………………………………………………………….………………………..25

 Modelling…………………………………………………………………………………………………………………………………..…………35

 Additional Resources………………….……..………………………………………………………………………………………………….37

                                                                      3
Overall Summary for surveillance data up to 3 Aug
• Case rates have increased recently; test positivity for public tests is ~7% provincially.
     • Recent increases in cases primarily driven by Interior Health.
     • Increase in incidence and positivity greatest in 19-29 year olds.
     • Percent positivity >10% in IH.
• New hospitalizations are low and stable in each region; hospital/critical care census is low and stable across BC;
  new deaths are stable and very low.
• Majority of the cases, hospitalizations and deaths over the past month were among unvaccinated individuals.
  Severe outcomes in fully vaccinated individuals are infrequent.
• Vaccine coverage in BC, 3 Aug: ~90% of 70+ and ~81% of 12+ have received their 1st dose; ~60% of the total
  population has received their 2nd dose. Lower vaccine coverage among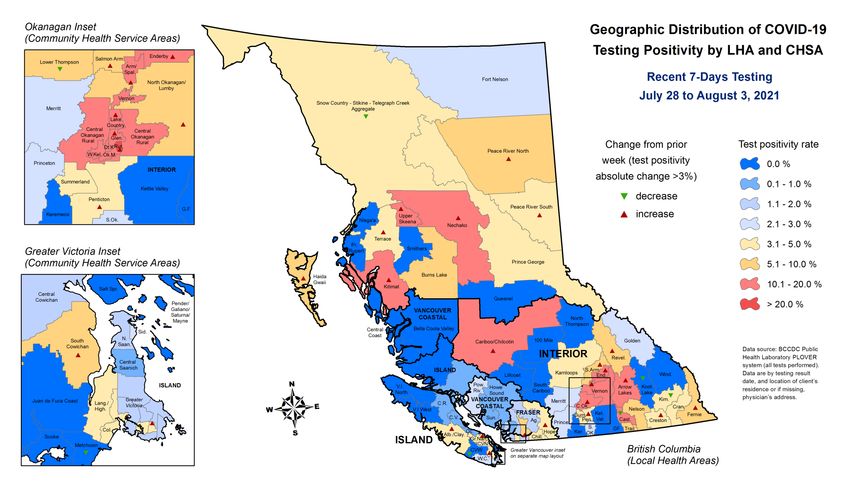
Jul 29 to Aug 03: BC COVID-19 Profile
  150,973 total cases           1,772   total deaths
    1,529 new this week            1    new this week

    8,162 ever hospitalized   147,409   removed from isolation
      37 new this week           653    new this week

                                                                 4
Most of the cases,
hospitalizations and
deaths over the past
month were among
unvaccinated individuals

*Also see slides 17 and 18

Case rates are starting to increase provincially, with particularly driven by Interior; new
hospitalizations are stable and low in all HAs except for Interior, which increased recently; new
deaths are stable and very low.

                                                                      For latest version of a graph similar to this one (difference:
                                                                      hospital census, not new hospitalizations), see the Epi App

                                                                                                                            5
Incidence and % positivity have increased in all HAs. IH reporting record high incidence and % positivity.
Note the lower vaccination coverage in individuals
Hospital and critical care census is stable and low in all regions.

                                                                      16
Number of new hospital admissions is stable and low. Deaths are stable and
low.

                                                                             10
For latest version of this map, see the new (note: change 11 symbols not included) COVID-19 Surveillance Dashboard
For latest version of this map, see the new (note: change   12
symbols not included) COVID-19 Surveillance Dashboard
For latest version of this map, see the   13
new COVID-19 Surveillance Dashboard
For latest version of this map, see the   14
new COVID-19 Surveillance Dashboard
Vaccination progress in BC over time by age group and dose number up to 3 August

                                                                                   15
Vaccination progress in BC
by Health Authority, age
group and dose number as
of August 3rd
*Note: BC numbers include individuals
where health authority of residence was
not assigned
Blue lines at 80% are for visual reference
only for easier navigation across panels
Data source: Provincial Immunization Registry, PHSA 16Over the past month (24 Jun-24 Jul), fully vaccinated individuals accounted for only ~7% of
hospitalizations and deaths.*
This % is expected to increase as more people get fully vaccinated and there are fewer unvaccinated people. If
100% of the population gets fully vaccinated, then any new cases, hospitalizations, or deaths will be among
vaccinated people. Percentages for severe outcomes among partially or fully vaccinated need to be interpreted
with caution given small numbers in this 4 week snapshot.
Cases Hospitalizations Deaths
N=1,683 N=136 N=18
6% 7% 6%
30% 12% 22%
64% 80% 72%
*see next slide for more details
Data source: Health Authority case line list Note: % may not add to 100 due to roundingTrend* in % total population
vaccinated with at least 1 dose
Number
of people
Trend* in daily cases per 100K
Number
of Cases
Trend* in daily hospitalizations per 100K
Number of
Cases
hospitalizations
Trend* in daily deaths per 100K
Number
of deaths
*Figures include data for
24 Jun – 24 July 2021
Age group
Data sources: Health Authority case line list and PHSA Note: % may not add to 100 due to rounding
Provincial Immunization RegistryUnvaccinated cases and hospitalized individuals are younger
compared to fully vaccinated cases and hospitalized individuals.
Median age (years)
Vaccine status* Cases Hospitalizations Deaths
N=1,683 N=136 N=18
Unvaccinated 28 50 72
Vaccinated, 1 dose 31 43 66
Vaccinated, 2 doses 49 73 67
Total 30 52 68
This table is based on data for 24 Jun – 24 July 2021
*Unvaccinated is defined as no doses or within 3 weeks of 1st dose; Vaccinated, 1 dose is defined as >3 weeks after 1st dose and 1 week after 2nd dose
**Percentages for severe outcomes among partially or fully vaccinated need to be interpreted with caution given small numbers in this 4 week
snapshot
Data sources: Health Authority case line listFor latest version of this map, see the 20 new COVID-19 Surveillance Dashboard
For latest version of this map, see the   21
new COVID-19 Surveillance Dashboard
For latest version of this map, see the   22
new COVID-19 Surveillance Dashboard
For latest version of this map, see the   23
new COVID-19 Surveillance Dashboard
Nationally, BC’s vaccination rate is very close to Canadian average; internationally, Canada is
      one of the countries with the highest proportion of the population with at least one dose.

Data source: Open Data                   For latest vaccination progress statistics in Canada   Data source: Our World in Data
Visualization: BCCDC                     and internationally, see the Epi App                             Visualization: BCCDC

                                                                                                                     24
Lab - Key Messages
• Percent positivity among publicly funded tests doubled in last week (from 3.2 to 6.3 %)
• Test positivity varied by HA, ranging from 3.8% in FH to 14.3% in IH.
• Increase in incidence and positivity in individuals aged < 45 years; most marked increase in individuals 19 to 29 years .
• Testing rates increased 10% this week (~52,000 total tests July 25 to 31)
• The provincial weekly median turnaround time (time from specimen collection to lab result) is 15
hours, indicating good testing capacity; only 1 in 4 tests took ≥24 hours to result.
• The share of VOCs among all positive tests in BC is ~100% from July 25 to 31.
• Sequencing-based VOC prevalence for July 25 to 31 shows distribution of lineages among VOC
samples: predominant B.1.617.2 (Delta) ~95%. P.1 (Gamma) ~3%, and B.1.1.7 (Alpha)~2%.
25Weekly Summary of ALL lab tests performed
3,099,755 total specimens tested
10% relative to last week
52,130 new this epi week
158,387 total positive specimens 2.8% positivity
1.4% absolute change from
1,462 new positive this epi week last week
21 hr mean turnaround time (TAT)
54% TAT relative to last
15 [9-24] Median [Q1 – Q3] TAT week
Weekly Summary of Lab tests paid Publicly
2,424,899 total specimens tested
17% relative to last week
22,467 new this epi week
156,743 total positive specimens 6.3% positivity 26
3.1% absolute change from
1,413 new positive this epi week
last week
Data source: PLOVER extract at 10:30am on August 4, 2021.
Epi week 30 (July 25 - 31)For latest version of this map, see the new (note: change 27 symbols not included) COVID-19 Surveillance Dashboard
Includes all tests

For latest version of this map, see the new (note: change          28
symbols not included) COVID-19 Surveillance Dashboard
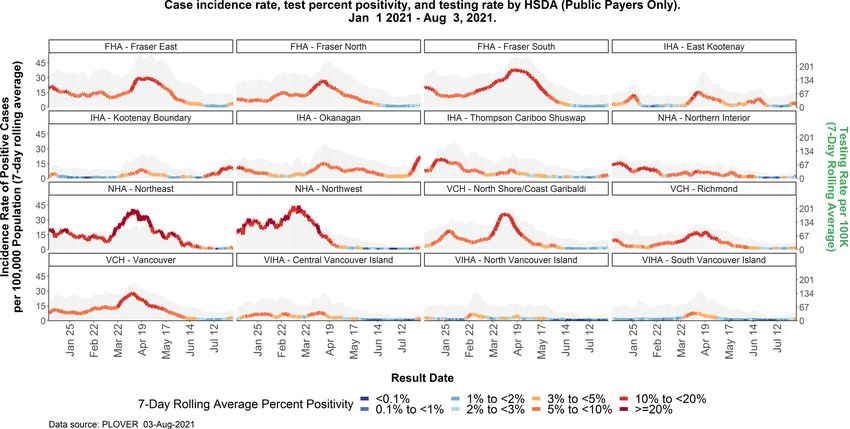
In epi week 30, percent positivity among publicly funded tests has nearly
doubled as compared with epi week 29 (6.3% and 3.2% respectively).

                                                                            29
Incidence is increasing rapidly in the Okanagan and Kootenay Boundary HSDAs, but remains low in other HSDAs.
Increase in incidence and positivity in individuals aged < 45 years; most marked increase in individuals 19
to 29 years.

                                                                                                          31
Over the past epi week, the majority of COVID-19 positive samples were VOCs (~100%). Note:
the absolute number of VOC samples is small but has increased recently.
Prevalence of VOC, by epi week in BC and Health Authorities, Jul 25 - Jul 31
Shaded area reflects
partial data and is
subject to change
Note: given smaller
number of weekly cases,
percentages are more
likely to fluctuate
This figure can also be found in the weekly VOC report
Data from the Plover system at the BCCDC Public Health Lab 32Prevalence of the Delta variant among all sequenced samples* has increased
substantially over the past few weeks
Estimated sample prevalence of VOCs by lineage by epi week of collection date, Jan 3 – Jul 24, 2021
Given the sequencing
turnaround time, specimens
collected in the last epi week
continue to be analyzed.
This figure can also be found in the weekly VOC report
*Not all sequenced samples are VOCs; only VOCs are illustrated in this figure 33Among sequenced VOC samples provincially based on information for July 25th to July 31st, the relative
proportion of Delta has increased to 95% and is now the dominant variant, while Gamma (3%) and Alpha
(2%) and have both declined.
Alpha (2%)
Delta (95%)
Gamma (3%)
Weeks 13 onward include
specimens from qPCR SNP
screening that resulted as
presumptive positive for
B.1.1.7 and P.1.
34Model notes and assumptions
• Rt modelling: a dynamic compartmental model was fit to COVID-19 data for BC using a Bayesian framework
(Anderson et al. 2020. PLoS Comp. Biol. 16(12): e1008274). Results are presented as provincial and regional
time-varying estimates of average daily transmission rate (Rt).
• the model does not consider importation of cases, hence all transmission is assumed to arise from local
cases
• the model does not distinguish cases arising from variants of concern (VoCs) versus ‘wild-type’ COVID-19,
hence model estimates represent average rates of transmission
36Additional Resources
• BCCDC COVID-19 Surveillance Dashboard showing maps, vertical plots, and trends by LHA can be
found here
• More BC COVID-19 data, including the latest Situation Report, maps, and BC COVID-19 public
dashboard, can be found here
• For more information on variants of concern and whole genome sequencing, the latest report is
posted here
• To put BC provincial, Health Authority, and HSDA trajectories into national and international
context, see BCCDC COVID-19 Epidemiology app
• COVID SPEAK 2020 Round 1 Survey results
• Slides for previous public and modelling briefings by Dr. Bonnie Henry can be found here
• PHAC’s COVID-19 Epidemiology update can be found here
37You can also read