Biden his time Monthly Investment Strategy AXA IM Research September 2020 - Banken
←
→
Page content transcription
If your browser does not render page correctly, please read the page content below

Biden his time Monthly Investment Strategy AXA IM Research September 2020
Summary of views
Theme of the month: US elections
•       US elections held on 3 November could provide a major turning point for US policy, with much hanging on Presidential and Congressional votes.
•       Our outlook, based on current polling, is for Joe Biden to win the Presidency. He has maintained a lead at national level far in excess of that likely needed
        to deliver an Electoral College majority. Biden also appears to be polling well in key states. However, the President’s deficit has shrunk in recent weeks.
•       The Congressional race will determine how much of either candidates’ agendas might be enacted. Democrats look on track to retain a majority in the
        House, but the Senate race looks too close to call. Further Republican gains in the polls over the remaining weeks could see them retain a majority here.
•       With mail-in votes likely to delay the election outcome and amongst a number of electoral issues already being questioned, there is a real prospect for
        legal challenges, particularly if the initial count is close, which could lead to a protracted period of uncertainty, and risks of a constitutional crisis.

Macro update: Q3 rebound, but winter is coming ..
•       The US should post a record growth rebound in Q3 after a record collapse in Q2. Yet, the level of activity is still likely to be at least 5% below pre-Covid
        levels and unemployment – having fallen sharply – remains at 8.4%. With benefits being curtailed, recovery looks set to be slower beyond Q4.
•       COVID-19 cases are rising again in Europe, particularly in Spain and France. Governments are reintroducing restrictions, but less stringently than in Q2.
        Downside activity risks are rising, not least with growth momentum slowing into the summer. Government and ECB policy support remains critical.
•       The UK also sees rising virus cases. Q3 looks likely to be better-than-expected, but medium-term risks are rising again, including from Brexit.
•       China’s latest data suggested a broadening recovery, driven both by internal and external growth revival. This is likely to embolden the central bank to
        further reduce policy stimulus. We continue to expect supportive fiscal policy, which on balance, sees us consider upside risks to our current forecasts.
•       Emerging markets have long born the burden of rising coronavirus, but this is also now re-emerging in areas where it had receded. Governments in the
        main continue to ease restrictions. Q3 will post a material rebound, but the outlook for Q4 is more cautious, particularly where fiscal support has faded.

Investment strategy: Within a realm of ballooning debt levels and ambitious earnings expectations
•       FX: The risk on/risk off focus that dominated the first half of the year is finally receding and, post-Covid, value strategies arise. Yen well positioned amid
        dollar weakness as focus turns to fundamentals while Sterling pained by Brexit negotiations uncertainty.
•       Rates: Euro Sovereigns have returned 3.3% YtD with a rather uniform performance between member states (e.g. Italy 4.3%, France 3.5% and Germany
        2.3%). However, we should also be aware of risk factors that might raise the level of alert at any time, liquidity, complacency, fundamentals.
•       Credit: Returns have overcome the Covid shock and downgrades and defaults are slowing, The risk is a second round of lockdowns and a relapse in
        economic activity that brings about a second wave of corporate stress, accelerating downgrades/defaults to the detriment of credit portfolio returns.
•       Equity: Earnings revisions have been trending upwards after troughing in May and are now in positive territory in the United States. Policy support
        remains key with both a monetary and fiscal put in place but ditto for the need to remain selective, given the high degree of uncertainty.

    1
Central scenario
Summary – Key messages
Monetary policy
Inflation Central banks globally pushed Fiscal policy
beyond 2008 envelope. Only
It is hard to consider a more marginal additional easing from Questions of whether to extend
deflationary shock. Policy here. Fed backstopping most fiscal support, as momentum of
should bolster demand ahead. markets, ECB steps beyond limits economic recovery likely to fade
FX could temper localised into the winter
disinflation in US and some EM.
Growth Emerging Markets
Our central scenario:
We forecast -4.2% global growth Virus is playing out more across
in 2020. Q3 will include strong Coronavirus sparks severe EM’s now, with re-emergence in
rebounds, but growth will slow recession in most economies some areas, Latam cases have
thereafter We forecast global growth to fall in receded
2020 to -4.2%.
Economic rebound depends on policy, FX
Rates labour market reaction and
indebtedness. As well as the virus itself. USD has found support around low
Asset purchases by central banks
should offset pressures from levels. Euro’s rise has paused under
massive fiscal policy expansion, ECB scrutiny. Brexit weighs on GBP.
keeping yields in a range
Credit Equities
The sharp reduction in spreads Earnings expectations may be
after massive central bank optimistic. Containment of
intervention is now at odds with pandemic a necessary condition
fundamentals – a risk for rebound to be sustained
2Alternative scenarios
Summary – Key messages
Persistent recession (probability 35%) Fast recovery (probability 10%)
What could be different? What could be different?
- Virus-shock fractures key labour markets leading to significant - Virus contained quickly and policy stimulus results in a “V-
global job losses dampening demand even as virus fades. shaped” rebound
- Coronavirus outbreak proves more persistent. - Labour market recovers, economies benefit from post-virus
- Scale of shock results in isolationist policies: trade wars and euphoria
other geo-political tensions, echoing 1930s - Virus-shock reshapes business practice, boosting productivity
What it means What it means
- Growth/inflation expectations weaken further, a new depression - Global/US/EMU growth surprise on the upside in a stronger and
threatens, corporates’ earnings under more pressure more persistent rebound after the drop in Q2 GDP
- Further monetary policy where space permits (including China). - Monetary policy fights expectations for swift tightening through
Government’s continue with fiscal stimulus and divide between forward-guidance
monetary financing blurs further.
Market implications Market implications
- Risk appetite deteriorates / equities sell off / credit widens - Risk-on environment with equities recovering losses swiftly
- Safe-haven rates rally resumes - UST and EUR break-evens rise
- EM debt to come under pressure - Spreads rally from wides
3RISk Radar
Summary – Key messages
Global – Trade and China – continued
Global pandemic currency wars deleveraging hard landing
Unemployment Global – Limited monetary and Breakdown in global
proves sticky fiscal room to fight next recession cooperation
Global – Liquidity Global – End of QE Japan – Current
Financial Risks disruptions tantrum account crisis
US – Corporate Europe – Sovereign
leverage debt crisis repeat
US – China tensions UK – WTO Brexit Global – Rise of populism
re-emerge
US – Election
concerns Italy – Political risk
Short term Long term
4Contents
1. Theme of the month P.06
2. Macro outlook P.12
3. Investment Strategy P.25
4. Forecasts & Calendar P.32
5Theme of the month
Theme of the month: US Elections
 Biden in poll position

 Biden’s polling more consistent
     - Democrat Presidential candidate Joe Biden has maintained a healthy lead in national polls. His lead rose sharply in the wake of the
                coronavirus impact in the Spring and although it has retraced a little since the summer, it remains above the breakeven level we
                estimate necessary to deliver a majority at the electoral college. A key feature of Biden’s lead has been its consistency, particularly
                compared to Clinton’s in 2016. We believe that this reflects President Trump being less of an unknown quality this time around.

 The race becomes more than the Trump show
     - For most of this year, Biden’s lead over the President has largely (inversely) reflected broader public opinion on the President.
                However, more recently the President’s approval rating has risen, but Biden’s lead has not retreated by as much. As activity
                continues to improve towards year-end we suspect that the polling lead could shrink further.

 Biden’s lead over President Trump has softened, but remains                               Correlation between poll lead and President’s approval weakens
Democrat candidates leads over Trump                                                       Trump's approval ratings and polling deficit
                                                                                          % (20 poll rolling average)                               ppt (5 poll average)
ppt (5 poll average)                                              2016 - Clinton          47                                                                         0
12                                                                2020 - Biden                            Trump approval
                                                                                          46                                                                         -2
                                                                                                          Polling deficit to Biden (RHS)
10                                                                                        45                                                                         -4
 8                                                                                        44
                                                                                                                                                                     -6
 6                                                                                        43
                                                                                                                                                                     -8
                                                                                          42
 4                                                                               Electoral
                                                                                           41                                                                        -10
                                                                                 College
 2         2016 result                                                           breakeven 40                                                                        -12
 0
                                                                                          39                                                                         -14
     600         500         400       300         200           100         0
                              days before election                                         Feb-19      May-19      Sep-19      Dec-19      Mar-20     Jun-20
     Source: 538, National Progress enter and AXA IM research, Sep 2020                    Source: 538 and AXA IM Research, Sep 2020

 7
Theme of the month: US Elections
State-by-state is where it counts
Fighting the last war?
- US elections are not won or lost on a national scale, but in key marginal States. Polling in the 2016 battleground states continues
to favour Biden, although again leads have narrowed a little in recent weeks. In 2016, polls in some of these states recorded large
error margins. Assuming these error margins are not repeated, polling suggests Biden should reverse most of President Trump’s
gains from 2016. However, other States are now becoming more competitive.
Probabilities suggest a Biden Presidency
- A more comprehensive review of State polling presents a range of States that could be competitive this time around. Current
polling suggests that Pennsylvania could be the marginal state to deliver an Electoral College majority. The Economist predicts a
Biden Presidency as around 70% likely. The pollster 538 suggests a more cautious probability around the 60% mark. We continue
to expect Joe Biden to win the Presidential vote in November.
Biden leads in 2016 battleground states The Economist probability estimates by State
Biden's polling leads in states lost in 2016 ppt (5 poll average) Economist's estimated probabilities of Biden winning
dots = respective state 16 % key states
100
election result in 2016 12 90
80 Electoral college
8
70
4
60
0 50
40
-4
30
Florida Iowa Michigan -8 20 MI NV NH WI PA
Ohio Pennsylvania Wisconsin 10 FL NC AZ OH GA
-12 IA TX
0
600 500 400 300 200 100 0
days before election Mar Apr May Jun Jul Aug Sep
Source: 538 and AXA IM Research, Sep 2020 Source: The Economist, and AXA IM Research, Sep 2020
8Theme of the month: US Elections
Congressional race to determine scope for either President’s agenda
Race for the House: likely Democrat majority
- The Democrat lead in national polling is more likely to be reflected in the House of Representative elections, where all of the seats
are contested. The House returned a Democrat majority in 2018 after the Mid-Term Elections, with 232 seats versus 198
Republican (1 Libertarian and 4 vacant seats account for the rest). A narrowing of Biden’s national lead could reduce potential
gains, but the question is likely whether the Democrat majority will be bigger or smaller than before.
Senate race is too close to call
- The current Senate split is 53 Republican and 45 Democrat (2 independents caucus with Democrats). With Democrats considered
likely to lose Alabama, current polling suggests that the 35-seat race will be tight, suggesting that 50-(48+2) is conceivable. This
would give Democrats control by virtue of the influence of the Vice President, but by the flimsiest of margins. A further Republican
rally from here – particularly if President Trump were re-elected – would likely see Republicans retain the Senate majority.
Will elections change the current mixed Congress? Senate polling tentatively correlated with national polls
House race Senate race
Spread of senate forecasts compared to national polls
seats
60 Lean Republican
Republican within margin of error
Democrat within margin of error
Lean Democrat
55
50
Republicans uncontested 45
Republicans
Democrats
Democrats uncontested (incl. 2 independents)
40
Other
5 6 7 8 9 10
Biden's national polling leads
Source: : 538, 270towin, Daily Kos, real Clear Politics, Sabato and AXA IM Source: 538, 270towin, Daily Kos, real Clear Politics, Sabato and AXA IM
Research , Sep 2020 Research, Sep 2020
9The elections
Policy implications – Biden proposals
Spending measures Tax raising measures
Infrastrucure - $1.3 trn over 10 years - Top rate income federal tax rise to 39.6% from 37%
- $400 bn on clean energy research/innovation - Increase social security tax on earnings >$400k
- $100 bn to modernise schools - Impose standard income tax rate on capital gains and
- $50 bn roads, bridges and highways dividends on those earning over $1m
- $20 bn rural broadband
- $10 bn transit projects for high-poverty areas - Increase corporate tax rate to 28% from 21%
- Double tax on profits of foreign subsidiaries by raising GLTI
Climate Change - $1.7 trn over 10 years rate to 21%
- Leveraging funding from additional partners, targeting $5 trn - Introduce an Alternative Minimum Tax based on 15% of
- Net-zero emissions no later than 2050 book income
- Rejoin the Paris Accord
- Tax Policy Center estimates measures will:
Healthcare - Raise c. $4 tn over next decade
- To insure 97% of Americans, est. cost $750 bn over decade
- Lower Medicare eligibility age to 60 from 65 - 93% of increases expected to fall on top 20%
- Reduce limit on cost of coverage to 8.5% - 74% on top 1%
- Eliminate 400% tax credit eligibility - 46% on top 0.1%
Housing - $640 bn - Top 20% face a 5.7% reduction in after-tax income
- Top 1% - a 17% reduction
- Top 0.1% - a 23.4% reduction
Labour market
- Raise minimum wage to $15/hour from $7.25
- Temporary visa reform
- Increase employment-based green cards
- Boost short-time work programs
10Theme of the month: US Elections
A contested election?
Policy agendas
- Joe Biden was a moderate in the Democrat Primaries. However, his agenda is the most progressive suggested since the 1960s. His
plans to raise $4trn in taxes over a decade to boost infrastructure and Green investment would likely deliver a long-term boost to
US potential GDP growth. However, markets may recoil from the increased taxation. President Trump’s second-term agenda is not
clearly defined. Fiscal stimulus, another tax cut package, infrastructure and trade policy are likely to be on the agenda .
Delay is inevitable, but confusion may mount while we wait
- The chances of a swift election result are low. Mail-in voting, which accounted for 25% of the 2018 Mid-Term elections, looks set
to account for a far higher proportion given ongoing virus precautions. This will delay the result (in 2018 the Arizona count, with
78% votes by mail, took one week). However, with President Trump alleging that mail-in voting increases the scope for electoral
fraud – there is no evidence of this – the scope for judicial challenge is high, particularly if the on-the-night count is close.
President Trump’s 2020 Budget indicates second-term agenda Markets braced for a contested election
Changes to funding in Trump's pre-COVID budget % VIX futures term structure
Commerce
EPA 32 Points
State and USAID
HUD
30
Transportation 28 2020 election
Interior
26 volatility spike
Labour
Health & Human Services 24
Education
Energy
22
Agriculture 20
Justice
Defence
18
Treasury 16
Homeland Security
NASA
14
Veterans Affairs Spot Sep Oct Nov Dec Jan
-40 -30 -20 -10 0 10 20 2020 2016 2012 2008
Source: Sep 2020 Source: CBOE, Bloomberg, AXA IM Research, Sep 2020
11Macro outlook
US to post record Q3 after getting virus under control
US

Recovering from the virus
    - From late July increased social restrictions particularly in US Southern states helped to rein in the re-emergence of the virus. This
                was achieved with a minimal attenuation in activity. In total, Q3 looks set to post the strongest quarterly growth on record (we
                forecast 20% annualized) – albeit materially less than was lost during the deepest contraction on record in Q2 (-31.7%).

Pace to soften into Q4
    - The pace of recovery looks set to soften into Q4. High frequency data have recorded some softening at the end of Q3. Moreover,
                we are concerned about a deceleration in household income in the short-term reflecting the cessation of the boost to
                unemployment benefits and in the medium-term from the decelerating improvement in the labour market. We still expect a
                $1.5trn stimulus package to support Q4 activity – but in its absence, the deceleration of growth could happen much more quickly.

 US regains control of virus spread                                           High-frequency data see modest softening in latest weeks
 US states with increasing COVID-19 cases                                     Fed Weekly Economic Index forecasts
 100%                                        weighted by GDP                  ppt ann
                                                                                  4                                                               Forecast
  80%                                                                             2
                                                                                  0
  60%                                                                            -2
                                                                                 -4
                                                                                                  1. Ini tial rebound as US                       3. Acti vi ty res umes
  40%                                                                            -6               opens up quickly                                previ ous recovery ra te
                                                                                 -8
  20%                                                                           -10
                                                                                                                 2. Softening i n a ctivi ty as
                                                                                -12                              vi rus flares i n South
     0%                                                                         -14
          Feb      Mar     Apr     May       Jun     Jul       Aug   Sep          Feb-20        Apr-20          Jun-20             Aug-20            Oct-20
 Source: USA Facts, BEA, AXA IM Research, Sep 2020                            Source: FRBNY, AXA IM Research, Sep 2020

13
Rebound to slow over coming quarters
US
Growth rates disguise subdued activity
- A strong recovery in Q3 looks set to disguise a still depressed level of activity, with even consensus levels of growth in Q3 still seeing
GDP 5% lower than at the start of the year. However, signs of a faster than expected bounce in Q3 have been consistent with an
improvement in the consensus estimates for 2020. Our own forecasts remains at -4.7% for 2020 and +4.6% for 2021, but with
increasing data suggesting some shift in growth from Q3 into Q4, we may fine tune annual figures over the coming months.
FAIT accompli
- The Federal Reserve followed the path we thought it had laid out before the summer. At the virtual Jackson Hole conference, Fed
Chair Powell announced changes to the Fed’s Long Term Goals, including a shift to average inflation targeting and rate adjustments
that would only react to shortfalls in employment from maximum levels. In its latest meeting the Fed announced explicit forward
guidance, based additionally on labour market criteria, that suggested the Fed would not raise interest rates before 2024.
Outlook for US economy brightens Average inflation target to keep Fed Funds Rate at floor
Evolution of GDP forecasts
% yoy
6
4
2
0
-2
-4 AXA IM 20 BBG Cons 20
AXA IM 21 BBG Cons 21
-6
Nov-18 Apr-19 Sep-19 Feb-20 Jul-20
Source: Bloomberg, AXA IM Research, Sep 2020 Source: Federal Reserve Bank (FRB), Sep 2020
14Turning sour…
Euro area
Concerning pandemic developments…
- The speed of the virus propagation is increasing sharply: Spain and France are the main hotspots. Granular data show a shift in the
age distribution (number of cases for older people up significantly) and together with higher ICU occupancy and fatality rates (albeit
still well below March/April levels), call for caution.
- Governments are taking actions (region of Madrid restricting mobility, use of mask becoming mandatory at some local levels in
France, stricter travel provisions in Germany, Italy, Belgium). But these partial lockdowns are still less stringents than the past ones.
…While signs of the recovery plateauing are accumulating
- After a record collapse in Q2 GDP (-11.8% qoq), euro area GDP is on track to bounce back by 8.9% qoq in Q3.
- But the recovery is losing steam. Euro area retail sales paused in July, annual growth in car registrations turned negative and IP still
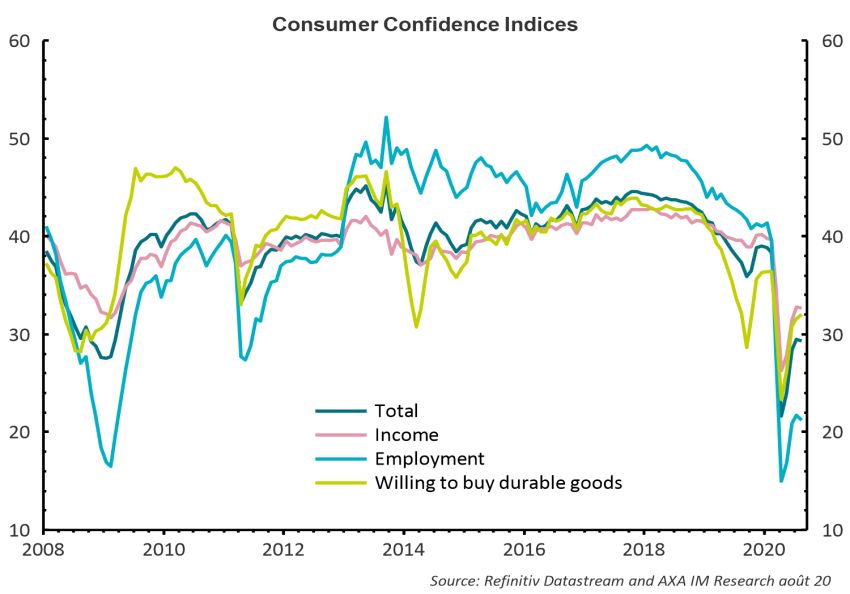
stands c.7% below its pre-COVID level. Demand weakness seems to be the main supply-side constraint, while consumer confidence
failed to improve amid virus risks and uncertain employment prospects. We see Q4 GDP slowing to 2.5% qoq, with 2020 euro area
average at -7.7% yoy.
Europe is closing the gap with the US The recovery is losing steam: it is looking like a swoosh
Source: World Health Organisation (WHO) and AXA IM Research, September 2020. Source: Datastream and AXA IM Research, September 2020.
15… Means there is no room for complacency
Euro area
Recovery and Resilience plans in the making…
- Countries are starting to work on their 2021 budget and Recovery and Resilience plans. As per EC guidelines, the latter should include
a minimum level of 20% of expenditure related to digital and respects the 37% climate mainstreaming target.
- France has allocated EUR30bn of its EUR100bn to the green transition and expects 40% of the plan to be financed by the Recovery
and Resilience Facility. The process might be more challenging in Spain due to political fragmentation, while the RRF conditionality
(funds disbursed when targets met) could be a powerful incentive-mechanism to boost Italy’s potential growth.
…While ECB monetary policy support remains critical
- September ECB core inflation forecasts have been upgraded, on the back of better policy mix (fiscal finally contributing). But don’t be
fooled by the upgrade, ECB board members keep repeating there is no room for complacency: the ECB finger is on the buzzer.
- This reinforces our view that the ECB will do more, with a time and quantum extension of the PEPP in December. A key reason is that
faced with higher public debt issuance next year, the ECB will have to provide more accommodation in the form of more QE: this is
the price to pay for fiscal policy helping to bring inflation back to the central bank’s target.
EC Recovery and Resilience Facility grants allocation A better policy mix propping up ECB core inflation forecasts
EUR BN % of 2019 GDP 2.1 % yoy ECB HICP excl energy and food forecasts
30% allocation 30% allocation 1.9
70% allocation - illustrative* 70% allocation - illustrative*
1.7
(2021-2022 (2023 (2021-2022 (2023
commitment) commitment) commitment) commitment) 1.5
Italy 44.7 20.7 2.5 1.2 1.3
Spain 43.5 15.7 3.5 1.3
1.1
France 22.7 14.7 0.9 0.6
Poland 18.9 4.1 3.6 0.8 0.9
Germany 15.2 7.5 0.4 0.2 0.7
Greece 12.6 3.6 6.7 1.9
0.5
Romania 9.5 4.3 4.3 1.9 06 07 08 09 10 11 12 13 14 15 16 17 18 19 20 21 22
Portugal 9.1 4.1 4.3 1.9 Actual Jun-19 Sep-19 Dec-19 Mar-20 Jun-20 Sep-20
Source: EU Commission, AXA IM Research, September 2020. *Illustrative based Source: ECB, AXA IM Research, July 2020.
on 2020 EC summer forecasts.
16As good as it gets
UK
Fast data point to Q3 rebound
- July recorded a 6.6% rise in monthly GDP after a strong 8.7% increase in June. August looks set to post another bumper month
with an Eat-Out-to-Help-Out scheme lifting restaurant spending and many Britons holidaying onshore. The BoE estimates that
consumer spending had recovered pre-Covid levels, albeit with a shift in composition. A sharp pick-up in housing activity also
promises further support over the coming months.
Outlook worsens beyond
- Yet the outlook is worsening. The virus is picking up sharply again in the UK and will affect economic activity, even if government
restrictions fall short of those seen in Q2. Moreover, for now, the furlough scheme is being phased out and will expire by the end
of October, reducing incomes for workers in virus-affected sectors. Finally, Brexit uncertainty continues to threaten business
investment. We forecast UK GDP growth of -10.0% in 2020, before rebounding by 7.5% in 2021. However, if current trends persist
a better 2020 may be offset by a softer 2021.
Activity proxies suggest further strong pick-up in August Rebound in retail activity to drive consumption recovery in Q3
'Fast' data proxies for economic activity
GDP index TWh
Google mobility (rebased, ex parks and resid, LHS) 1.45
120
Apple mobliity (rebased, LHS) 1.4
100 Electricity (adj, RHS)
1.35
80 1.3
60 1.25
1.2
40
1.15
20 1.1
0 1.05
Jan-20 Mar-20 May-20 Jul-20
Source: Apple, Google, National Grid, ONS, AXA IM Research, Sep 20 Source: ONS, AXA IM Research, Sep 20
17Policy expectations weigh on markets
UK
More BoE stimulus ahead, QE – expected, but not negative rates
- The BoE left its policy unchanged in September, noting better-than-expected momentum for Q3, but risks ahead. Current QE is
expected to expire “around the turn of the year”. We expect this to be extended in Q4, most likely with a further £75bn in
November (this could come later in December). The Bank is also reviewing how to implement negative rates. On balance, we do
not think expect additional stimulus next year. But if it does, a technical change to the TFS could underpin negative market rates.
Brexit - the final countdown, again.
- Negotiations towards a UK-EU trade deal continue. Fisheries and state subsidies remain the outstanding issues – items that
oughtn’t be insurmountable. PM Johnson has announced he would walk away from further discussions if agreement is not
reached by the 15 October EU Summit. The UK have also introduced an Internal Markets Bill that threatens to re-write parts of the
Withdrawal Agreement. We consider this part of the negotiations and still expect a deal by year-end, but the outlook is uncertain.
UK markets consider negative rates from the BoE Sterling slips on renewed Brexit tensions
Source: Bank of England, Refinitiv, AXA IM Research, Sep 2020 Source: Refinitiv, AXA IM Research, Sep 2020
18Recovery gains more balance and steam
China
Growth accelerates as recovery becomes more broad-based
• August activity beat market expectations across the board, suggesting that China’s economic recovery has gained strength, depth and
breath. Industrial production growth accelerated to 5.6%, returning to the pre-crisis level faster than market expectations. While export
growth delivered another positive surprise, the bright spots were in domestic demand with private consumption and investment all picking
up strongly, creating a more balanced growth dynamic
Consumer spending and private investment finally catch up
• Retail sales grew on a year-on-year basis for the first time in 2020. Besides solid stable goods sales, discretionary spending on clothing,
cosmetics, mobile phones and autos also increased strongly in August, thanks in part to easing fears about the pandemic and improved
labour market conditions. Manufacturing investment growth also turned positive for the first time supported by recovering demand,
improved profitability and easier credit conditions
Industrial output growth back to pre-crisis rate Retail sales finally exit recession
Source: CEIC, AXA IM Research, Sep 20 Source: CEIC, AXA IM Research, Sep 20
19Continued recovery supports policy fine-tuning
China
Strong data reduces the odds of further monetary easing
• Beijing will likely take the positive economic data as a validation for further fine-tuning monetary policy back to neutral. The chance for
additional aggregate easing, such as RRR and interest rate cuts, has subsided, with the official attention increasingly shifted to any
emergence of financial imbalances. The recent tightening of housing market policy suggests that Beijing is trying to strike a fine balance
between economic growth and macro stability
Balance of risks shift to the upside
• We expect fiscal easing to proceed as planned, with the large bond issuances in August providing a solid backing for future infrastructure
investment. More policy nurturing is also needed to cement the recovery in the private sector. We continue to see GDP growth
accelerating to 5-6% in Q3 and Q4, and full year growth at 2.3%, but with the balance of risks now tilted to the upside
Infrastructure investment supported by fiscal easing The need for aggressive monetary easing declines
Source: CEIC, AXA IM Research, Sep 20 Source: CEIC, AXA IM Research, Sep 20
20PM Suga nominated to pursue Abe’s policies
Japan
What we do know about him
• Shinzo Abe – Japan’s longest serving PM for decades - resigned suddenly on health grounds over the summer. His replacement PM
Suga’s economic has pledged continuity in the economic agenda for now and may turn to the polls to secure his own mandate soon.
• On the economic side:
- Structural reform will be a priority, focusing on digitalization and on administrative and regulatory reform;
- He also favors regional bank consolidation and regional revitalization;
- On fiscal policy, he was opposed to any consumption tax cut, but has ruled out any further VAT changes over the longer-term.
• On the monetary policy side:
- The relationship between the Ministry of Finance and the Bank of Japan will persist as PM Suga supports the set of measures
implemented during the crisis.
Term of office of successive PMs from 90s
Approval / Disapproval rate for Abe’s Cabinet Term of office of successive PMs from 90s
Kaifu : Aug 1989 - 2.2y
Miyazawa : Nov 1991 - 1.8y Median : 1.3y
Hosokawa : Aug 1993 - 0.7y Average : 2.0y
Hata : Apr 1994 - 0.2y
Murayama : Jun 1994 - 1.5y
Hashimoto : Jan 1996 - 2.6y
Obuchi : Jul 1998 - 1.7y
Mori : Apr 2000 - 1.1y
Koizumi : Apr 2001 - 5.4y
Abe : Sep 2006 - 1.0y
Fukuda : Sep 2007 - 1.0y
Aso : Jun 2008 - 1.2y
Hatoyama : Sep 2009 - 0.7y
Kan : Jun 2010 - 1.2y
Noda : Sep 2011 - 1.3y
Abe : Dec 2012 - 7.7y
Source: Kyodo, AXA IM Tokyo FI, Sep 20 Source: Cabinet Office, AXA IM Tokyo FI, Sep 20
21The recovery is facing some headwinds
Japan
A mechanical rebound is occurring but it should not hide the weakness of the recovery
The recovery remains the weakest among developed economies, both on supply and demand fronts.
- Industrial production is progressing but remains at -15%yoy in July
- Retail sales fell to -2.9% yoy in July, while August’s household spending points to a decline of -7.6% yoy. Consumer confidence has
stabilised since June, but at very low levels, led by uncertainties on employment.
The Bank of Japan kept its monetary policy unchanged
For the time being, BoJ measures seem to be effective:
- 10Y JGB yields remain in the prescribed range [+/- 0.2%];
- bank lending remains dynamic (+6.8% YoY)
On the other side, we are sceptical of the BoJ’s inflation commitment as it does not seem sufficiently concerned about the rising risks
of falling back into deflation.
Consumer confidence remains stuck at low level Core CPI turns back in negative territory
22COVID-19 active in EM
Emerging Markets
The COVID-19 outbreak is unfolding in EM
- Since the beginning of June, statistics have been showing a steady deterioration for emerging countries compared to developed (DM).
The DM/EM ratio of total infection cases has halved to 0.6x from 1.3x and adjusted for the number of inhabitants, the ratio decreased
even more abruptly to 3.5x from 8.1x.
- Geographically, Latin America was the hotspot of the pandemic at the start of the summer; while the number of infections remains
elevated, it has been rising less aggressively in the past weeks. Meanwhile, the epidemic appears to have re-accelerated in other EM
regions, Asia in particular – with India a particular concern.
- Yet, mobility restrictions continue to be relaxed at a similar pace to developed markets and by the same arithmetic, financial markets
and currencies have broadly stabilized for now.
COVID-19 pandemic still active across EM… … and spreading at a faster pace than in DM space
23 Source: Datastream, AXA IM Research calculations, Sept 16, 2020A “swoosh” recovery in EM as well
Emerging Markets
The pandemic shock has dwarfed preceding recessions across the EM complex
- The global lockdown caused a significant contraction of activity, in various scale. Among major EM economies, Taiwan and South Korea
fared best with more controlled exposure and hence less stringent lockdown measures imposed since the start of the year, with
growth nevertheless contracting versus a year ago. Tourist dependent countries such as Thailand were additionally hit by a very poor
summer season. Export-oriented economies suffered demand falls from Western countries, as visible in Central Europe. The size and
the timing of the government spending packages also made a difference. The sudden stop in economic activity resulting from
nationwide lockdowns led to both a supply-side and a demand-side shocks. These were particularly strong in India and have resulted
in broad-based contraction in Indian GDP.
Q3 technical rebound granted, but the Q4 recovery needs more fiscal support
- Central banks across the world have reduced policy rates, the scope for further rate cuts appears to be almost exhausted. The use of
more unorthodox monetary policy tools, such as QE, may increase but EM institutions may think twice before embarking that way.
Fiscal policy is expected to do the heavy lifting but easing space varies among countries.
A reckless second quarter Traditional monetary policy running out of steam
Source: Refinitiv Datastream, AXA IM Research, Jul 20
24Investment Strategy
Multi-Asset Investment views
Our key messages and convictions

                                           #1
 Positive on equites                       The growth rebound,                                  Positive on
                                           positive economic surprises,
                                           ultra loose monetary policy
                                                                          #2                    Investment Grade
                                                                                                Credit
                                           and positioning remain         Unprecedented
                                           supportive for risky assets    support from both
                                                                          fiscal and monetary
                                                                          authorities
                                                                          supportive of
                                      #3                                  valuations
                                   Monetary arsenal
                                      adds material
 Positive US
                                       support to
 Sovereign Bonds                     bonds; Federal
                                   Reserve indicated
                                                             #4
                                    it will retain full      Concerns over a second              Long Volatility
                                     flexibility well        wave of COVID-19 virus and
                                        into 2023            political risks generate
                                                             higher volatility

 Source: AXA IM as at 20/09/2020

 26
FX Strategy
Yen well positioned amid dollar weakness - Sterling pained by Brexit
• The risk on/risk off focus that dominated the first half of the year is finally receding and post-Covid value strategies arise. By
bringing global interest rates to zero over the long term, central banks have undermined the carry strategies that dominated in
2018-19. Markets are left to ponder fair value and structural strengths and weaknesses.
• On this front, the USD has more room to fall from a broadly overvalued starting point. Slowly but surely, JPY is looking more
attractive. Although it underperformed vs risk-on currencies recently, it has already initiated an appreciation trend against USD.
• We have been expecting UK-EU negotiations to weigh on GBP in Q3. Implied volatility has already repriced, but we think there is
room for it to rise a little further. While we think that the UK government will ultimately achieve a deal, this will probably come
at the last minute once again, near October’s EU summit, triggering a sharp relief rally.
Value strategies are making a come back Currencies undervalued vs USD across the board, JPY cheapest
Source: Bloomberg and AXA IM Research, Sep 2020 Source: Bloomberg and AXA IM Research, Sep 2020
27Rates Strategy
Risk factors to consider amid calm Euro govie bond markets: liquidity, complacency, fundamentals
• Year-to-date, Euro Sovereigns have returned 3.3% with a rather uniform performance between member states (e.g. Italy 4.3%,
France 3.5% and Germany 2.3%). However, we should also be aware of risk factors that might raise the level of alert at any time.
• Secondary market liquidity is measured across several dimensions like turnover, depth, bid-ask spreads, latency etc. Looking at
volumes, we note how Bund contracts have reached new lows for Sep-20 expiry. Non-conventional monetary policy is having a
significant impact on EGB liquidity as the ECB absorbs both supply and risk from the market.
• Volatility is back to pre-Covid levels, likely reflecting an improved investor sentiment on the back of the pathbreaking Resilience and
Recovery Plan agreement. Risk of complacency amid slim liquidity can lead to outsized volatility spikes.
• Debt-to-GDP ratios close to or above 100% are no longer unusual but require a closer co-ordination between monetary and fiscal
policy as a necessary condition to ensure the sustainability of this economic model.
Material duration extraction in the EGB markets by the ECB Debt-financed growth will weigh on sovereign balance sheets
iBoxx Eurozone Sovr Risk Cumulated Budget Deficits (Eurostat)
10%
5.5
EUR bn per basis point 0%
5.0 -10%
4.5 Index dv01 -20%
Index dv01 (ex-ECB PSPP & PEPP) -30%
4.0
-40%
3.5 -50%
3.0 -60% France
-70% Germany
2.5
-80% Italy
2.0 Spain
-90%
1.5 -100%
2009 2010 2011 2012 2013 2014 2015 2016 2017 2018 2019 2020 2008 2010 2012 2014 2016 2018 2020 2022
Source: ECB, Markit and AXA IM Research, 18 September 2020 Source: Bloomberg and AXA IM Research, Jun 20
28Credit Strategy
Credit returns have overcome the Covid shock and downgrades and defaults are slowing, but …
• The Covid shock has been unprecedented in most aspects of macroeconomic and market impacts. So too in credit, where the widening
in spreads has been the sharpest on record and the spread recovery has been equally remarkable. The post-Covid regime is likely to be
typified by a higher steady-state lower-bound for spreads, like post GFC.
• The remarkable rebound in credit is aptly reflected in its returns, where the recovery is starting to resemble previous, less severe,
bearish episodes. Spread carry should bring High Yield back into positive territory over the next 6 months.
• The negative rating migration wave is slowing and has been well absorbed by credit markets, largely due to the explicit support by
central banks globally through their asset purchase programs. Similarly, the pace of 12-month trailing defaults, while still rising, is
starting to slow, especially in the US which has seen c.4% of additional defaults during Covid (+1.6% in Europe).
The obvious risk is a second round of lockdowns and the associated relapse in economic activity that brings about a second wave of
corporate stress, accelerating downgrades and defaults to the detriment of credit portfolio returns.
Sharpest spread widening and spread recovery on record Defaults still rising but momentum is slowing – to peak in Q1 2020
USD IG spread history Moody's 12M trailing HY default rate US 8.7%
EU 3.4% 16%
US Covid +3.8%
EU Covid +1.6% 14%
400 US fcast 9.1%
12%
EU fcast 4.9%
10%
8%
6%
4%
40 2%
1997
1998
1999
2000
2001
2002
2003
2004
2005
2006
2007
2008
2009
2010
2011
2012
2013
2014
2015
2016
2017
2018
2019
2020
2021
2022
0%
2001
2002
2003
2004
2005
2006
2007
2008
2009
2010
2011
2012
2013
2014
2015
2016
2017
2018
2019
2020
2021
Spot pre GFC lows post GFC lows post Covid lows
Source: ICE and AXA IM Research, Sep 2020 Source: Moody’s and AXA IM Research, Aug 2020
29Equity strategy
Earnings momentum on the rise
• Earnings revisions have been trending upwards after troughing in May and are now in positive territory in the United States. The Q2
reporting season was encouraging with strong positive surprises. Dividend pay-outs have not been cut to the extent initially envisaged
suggesting that corporate fundamentals have been more resilient than expected at the onset of the crisis. In this sense, markets do appear
vulnerable to a growth disappointment given a rather optimistic economic rebound seems to be increasingly priced in.
• Consensus estimates signal that global earnings are expected to decline by 19.3% in 2020 and then rebound by 29.7% in 2021, implying that
EPS is expected to regain its 2019 high-water mark by end-next year. With the repricing in interest rates, relative to bonds, the earnings yield
gap is still arguably wide at 5% compared to the long-term average of 2.9% and in line with the post-2009 average which has been around
5.7%. Volatility is likely to remain elevated given the uncertainty surrounding the virus, lack of earnings visibility and the political landscape.
• Policy support remains a key tailwind with both a monetary and a fiscal ‘put’ well in place. We remain overweight equities in our multi asset
allocation framework. In the face of our constructive stance on the asset class, we acknowledge that selectivity remains key given the high
degree of uncertainty. Overall, we continue to believe that recovering activity, aggressive policy measures, subdued positioning and an ultra-
low hurdle rate in other assets should support equity markets in the medium term.
A “V shape” recovery in earnings revisions Looking across the valley
3M earnings revisions: US, Euro area & EM AC World earnings and bond yield gap (FY1/FY2 EPS)
% 10%
8
8%
3
-2 6%
-7 4%
-12 2%
US = 2.7%
-17
EM = -2.1% 0%
-22
Euro area = -4.2% -2%
-27
-32 -4%
2017 2018 2019 2020 1988 1992 1996 2000 2004 2008 2012 2016 2020
Source: Datastream, IBES and AXA IM Research, Sep 20 Source: Datastream, IBES and AXA IM Research, Sep 20
30Asset allocation stance
Positioning across and within asset classes
Asset Allocation Equities Fixed Income
Key asset classes Govies
Developed
Equities Euro core
Euro area
Bonds Euro periph
UK
Commodities ▼ UK
Switzerland
US ▲
Cash ▲
US
Inflation Break-even
Japan
US
Emerging & Equity Sectors
Euro
Emerging Markets
Credit
Europe Oil & Gas
Euro IG
Europe Telecoms US IG
US Euro HY
US Cons. Discretionary US HY
EM Debt
EM Bonds HC
Legend Negative Neutral Positive Change ▲ Upgrade ▼ Downgrade
Source: AXA IM as at 20/09/2020
31Forecasts & Calendar
Macro forecast summary
Forecasts

                                                                                                   2020*                        2021*
                          Real GDP growth (%)                             2019*
                                                                                          AXA IM           Consensus   AXA IM           Consensus
            World                                                           2.9            -4.2                         5.4
            Advanced economies                                              1.7            -6.4                         4.8
             US                                                             2.3            -4.7               -5.2      4.6                4.0

             Euro area                                                      1.3            -7.7               -7.9      5.2                5.7

                 Germany                                                    0.6            -5.3               -6.1      4.3                4.7

                 France                                                     1.3            -9.6               -9.6      7.4                7.2

                 Italy                                                      0.3            -9.7              -10.2      4.9                5.7

                 Spain                                                      2.0           -11.7              -11.7      6.9                6.9

             Japan                                                          0.7            -5.8               -5.3      3.1                2.5

             UK                                                             1.4           -10.0               -9.9      7.5                6.4

             Switzerland                                                    0.9            -6.5               -5.6      4.5                4.4

            Emerging economies                                              3.6            -3.0                         5.8
             Asia                                                           5.2            0.5                          7.2
               China                                                        6.1            2.3                2.1       8.0                7.8
               South Korea                                                  2.0            -2.8               -1.1      4.5                3.3

               Rest of EM Asia                                              4.4            -1.3                         6.5
             LatAm                                                          0.1            -6.5                         6.5
               Brazil                                                       1.1            -7.4               -6.2      8.3                3.2
               Mexico                                                      -0.1            -6.8               -9.6      7.0                3.6

             EM Europe                                                      2.1            -6.6                         5.7
               Russia                                                       1.3            -6.1               -5.1      3.7                3.4

               Poland                                                       4.1            -5.0               -4.1      5.4                4.5
               Turkey                                                       0.9            -5.6               -4.4      6.5                5.2
             Other EMs                                                      1.5            -4.2                         3.3
            Source: Datastream, IMF and AXA IM Macro Research − As of 23 September 2020

33
Expectations on inflation and central banks
Forecasts
Inflation Forecasts
2020* 2021*
CPI Inflation (%) 2019*
AXA IM Consensus AXA IM Consensus
Advanced economies 1.5 0.6 1.2
US 1.8 0.8 0.9 1.6 1.7
Euro area 1.2 0.4 0.4 0.7 1.1
Japan 0.5 0.1 -0.1 0.0 0.2
UK 1.8 0.7 0.7 1.5 1.4
Switzerland 0.4 -0.3 -0.7 0.3 0.2
Other DMs 1.8 1.4 1.9
Source: Datastream, IMF and AXA IM Macro Research − As of 23 September 2020
Central banks’ policy: meeting dates and expected changes
Central bank policy
Meeting dates and expected changes (Rates in bp / QE in bn)
Current Q4 - 20 Q1 -21 Q2-21 Q3-21
4-5 Nov 26-27 Jan 27-28 Apr 27-28 Jul
Dates
United States - Fed 0-0.25 15-16 Dec 16-17 Mar 15-16 Jun 21-22 Sep
Rates unch (0-0.25) unch (0-0.25) unch (0-0.25) unch (0-0.25)
29 Oct 21 Jan 22 Apr 22 Jul
Dates
Euro area - ECB -0.50 10 Dec 11 Mar 10 Jun 9 Sep
Rates unch (-0.50) unch (-0.50) unch (-0.50) unch (-0.50)
28-29 Oct 20-21 Jan 26-27 Apr 15-16 Jul
Dates
Japan - BoJ -0.10 17-18 Dec 18-19 Mar 17-18 Jun 21-22 Sep
Rates unch (-0.10) unch (-0.10) unch (-0.10) unch (-0.10)
5 Nov 4 Feb 6 May 5 Aug
Dates
UK - BoE 0.10 17 Dec 18 Mar 24 June 23 Sep
Rates unch (0.10) unch (0.10) unch (0.10) unch (0.10)
Source: AXA IM Macro Research - As of 23 September 2020
34Calendar of 2020 events
2020 Date Event Comments
September 29 Sep US First US Presidential debate
15 Oct US Second US Presidential debate
15-16 Oct UK/EU Crucial EU Summit
19 Oct China Q3 GDP
22 Oct US Third US Presidential debate
October
28-29 Oct BoJ Meeting Unchanged (-0.10)
29 Oct ECB Meeting Unchanged (-0.50)
29 Oct US Q3 GDP advance estimate
30 Oct Euro Area Q3 GDP flash estimate for EU19, France, Italy and Spain
3 Nov US Presidential and Congressional Elections
4-5 Nov FOMC Meeting Unchanged (0-0.25)
5 Nov BoE Meeting Unchanged (0.10), including Monetary Policy Report
November 11 Nov UK Q3 GDP first estimate
13 Nov Germany Q3 GDP flash estimate
15 Nov Japan Q3 GDP prel. estimate
21-22 Nov G20 2020 Summit, Riyadh
10 Dec ECB Meeting Unchanged (-0.50)
15-16 Dec FOMC Meeting Unchanged (0-0.25), including SEP
December 17 Dec BoE Meeting Unchanged (0.10)
17-18 Dec BoJ Meeting Unchanged (-0.10)
31 Dec UK/EU End of transition period
20 Jan US Presidential Inauguration
20-21 Jan BoJ Meeting Unchanged (-0.10)
January 21 Jan ECB Meeting Unchanged (-0.5)
26-27 Jan FOMC Meeting Unchanged (0-0.25)
February 4 Feb BoE Meeting Unchanged (0.10)
11 Mar ECB Meeting Unchanged (-0.50)
16-17 Mar FOMC Meeting Unchanged (0-0.25)
March
18 Mar BoE Meeting Unchanged (0.10)
18-19 Mar BoJ meeting Unchanged (-0.10)
35Latest publications
Preserving “Made in China” in deglobalisation
02 September 2020
US presidential election preview: You’re fired?
28 July 2020
July Investment Strategy – And after the summer?
22 July 2020
Natural language processing – a new tool to decode the Fed
16 July 2020
COVID-19 update: A disinflationary shock – Part 2
13 July 2020
COVID-19 update: A disinflationary shock – Part 1
10 July 2020
COVID-19 series: Judging international stimulus policy reactions to the COVID-19 shock (US, Ch, Jp, Ez)
25 June 2020
June Investment Strategy: The virus has not gone away
24 June 2020
36This document is for informational purposes only and does not constitute investment research or financial analysis relating to transactions in financial instruments as per MIF Directive (2014/65/EU), nor does it constitute on the part of AXA Investment Managers or its affiliated companies an offer to buy or sell any investments, products or services, and should not be considered as solicitation or investment, legal or tax advice, a recommendation for an investment strategy or a personalized recommendation to buy or sell securities. It has been established on the basis of data, projections, forecasts, anticipations and hypothesis which are subjective. Its analysis and conclusions are the expression of an opinion, based on available data at a specific date. All information in this document is established on data made public by official providers of economic and market statistics. AXA Investment Managers disclaims any and all liability relating to a decision based on or for reliance on this document. All exhibits included in this document, unless stated otherwise, are as of the publication date of this document. Furthermore, due to the subjective nature of these opinions and analysis, these data, projections, forecasts, anticipations, hypothesis, etc. are not necessary used or followed by AXA IM’s portfolio management teams or its affiliates, who may act based on their own opinions. Any reproduction of this information, in whole or in part is, unless otherwise authorised by AXA IM, prohibited. Neither MSCI nor any other party involved in or related to compiling, computing or creating the MSCI data makes any express or implied warranties or representations with respect to such data (or the results to be obtained by the use thereof), and all such parties hereby expressly disclaim all warranties of originality, accuracy, completeness, merchantability or fitness for a particular purpose with respect to any of such data. Without limiting any of the foregoing, in no event shall MSCI, any of its affiliates or any third party involved in or related to compiling, computing or creating the data have any liability for any direct, indirect, special, punitive, consequential or any other damages (including lost profits) even if notified of the possibility of such damages. No further distribution or dissemination of the MSCI data is permitted without MSCI’s express written consent. This document has been edited by AXA INVESTMENT MANAGERS SA, a company incorporated under the laws of France, having its registered office located at Tour Majunga, 6 place de la Pyramide, 92800 Puteaux, registered with the Nanterre Trade and Companies Register under number 393 051 826. In other jurisdictions, this document is issued by AXA Investment Managers SA’s affiliates in those countries. In the UK, this document is intended exclusively for professional investors, as defined in Annex II to the Markets in Financial Instruments Directive 2014/65/EU (“MiFID”). Circulation must be restricted accordingly. © AXA Investment Managers 2020. All rights reserved 37
You can also read