Birds and fish as bioindicators of tourist disturbance in springs in semi-arid regions in Mexico: a basis for management
←
→
Page content transcription
If your browser does not render page correctly, please read the page content below
Animal Biodiversity and Conservation 30.1 (2007)                                                             29

Birds and fish as bioindicators
of tourist disturbance in springs in
semi–arid regions in Mexico:
a basis for management

J. Palacio–Núñez, J. R. Verdú, E. Galante,
D. Jiménez–García & G. Olmos–Oropeza

Palacio–Núñez, J., Verdú, J. R., Galante, E., Jiménez–García, D. & Olmos–Oropeza, G., 2007. Birds and
fish as bioindicators of tourist disturbance in springs in semi–arid regions in Mexico: a basis for
management. Animal Biodiversity and Conservation, 30.1: 29–41.

Abstract
Birds and fish as bioindicators of tourist disturbance in springs in semi–arid regions in Mexico: a basis for
management.— Tourist disturbance in semi–arid springs was analysed; birds and fish were selected as
bioindicators. Media Luna spring is the biggest and most spatially complex system in the region, with the
highest biodiversity levels and tourist use. Areas with the highest bird species richness and abundances
showed highest structural heterogeneity and least direct human impact. No differences in species richness of
fish were observed between sectors and the most abundant species were found in the sectors least perturbed
by human activity. Factors that explained the bird distribution were the species´ tolerance to the effects of
direct tourism (noise and direct presence of people) and habitat quality, mainly riparian vegetation. Aquatic
vegetation condition was very important for fish. Six bird species and two fish species were relevant as
indicators of the habitat quality related to human impact. Anthropic disturbance such as tree plantation
favoured some bird species, whereas aquatic vegetation removal was favourable for some fish species, such
as the endemic Cichlasoma bartoni, however, both types of disturbance were unfavourable for other species;
riparian vegetation removal was negative for both groups. Controlled tourism promotes good conditions for C.
bartoni establishment. Efficient conservation measures such as limiting touristic distribution are necessary for
all species, especially for the fish community, in order to conserve biodiversity in general.

Key words: Wetlands, Species distribution, Threatened species, Endemism, Habitat loss, Spatial heteroge-
neity, Bioindicators.

Resumen
Aves y peces como bioindicadores de las alteraciones debidas al turismo en manantiales de zonas semi-
áridas en México: bases para la gestión.— Para analizar las alteraciones por el turismo en manantiales de
zonas semiáridas se utilizaron aves y peces como bioindicadores. Se seleccionó el manantial de la Media
Luna por ser el más grande y complejo, y por incluir la más alta biodiversidad y el mayor impacto turístico
en la zona. Los sectores con alta diversidad y abundancias de aves fueron los que tienen la mayor
heterogeneidad estructural y menor impacto humano directo. Las mayores abundancias de peces se
encontraron en los sectores menos perturbados sin diferencias para la riqueza de especies. Los factores
que explicaron la distribución de las aves fueron la tolerancia de las especies a los efectos directos del
turismo (ruido y presencia directa de gente) y la calidad del hábitat, principalmente la vegetación ribereña.
La condición de la vegetación acuática fue muy importante para los peces. Seis especies de aves y dos de
peces fueron relevantes como indicadores de la calidad del hábitat en función del impacto humano. Las
alteraciones antrópicas tales como la plantación de árboles favoreció a algunas especies de aves mientras
que la eliminación de la vegetación acuática fue favorable para algunos peces como el endémico
Cichlasoma bartoni, pero estas alteraciones fueron negativas para otras especies; la eliminación de la
vegetación ribereña tuvo efectos negativos para ambos grupos. El turismo controlado crea condiciones
favorables para C. bartoni. Para la conservación de la biodiversidad en general, se requieren medidas
eficientes de conservación tales como la restricción geográfica del turismo especialmente importante para
la comunidad de peces.

ISSN: 1578–665X                                                          © 2007 Museu de Ciències Naturals
30                                                                                   Palacio–Núñez et al.

Palabras clave: Humedales, Distribución de las especies, Especies amenazadas, Endemismos, Pérdida de
hábitat, Heterogeneidad espacial, Bioindicadores.

(Received: 6 IX 06; Conditional acceptance: 31 X 06; Final acceptance 7 II 07)

Jorge Palacio–Núñez & Genaro Olmos–Oropeza, Colegio de Postgraduados en Ciencias Agrícolas, Campus
San Luis Potosí, Iturbide 73, Salinas de Hidalgo, S. L. P., 78600, México.– José R. Verdú & Eduardo
Galante, Inst. de Biodiversidad–CIBIO, Univ. de Alicante, 03080 Alicante, España (Spain).– Daniel Jiménez–
García, Dept. de Ecología, Univ. de Alicante, 03080 Alicante, España (Spain).

Corresponding author: J. Palacio–Núñez, Inst. de Biodiversidad–CIBIO, Univ. de Alicante, 03080 Alicante,
España (Spain). E–mail: jpalacio@colpos.mx
Animal Biodiversity and Conservation 30.1 (2007)                                                             31

Introduction                                             was the Media Luna spring because it is the biggest
                                                         and the most representative spring in the Rioverde
Arid and semi–arid zones have limited water re-          valley, with high tourist affluence and biodiversity
sources. The few existing springs are usually iso-       (Miller, 1984; Palacio–Núñez, 1997). It includes sev-
lated, relict in nature, and in poor condition. They     eral bird species and some endemic fish species,
may contain endemic fish species with restricted         mainly the monospecific Cualac and Ataeniobius ge-
distribution, sometimes limited to a single spring       nus (Miller, 1984; Contreras–Balderas, 1969). Media
(Contreras–Balderas, 1969). Freshwater environ-          Luna was declared a State Park in 2003 due to its
ments are especially susceptible to modifications        biological importance and state of conservation
such as overexploitation, pollution and aloctone         (SEGAM, 2003), but more basic management and
species introduction, the main factors affecting         ecological research are required. This paper aims to
biodiversity (Cooperrider & Noss, 1994; Curtis et        determine the impact of tourism and management on
al., 1998). The increasing transformation that such      springs in semi–arid areas, using birds and fish as
environments are subjected to has negative conse-        bioindicators, and to propose suggestions for man-
quences for ictiofauna and riparian biodiversity in      agement strategies which should be followed in order
general (Mensing et al., 1998; Fu et al., 2003), as      to preserve biodiversity in such locations.
well as for local biodiversity (Angermeier &
Schlosser, 1995). An important source of distur-
bance is tourism. Tourism is an important means of       Methods
income in Mexico but it is causing increasing envi-
ronmental degradation in many places due to the          Study area
lack of planning and preventive measures.
Ecotourism strategies related to natural resources,      The Media Luna system is located in the Rioverde
participation of local people and visitor education      Valley, San Luis Potosí, Mexico (between X UTM:
(e.g. Boo, 1992; Ross & Wall, 1999; Burger, 2000)        393723 & 395317 and Y UTM: 2417647 & 2418070
must be established and adapted to the particular        coordinates, zone 14 N), at an average altitude of
conditions such as the Media Luna system. Media          1,000 m a.s.l. It is a complex of spring–lakes
Luna has been used increasingly by tourists since        (Media Luna and Los Anteojitos) and channels or
the 1950s (Michelet, 1996), leading to continuous        rivers with permanent water, two seasonal lakes,
disturbances and transcendental changes during           and flooding zones with lateral infiltrations which
the 1960s and 1970s with the introduction of exotic      maintain a wet environment at variable distances
fish and trees species (Palacio–Núñez, 1997).            from the source. This effect contrasts with the
    The state of an area’s conservation can be well      aridity of the plain. Media Luna is the largest spring
evaluated on the basis of bioindicators selected from    lake (with 15 springs) in the valley and consists of
previous data (Randall, 1992), but this is not usually   six spring craters that provide a constant flow of
possible for most protected ecosystems (Heino et         about 5,000 l s–1 crystalline thermal water (Miller,
al., 2005). Consequently, threatened or endemic          1984; Labarthe et al., 1989) that flows through
species, or other sensitive species are frequently       three main channels (fig. 1). These wetlands are an
used as indicators (Rubinoff & Powell, 2004). Differ-    important refuge for many aquatic and riparian bird
ent indicators cannot lead to the same responses         species (IIZD, 1994). A total of 13 sectors were
(Duelli & Obrist, 2003) and different combinations of    established for the lake and channels, according to
biological and ecological groups have been used          their vegetation and environmental variability, and
(Van Rensburg et al., 2000; Heino et al., 2005;          they are subject to variable anthropic pressure
Pineda et al., 2005). Birds (Pyrovetsi & Papas-          (Palacio–Núñez, 1997).
tergiadou, 1992; Browder et al., 2002) and fish             Riversides contain zones with dense and scarce
(Heino et al., 2005; Fu et al., 2003) are important      allochthonous woodland and other zones with native
groups as indicators as both have at least the follow-   vegetation dominated by Panicum bulbosum Kunth
ing points in common: 1) individual species are          and Andropogon glomeratus (Walt) BSP grasses
associated with singular habitats, 2) most are short–    (table 1). Riparian vegetation has previously been
lived species so any change in their composition         classified in a range between 0 (bare ground) to 5 for
may manifest shortly after a disturbance, and 3)         excellent conditions. Aquatic vegetation has been
some species groups can be used to develop habitat       classified between 0 to 3. This vegetation is highly
associations which are predictors of relative human      dominated by Nymphaea sp. and has two structural
disturbance levels, and both groups may be affected      forms: 1) big size plants with isolated bases and
by some tourist activities (e.g. Tershy et al., 1997;    floating leaves, and 2) small size plants with high
Higginbottom et al., 2003; Newsome et al., 2004).        population density, creating a close dense layer at
    Bioindicators most commonly used to estimate         leaf level (Palacio–Núñez et al., 1999).
effects of habitat transformation on biodiversity are
arthropods (Micó et al., 1998; Verdú et al., 2000;       Sampling design
Bestelmeyer & Wiens, 2001) or vertebrates (e.g.
Flather et al., 1997) such as birds (e.g. Fleishman et   Increasing relevance is being given to the use of
al., 2001), mammals (e.g. Lomolino et al., 1989) or      spatial scales as bioindicators and the effect of habi-
fish (e.g. Heino et al., 2005). The location we chose    tat structure on the dynamics of animal and vegeta-
32 Palacio–Núñez et al.
11 Woodland N
12 10
13
9
8
3 6
1 7 Aquatic vegetation
5
4
Plants with floating leaves
2 Wet and semi–wet
Small size plants
disturbed grassland
Undisturbed Bare ground
grassland
0 500 m
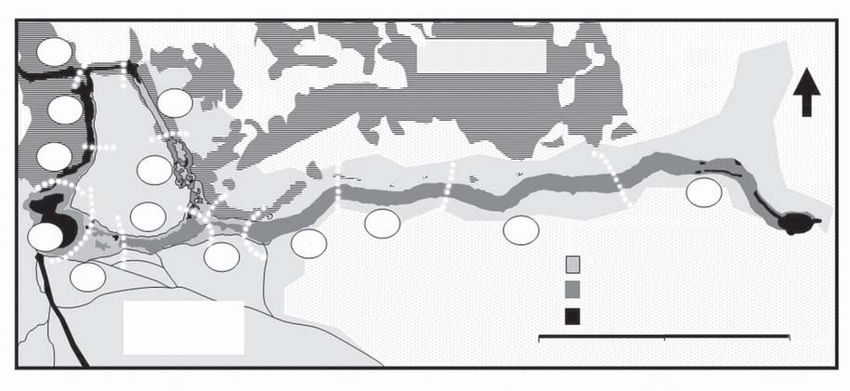
Fig. 1. Study area map with aquatic vegetation and adjacent grassland and woodland vegetation.
Circled numbers indicate sectors and white lines indicate sector limits.
Fig. 1. Mapa del área de estudio mostrando la vegetación acuática y la vegetación adyacente de
pastizal y de arbolado. Los círculos con número indican los sectores y las líneas blancas indican los
límites de los sectores.
tion populations, but bioindicators can only show summer 1998, winter 1998–99, and summer and
some environmental peculiarities (Duelli & Obrist, autumn 1999. We adapted the Finland transect of
2003). As bird and fish species in Media Luna have Järvinen & Väisänen (Tellería, 1986) for subaquatic
different origins, habitat requirements and risks of use in free diving, determining each transect as
extinction (table 2) they were used to seek the widest 10 m long and 2 m fixed width (20 m2). We traced
possible environmental representation. each transect with orange cord in a perpendicular
Bird sampling was carried out on monthly field position to the riparian line. We made three repeti-
visits between November 1996 and May 1997. tions per riverside, per sector.
Under seasonal variability and two conditions of
tourist presence, a single transect was repeated Biodiversity analysis
39 times across the entire 2,498 m distance cover-
ing all the Media Luna System sectors. Transect We constructed species–accumulation curves to
repetitions were made in an inflatable boat and we assess the adequacy of our sampling. Species–
counted the total number of birds observed through accumulation curves relate sampling effort to the
binoculars in each transect. The two cited condi- cumulative number of species to evaluate sampling
tions were based on visitor presence: without peo- effectiveness (e.g. Longino & Colwell, 1997; Gering
ple (WP, when there was nobody in the area), with et al., 2003). Species accumulation curves and
n = 24 transects, and with people (P, when there richness estimators (Chao 2, Jack 1 and ACE) were
were people present), with n = 15 transects. calculated using EstimateS 7.0 (Colwell, 2000).
Fish sampling considered three factors: 1) the The rarefaction technique corrects unbalanced
population of some fish species was very low so it sample sizes, the main problem in diversity com-
was not appropriate to carry out captures; 2) fish parisons (Gart et al., 1982). For different sample
were not distributed among different levels of the sizes for birds, we calculated species richness ex-
water column, but always near the bottom or the pected for each situation WP or P through rarefac-
banks between Nymphaea sp. stems, or over the tion curves for 1,000 randomizations, using
vegetation cover (fish do not go under leaves of EcoSim 7.0 software (Gotelli & Entsminger, 2001).
small plants); and 3) the great clarity of the water For fish, sampling size was identical (see above),
and the few visual obstacles allowed species sight- so rarefaction was not used.
ing and count, even in the case of juveniles (Palacio–
Núñez, 1997). Faced with this situation and to avoid Statistical analysis
altering populations, we carried out the sampling in
54 subaquatic transects; these transects were re- To evaluate population distribution of the
peated five times on seasonal visits in spring and bioindicator groups in the sectors, we used theAnimal Biodiversity and Conservation 30.1 (2007) 33
Kruskal–Wallis non–parametric test (KW) with the
STATISTICA package (StatSoft, 2001), and multi- Table 1. Characteristics of the sectors (S) of
ple comparisons of average range pairs using the Media Luna system for aquatic area (A, in
Dunn test (Gardiner, 1997). We analysed bird and ha), physical variables (W, woodlands),
fish abundance and richness; in both WP and P estimated human environmental impact (HI),
conditions for birds. Interrelationships among birds state of riparian vegetation (RV) and terrestrial
and fish in each sector (for both WP and P condi- vegetation (TV) (qualification average).
tions) were analysed by a Factorial Correspond- Sectors with low human impact show high
ence Analysis (FCA), using the STATISTICA soft- riparian and aquatic vegetation quality.
ware. For each sampling site we used the relative
abundance of each species. FCA is an ordination– Tabla 1. Características de los sectores del
multivariate technique which simultaneously ar- sistema de la Media Luna para el área acuática
ranges species and habitats. As there was no (A, en ha), variables físicas (W, bosques),
discontinuity between habitats, they were grouped impacto ambiental antrópico estimado (HI) y
in ecological series, thus reducing complex pat- estado de la vegetación ribereña (RV) y de la
terns into simple and interpretable forms (Braak, vegetación terrestre (TV) (calificación media).
1985; Moreno, 2000). En general los sectores con bajo impacto
humano mostraron los valores más altos en la
calificación de ambos tipos de vegetación.
Results
Species richness S A W HI RV TV
1 1.379 Yes Very high 2.35 0.86
Accumulation curves showed 20 bird species for
both conditions WP and P. Eleven fish species 2 0.619 No Very low 4.75 2.78
were present in the 13 sectors of the Media 3 0.637 No Very low 4.90 2.66
Luna. There are two particular species of the
Cichlasoma genus that could not be differenti- 4 0.389 Yes Very low 5.00 2.78
a t e d a n d w e r e thereforeanalysed together 5 0.687 Yes Very low 4.63 2.79
(C. labridens + Cichlasoma sp.). Our inventories
6 0.607 No Very low 3.65 2.93
showed 100% completeness for both bioindicator
groups according to the Chao 2, Jack 1 and ACE 7 1.219 No Very low 3.45 2.96
estimators. Bird species richness was statistically 8 1.513 No Low 2.90 2.78
different between both WP and P conditions (fig. 2).
9 0.606 Yes Very low 5.00 2.35
Species distribution among sectors 10 0.251 Yes High 3.65 2.10
11 0.216 Yes Very high 0.40 0.20
Species richness and abundance of bird species
distribution were statistically different among sec- 12 0.271 Yes Very high 2.18 0.45
tors. Differences in fish abundance were also sig- 13 0.235 Yes Very high 2.17 0.43
nificant but species richness was statistically indis-
tinguishable among sectors (see table 3 for KW
probabilities).
The largest differences in the Dunn and KW test
in bird species richness and abundance were be- firmed by species grouping in the FCA analysis.
tween sectors 9 and 4 (highest figures), and sectors Bird species ordination showed three main groups
13, 11 and 12 (the poorest; fig. 3). In these five for both WP and P conditions related to axis 1
sectors there is woodland presence but, in sectors 9 (fig. 5). In the WP plot the first two axes accounted
and 4 there is little human impact and riparian for 64.6% of the variance in the data (fig. 5A).
grassland. Sectors 13, 11 and 12 have no grassland According to the distribution of sectors and spe-
and human impact is very high (see table 1, fig. 1). cies, axis 1 could be explained as the level of
Species richness between sectors 8 and 3 (with- disturbance originated by tourists. In this sense, the
out woodland and low human impact) was statisti- first species group was determined by low human
cally non–significant compared with the high rich- impact (sectors 6, 7 and 8, see table 1) with the
ness sectors, whereas sectors 1 and 10 (with wood- more intolerant species such as Bubulcus ibis and
land and very high human impact) were similar to Anas diazi. The second species group (Ardea
the poorest sectors. herodias and Casmerodius albus) corresponded to
For fish abundance the greatest differences were intolerant species and was related to the well–
observed between sector 4, with dense aquatic conserved sector 5, whereas the third group containd
vegetation coverage and highest abundance val- generalist species such as Phalacrocorax olivaceus
ues, and the poorest 12, 13 and 1 sectors (fig. 4) and Podylimbus podiceps in the most disturbed
with scarce Nymphaea sp. coverage. sectors (1, 11, 12 and 13) and well conserved (2, 3,
Species distribution among sectors was con- 4, 9 and 10) sectors. In the P plot, the first two axes34 Palacio–Núñez et al.
Table 2. List of the 20 bird and 11 fish species and taxonomic family found in the Media Luna system.
Abbreviations (Abbr) used in this study, origin information (O) and extinction risk (ER) according to
the Mexican Red List NOM 059 (INE, 2002) and IUCN Red List (2004). Bird list based on Peterson
& Chalif (1989), and fish list based on List for Mexican Fish of Espinosa Pérez et al. (1993). For
birds habitat requirements (HR): SW. Superficial water; DP. Open water for dive with close rocks or
trunks for perching; OW. Open water; P. Branches or rocks close to the water; FV. Floating vegetation;
BT. Big trees near the water. For population status (PS): T. Threatened; E. Endangered; CR. Critically
endangered; V. Vulnerable. 1These two species of fish are reported together
Tabla 2. Lista de las 20 especies de aves y las 11 de peces habitantes del sistema de la Media Luna.
Se señalan las abreviaturas (Abbr) utillizadas en este trabajo, información sobre el origen (O) de las
especies así como su situación de riesgo de extinción (ER) de acuerdo con la NOM 059 (INE, 2002)
y la lista roja de UICN (2004). El listado de aves está basado en Peterson & Chalif (1989) y el de
peces está basado en la Lista de Peces Mexicanos de Espinoza Pérez et al. (1993). (Para otras
abreviaturas ver arriba.)
ER
Family Species Abbr O HR NOM IUCN
Birds
Ardeidae Casmerodius albus L alb Native SW – –
Nycticorax nycticorax L nyc Native SW – –
Ardea herodias L her Native SW – –
Butorides striatus Rackett str Native SW – –
Bubulcus ibis L ibi Exotic SW – –
Egretta thula Medina thu Native SW – –
E. caerula L cae Native SW – –
E. tricolor Müller tri Native SW – –
N. violacea L vio Native SW T –
Ciconiidae Mycteria americana L mam Native SW T –
Phalacrocoracidae Phalacrocorax olivaceus Humboldt oli Native DP – –
Anhingidae Anhinga anhinga L. anh Native DP – –
Anatidae Dendrocygna autumnalis L aut Native OW – –
Anas diazi Ridgway dia Native OW – –
Podicipedidae Podylimbus podiceps L pod Native OW – –
Rallidae Fulica americana Gmelin fam Native OW – –
Alcedinidae Ceryle alcyon L alc Native B – –
C. torquata L tor Native B – –
Jacanidae Jacana spinosa L spi Native FV – –
Pandionidae Pandion haliaetus L hal Native BT – –
Fish
Characidae Astyanax mexicanus Filippi Af Native None – –
Cyprinidae Dionda dichroma Hubbs y Miller Dd Endemic Unknown T V
Cyprinodontidae Cualac tessellatus Miller Ct Endemic Unknown E E
Goodeidae Ataeniobius toweri Meek At Endemic Unknown E E
Cichlidae Cichlasoma bartoni Bean Cb Endemic Unknown E V
C. labridens Pellegrin Cl1 Endemic Unknown T E
Cichlasoma sp. Cl1 Endemic Unknown E –
C. cyanoguttatum Bird and Girard Cc Introduced Unknown – –
Oreochromis sp. Ta Exotic None – –
Poecilidae Gambusia panuco Hubbs Gp Introduced Unknown – –
Poecilia mexicana Steindachner Pm Introduced Unknown – –
P. latipunctata Meek Pl Introduced Unknown E CRAnimal Biodiversity and Conservation 30.1 (2007) 35
25
Expected species richness
20
15
10
WP condition
5 P condition
95% confidence Interval
0
0 5 10 15
Transect number
Fig. 2. Rarefaction curves for birds in the sectors of Media Luna in P (with people) and WP (without
people) conditions. Comparisons were made for n = 15 transects and 1,601 individuals observed in
WP condition, with 20 bird species in both conditions. There was no statistical difference; both
conditions are in the confidence interval of 95% curves.
Fig. 2. Curvas de rarefacción para las aves de la Media Luna en condiciones P (con gente) y WP (sin
gente). Las comparaciones fueron hechas para n = 15 transectos y 1.601 individuos observados en
condición sin gente, con 20 especies en ambas condiciones. No se encontró diferencia estadística;
ambas condiciones se encuentran dentro de las curvas del intervalo de confianza al 95%.
accounted for 55.35% of variance (see fig. 5B).
Sectors 5 and 6 were the least susceptible to Table 3. Kruskal–Wallis results for specific
people presence and some intolerant species such richness and abundance distribution of birds
as Fulica americana and Pandion haliaetus from the and fish among sectors in the Media Luna.
first group (in WP condition), and Dendrocygna All results were significant except fish species
autumnalis from the third group were redistributed richness: Bg. Bioindicator group; C. Condition;
in the second group in condition P. Dv. Dependent variable (Sr. Species richness;
The first two axis from FCA accounted for 66.7% A. Abundance).
of the variance in the fish data (fig. 6). The fish
community showed three main groups. The first Tabla 3. Resultados de las pruebas de Kruskal–
group was represented by Cichlasoma bartoni and Wallis para la distribución de la riqueza
Oreochromis sp. and was related to the most dis- específica y la abundancia de aves y peces
turbed sectors (1, 11, 12 and 13). A second group entre los sectores de la Media Luna. Con
corresponded to the most generalist species such excepción de la riqueza específica de peces,
as Astyanax mexicanus, Cichlasoma labridens and todos los resultados fueron significativos: Bg.
C. cyanoguttatum, and is related to sectors 2 and Grupo bioindicador; C. Condición; Dv. Variable
10; these species did not show special require- dependiente (Sr. Riqueza específica; A.
ments. Dionda dichroma was only observed in sec- Abundancia).
tor 10. The third group contained the best con-
served sectors; Ataeniobius toweri only appeared
related to sectors with well established sub–aquatic Bg C Dv H d.f. p
vegetation (sector 3, 4, 5, 6, 7, 8 and 9).
Birds WP Sr 129.4 12 0.0001
Birds WP A 119.6 12 0.0001
Discussion Birds P Sr 129.4 12 0.0001
Sector characteristics were reflected by species Birds P A 113.9 12 0.0001
distribution and abundance of bioindicator groups. Fish – Sr 20.80 12 0.0534
Vegetation and other structural habitat variables Fish – A 23.39 12 0.0022
are important to determine bird abundance (Read36 Palacio–Núñez et al.
WP birds condition P birds condition
10
Birds species richness
A a a
8 ab
ab
6
abc abc
4
abc
abc
bcd bcd
abc cd
cd bcde
bcde
2
cde cd
cde cde d d
cde d
de e
0
e
70
B a
60
Birds abundance
a
50
40 ab
30 ab abc
20 bc
abc
abc
10 cd
bcd
cd abc bcde
cd cd cd cd
cd
cd cd cd d
0
d d cd d
1 2 3 4 5 6 7 8 9 10 11 12 13
Sectors
Fig. 3. Results of Dunn test for bird species in Media Luna sectors, in both WP and P conditions for:
A. Species richness; B. Mean individual abundance. The letters over the bars indicates the statistical
group for each condition; similar letters indicate statistical similarity between sectors. There were
strong statistical differences between sectors 9, 4 and 8 in contrast with 10 to 13 for bird richness and
abundance.
Fig. 3. Resultados de la prueba de Dunn para las especies de aves en los sectores de la Media Luna
en las condiciones sin gente (WP) y con gente (P) para: A. Riqueza de especies; B. Abundancia media
de individuos. Las letras sobre las barras indican el grupo estadístico para cada condición; las letras
similares indican similitud estadística entre los sectores. Existen fuertes diferencias significativas entre
los sectores 9, 4 y 8 en contraste con los sectores del 10 al 13 tanto para la riqueza como para la
abundancia de aves.
et al., 2000). Although birds can move openly into A. anhinga, most Ardeidae species, all Alcedinidae
Media Luna sectors, some sectors do not have the species, P. haliaethus and M. americana benefit
appropriate conditions for all species observed. from riparian woodlands. C. albus, A. herodias
Our results showed statistical differences in the and N. nycticorax benefit from trees but are af-
spatial distribution of birds among sectors, with fected by border changes and P. podiceps which
lowest abundance and richness values when there do not benefit are affected by riparian grassland
was visitor presence (fig. 3). We suggest that this destruction.
presence creates environmental stress that accounts Bird groups or particular species which are af-
for the different responses to tolerance among birds fected by any kind of change are usually considered
throughout the Media Luna system. the indicator species for this particular change (Read
FCA confirmed the observations that bird distri- et al., 2000; Paillison et al., 2002; Veraart et al.,
bution changes between conditions of human pres- 2004). The best example of a close relation with
ence. Some bird species benefit from anthropic habitat structure and high quality of aquatic vegeta-
modifications which tend to disguise some impact tion was J. spinosa. This species lives on floating
(Read et al., 2000). Species such as P. olivaceus, vegetation and is very territorial (Peterson & Chalif,Animal Biodiversity and Conservation 30.1 (2007) 37
80 a
Fish mean abundance (20 m2)
60 ab
abc
abc abc
abc abc
abc
abc
abc
bc
40 bc
c
20
0
1 2 3 4 5 6 7 8 9 10 11 12 13
Sectors
Fig. 4. Results of Dunn test for fish species abundance in Media Luna sectors. The letters above the
bars indicate the statistical group; similar letters indicate statistical similarity between sectors. There
are significant differences in the abundance between sectors number 4 and 1, 12 and 13.
Fig. 4. Resultados de la prueba de Dunn para la abundancia de peces en los sectores de la Media
Luna. Las letras sobre las barras indican el grupo estadístico; las letras similares indican similitud
estadística entre los sectores. Existen diferencias significativas en la abundancia entre los sectores 4
y los sectores 1, 12 y 13.
1989). It appears to be tolerant as it attempts only Conservation policies may underestimate the
small escape movements from human presence. value of small fragments. Each small fragment of
This behaviour is related to avoiding encroaching on unique and isolated native habitat can be impor-
another territory; its vocalizations, however, indicate tant not only to maintain, but also to generate
stress. We consider this species to be the best endemic biodiversity, and it must be carefully evalu-
environmental quality bird indicator. ated (Rubinoff & Powell, 2004). We emphasize the
The most intolerant species to direct human importance of small wetlands in semi–arid regions
impact were A. diazi, B. ibis, F. americana, P. with fish endemism and the need for good man-
haliaetus and D. autumnalis. These five species agement planning in order to avoid a critical situ-
were the best indicators of tourist disturbance caused ation.
by direct human presence in the Media Luna. The use of bioindicators helps us to analyse
For fish, species richness and spatial distribution the impact of direct and indirect effects of tourism
show a complex relation with the geographic loca- on biodiversity (e.g. Mancini et al., 2005). We
tion, size of the river or creek and the habitat observed altered conditions in Media Luna, such
characteristics in these system parts (Heino et al., as abrupt riverside and areas > 1 m deep (non
2005). Media Luna sectors have enough habitat anthropized sectors have gentle slopes and
conditions for most fish species and there are no gradual deep increases) which are now com-
significant differences in species richness between pletely unusable for some riparian bird species,
sectors (fig. 4). These results were confirmed by such as Ardeidae. Among fish groups, we ob-
few relations between most fish species and habitat served that cichlids have parental care and their
particularities as shown in the FCA results (fig. 6). young are sure to be found anywhere, but the
This ordination method emphasizes opposite habi- other young fish species need shallow waters
tat structure preferences between two endemic spe- (< 0.5 m) and dense vegetation coverage for sur-
cies: C. bartoni related to bare ground and A. toweri vival. Only cichlids were observed breeding suc-
related only to dense subaquatic vegetation. We cessfully in the most disturbed sectors; for C.
considered these species as fish indicators for tour- bartoni and Oreochromis sp. these sectors were
ist impact and habitat changes in Media Luna. the best places.38 Palacio–Núñez et al.
1.5
vio
Axis 2 (20.06% of variance)
thu
tri oli anh
mam
cae S9
ibi S4 nyc
0.0 S8 dia S10
S6 her S11
fam S7 alb aut
hal
alc S1
S5 S3
tor
pod
str
spi
–1.0
S2 S12
Bird species S13
Sector
–2.0
–2.0 –1.0 0.0 1.0
Axis 1 (44.54% of variance)
1.5
tor
dia
hal
S8 S5
Axis 2 (19.95% of variance)
S6 spi nyc
her man S12
oli
alc aut
S4
0.0 alb
S11 S13
anh tri S3
pod str
cae
S9 S10
fam S1 vio
thu
S2
–1.5
ibi
S7
–3.0
–3.0 –2.0 –1.0 0.0 0.5
Axis 1 (35.40% of variance)
Fig. 5. FCA plot for birds in Media Luna system showing relationships between sectors and bird
species for axis 1 and 2: A. For WP condition; B. For P condition. In the principal axis, species group
according to direct anthropic tolerance. Some species change sector if the condition varies from WP
to P, but most tolerant species do not move.
Fig. 5. Resultados de FCA para las aves del sistema de la Media Luna mostrando la relación entre los
sectores y las especies de aves para los ejes 1 y 2: A. Para la condición sin gente (WP); B. Para la
condición con gente (P). Algunas especies cambian de sector si la condición varía de WP a P, sin
embargo las especies más tolerantes no cambian.Animal Biodiversity and Conservation 30.1 (2007) 39
1.0
Pm
Ta Pl
S1 Gp
Cb S12 Af S5
0.0 S11 S2 S3 S4
S6
S7 S8
S13
Cl S9
Ct At
Cc
Axis 2 (23.59% of inertia)
S10
–2.0
Endangered endemic fish species
–4.0 Other fish species Dd
Sector
–1.0 –0.8 –0.4 0.0 0.4 0.8
Axis 1 (43.09% variance)
Fig. 6. FCA plot for fish in Media Luna system showing relationships between sectors and fish species
for axis 1 and 2. Strong contrast is shown in axis 1 between two endangered endemic fish: Ataeniobius
toweri (At) and Cichlasoma bartoni (Cb), the first lives in dense vegetation and the second prefers bare
portions.
Fig. 6. Resultados de FCA para los peces del sistema de la Media Luna mostrando la relación entre
los sectores y las especies de peces para los ejes 1 y 2. Se observan fuertes contrastes entre dos
especies amenazadas y endémicas: Ataeniobius toweri (At) y Cichlasoma bartoni (Cb), la primera
habitante de zonas con vegetación densa y la segunda que mostró preferencia por sitios sin
vegetación.
Both indicator groups are important elements in servation implications with C. bartoni. Finally,
this ecosystem, but management and conserva- subaquatic coverage is especially important for A.
tion actions should focus mainly on the fish group, toweri.
considering the arrival of visitors and their impli- Media Luna spring shares species, environmen-
cation in habitat structure and quality (e.g. Root, tal variables and problems with several other
1998; Currie, 2003). We observed that the best semiarid springs (Palacio–Núñez, 1997) and our
riparian grassland conservation, with and without present findings may provide helpful information for
trees, was related to the maximum bird diversity their management.
and abundance, and the best subaquatic quality
and abundance was related to the best fish den-
sity. Grassland and aquatic vegetation constitute Acknowledgements
barriers as few visitors cross them. As long as
these barriers remain this system can be main- We thank J. Jesús Enríquez–Fernández who col-
tained. These habitat structures are the basis of laborated in the field research in all phases. This
conservation of the entire system. Restriction of study was partially supported by grants (A–1870/04,
sector 10 is especially important for conservation A–1870/05) from the AECI (Agencia Española de
of D. dichroma, and tourist use should be kept Cooperación Internacional); Becas MAE No. 32342
moderate in altered channels in view of the con- and by a CONACyT pre–doctoral grant No. 187777.40 Palacio–Núñez et al.
References species selection. Ecological Applications, 11:
1489–1501.
Angermeier, P. & Schlosser, I., 1995. Conserving Fu, C., Wu, J., Chen, J., Wu, Q. & Lei, G., 2003.
aquatic biodiversity: beyond species and Freshwater fish biodiversity in the Yangtze River
populations. American Fisheries Society Sympo- basin of China: patterns, threats and conservation.
sium, 17: 402–414. Biodiversity and Conservation, 12: 1649–1685.
Bestelmeyer, B. T. & Wiens, J. A., 2001. Ant Gardiner, W. P., 1997. Statistics for the biosciences:
biodiversity in semiarid landscape mosaics: the data analysis using Minitab software. Prentice
consequence of grazing vs. natural heterogene- Hall Europe, UK.
ity. Ecological Applications, 11: 1123–1140. Gart, J. J., Siegel, A. F., & German, R. Z., 1982.
Boo, E., 1992. The ecotourism boom. Planning for Rarefaction and taxonomic diversity. Biometrics,
Development and Management. Wildlands and 38: 235–241.
Human Needs, A World Wildlife Fund Program. Gering, J. C., Crist, T. O. & Veech, J. A., 2003.
WHN Technical Paper Series. Paper Nº 2: 1–23. Additive partitioning of species diversity across
Braak, C. J. F., 1985. Correspondence analysis of multiple spatial scales: implications for regional
incidence and abundance data: Properties in conservation of biodiversity. Conservation Biol-
terms of a unimodal response model. Biomet- ogy, 17(2): 488–499
rics, 41: 859–873. Gotelli, N. J. & Entsminger, G. L., 2001. Ecosim:
Browder, S. F., Johnson, D. H. & Ball, I. J., 2002. Null models software for ecology. Version 7.0.
Assemblages of breeding birds as indicators of Acquired Intelligence Inc. and Kesey–Bear.
grassland condition. Ecological Indicators, 2: Burlington, VT 05465.
257–270. http://homepages.together.net/~gentsmin/
Burger, J., 2000. Landscapes, tourism, and conser- ecosim.htm
vation. The Science of the Total Environment, Heino, J., Paavola, R., Virtanen, R. & Muotka, T.,
249: 39–49. 2005. Searching for biodiversity indicators in run-
Colwell, R. K., 2000. EstimateS: Statistical Estima- ning waters: do bryophytes, macroinvertebrates,
tion of Species Richness and Shared Species and fish show congruent diversity patterns?
from Samples. Version 6.0b1. User’s Guide and Biodiversity and Conservation, 14: 415–428.
application published. Higginbottom, K., Green, R., & Northrope C., 2003.
http://viceroy.eeb.uconn.edu/estimates A framework for managing the negative impacts
Contreras–Balderas, S., 1969. Perspectivas de la of wildlife tourism on wildlife. Human Dimen-
ictiofauna en las Zonas Áridas del Norte de sions of Wildlife, 8: 1–24.
México. Memorias, primer simposio internacional IIZD, 1994. Caracterización ecológica del ecosistema
de aumento de producción de alimentos en Zo- de la Media Luna y su área de influencia. Reporte
nas Áridas. ICASALS, Texas, Tech. Publ., 3: de Investigación. Instituto de Investigación de
294–304. Zonas Desérticas, Universidad Autónoma de S.
Cooperrider, A. & Noss. R., 1994. Saving aquatic L. P. México.
biodiversity. Wild Earth. Spring: 54–64. INE, 2002. Lista de Especies en Riesgo: Peces.
Currie, D. J., 2003. Conservation of endangered Norma Oficial Mexicana (NOM 059). Instituto
species and patterns and propensities of Nacion 394–al de Ecología Anexo Normativo II.
biodiversity. Comptes Rendus Biologies, 326: Diario Oficial de México, 6 de marzo de 2002.
S98–S103. http://www.ine.gob.mx/ueajei/norma59a.html
Curtis, B., Roberts, K. S., Griffin, M., Bethune, S., IUCN, 2004. IUCN Red List of Threatened Species
Hay, C. J. & Kolberg, H., 1998. Species richness http://www.redlist.org
and conservation of Namibia freshwater macro– Järvinen, O. and Väisänen, R. A., 1975. Estimating
invertebrates, fish and amphibians. Biodiversity relative densities of breeding birds by the line
and Conservation, 7: 447–466. transect method. Oikos, 26: 316–322.
Duelli, P. & Obrist, M. K., 2003. Biodiversity indica- Labarthe, G., Tristán, M., Aguillón, R., Jiménez, L.
tors: the choice of values and measures. Agricul- S. & Romero, A., 1989. Cartografía Geológica
ture, Ecosystems and Environment, 98: 87–98. 1:50 000 de las hojas El Refugio y Mineral El
Espinosa–Pérez, H., Gaspar–Dillanes, M. T. & Realito, Estados de San Luis Potosí y
Fuentes–Mata, P., 1993. Listados faunísticos de Guanajuato. U. A. S. L. P., Instituto de Geología,
México. III. Los peces dulceacuícolas mexicanos. Folleto Técnico Nº 12, S. L. P., México.
Departamento de Zoología, Instituto de Biología, Lomolino, M. V., Brown, J. H., & Davis, R., 1989.
UNAM, México. Island biogeography of montane forest mam-
http://biblio68.ibiologia.unam.mx/FullText/lf3.html mals in the American Southwest. Ecology, 70:
Flather, C. H., Wilson, K. R., Dean, D. J. & McComb, 180–194.
W. C., 1997. Identifying gaps in conservation Longino, J. T., & Colwell, R. K., 1997. Biodiversity
networks: of indicators and uncertainty in geo- assessment using structured inventory: captur-
graphic–based analyses. Ecological Applications, ing the ant fauna of a tropical rainforest. Ecologi-
7: 531–542. cal Applications, 7: 1263–1277.
Fleishman E., Blair, R. B. & Murphy, D. D., 2001. Mancini, L., Formichetti, P., Anselmo, A., Tancioni,
Empirical validation of a method for umbrella L., Marchini, S. & Sorace, A., 2005. BiologicalAnimal Biodiversity and Conservation 30.1 (2007) 41 quality of running water in protected areas: the cal conservation implications of water level fluc- influence of size and land use. Biodiversity and tuations in wetlands of international importance: Conservation, 14: 351–364. Lake Kerkini, Macedonia, Greece. Environmental Mensing, D. M., Galatowitsch, S. M. & Tester, J. R., Conservation, 19: 235–243. 1998. Anthropogenic effects on the biodiversity Randall, T. R., 1992. Effect of the focal taxon on the of riparian wetlands of a northern temperate selection of nature reserves. Ecological Applica- landscape. Journal of Environmental Manage- tions, 2: 404–410. ment, 53: 349–377. Read, J. L., Reid, N. & Venables, W. N., 2000. Michelet, D., 1996. Río Verde San Luis Potosí. Which birds are useful bioindicators of mining Instituto de Cultura de San Luis Potosí. and grazing impacts in arid South Australia? Lascasiana, S. A. de C. V. Centre Français Environmental Management, 26: 215–232. D´études Mexicaines et Centraméricaines, México. Ross, S. & Wall, G., 1999. Ecotourism: towards Micó, E., Verdú, J. R. & Galante, E., 1998. Diversity congruence theory and practice. Tourism Man- of dung beetles in Mediterranean wetlands and agement, 20: 123–132. bordering brushwood. Annals of the Entomologi- Root, K. V., 1998. Evaluating the effects of habitat cal Society of America, 91: 298–302. quality, connectivity, and catastrophes on a threat- Miller, R. R., 1984. La Media Luna, San Luis Potosi, ened species. Ecological Applications, 8(3): 854– at edge of Chihuahua Desert, México. In: Pro- 865. ceedings of Desert Fishes Council: 67–72 (Desert Rubinoff, D. & Powell, J. A., 2004. Conservation of Fishes Council Co., Eds). Volumes XVI–XVIII. fragmented small populations: endemic species Annual Symposia, Bishop, CA, USA. persistence on California’s smallest channel is- Moreno, C. E., 2000. Métodos para medir la land. Biodiversity and Conservation, 13: 2537– biodiversidad. M & T–Manuales y Tesis SEA, Vol. 2550. 1. Zaragoza, España. SEGAM, 2003. Declaratoria de Área Natural Newsome, D., Lewis, A. & Moncrieff, D., 2004. Protegida bajo la modalidad de Parque Estatal Impacts and risks associated with developing, denominado “Manantial de la Media Luna”. Diario but unsupervised, stingray tourism at Hamelin Oficial de San Luis Potosí. 7 de junio del 2003. Bay, Western Australia. International Journal of http://www.segam.gob.mx/ Tourism Research, 6(5): 305–323. StatSoft, Inc., 2001. STATISTICA (Data Analysis Palacio–Núñez, J., 1997. Caracterización del Software System) Version 6. Tulsa, Oklahoma. ecosistema de la laguna Media Luna, Rioverde, Tellería, J. L., 1986. Manual para el censo de los S. L. P. y su influencia en la ornitofauna acuática vertebrados terrestres. Ed. Raíces, Madrid. y ribereña. Tesis de Maestría. Colegio de Tershy, B. R., Breese, D., & Croll D. A., 1997. Postgraduados en Ciencias Agrícolas. Montecillo, Human perturbations and conservation strate- México. gies for San Pedro Mártir Island, Islas del Golfo Palacio–Núñez, J., Clemente–Sánchez, F., Herrera– de California Reserve, México. Environmental Haro, J. G., Ortega–Escobar, M., García–Bojalil, Conservation, 24(3): 261–270. C. M. & Larqué–Saavedra, A., 1999. Ornitofauna Van Rensburg, B. J., McGeoch, M. A., Matthews, acuática y ribereña del ecosistema de la Media W., Chown, S. L. & Van Jaarsveld, A. S., 2000. Luna, Rioverde, San Luis Potosí, México. Testing generalities in the shape of patch occu- Agrociencia, 34: 303–310. pancy frequency distributions. Ecology, 81: 3163– Paillison, J. M., Reeber, J. & Marion, L., 2002. 3177. Bird assemblages as bio–indicators of water Veraart, J. A., de Groot, R. S., Perelló, G., Riddiford, regime management and hunting disturbance N. J. & Roijackers, R., 2004. Selection of (bio) in natural wet grassland. Biological Conserva- indicators to assess effects of freshwater use in tion, 106: 115–127. wetlands: a case study of Albufera de Mallorca, Peterson, R. T. & Chalif, E. L., 1989. Aves de Spain. Regional Environmental Change, 4: México. Guía de Campo. Ed. Diana, México. 107–117. Pineda, E., Moreno, C., Escobar F. & Halffter, G., Verdú, J. R., Crespo, M. B. & Galante, E., 2000. 2005. Frog, bat and dung beetle diversity in the Conservation strategy of a nature reserve in cloud forest and coffee agroecosystems of Veracruz, Mediterranean ecosystem: the effects of protection Mexico. Conservation Biology, 19: 1–11. from grazing biodiversity. Biodiversity and Pyrovetsi, M. & Papastergiadou, A., 1992. Biologi- Conservation, 9: 1707–1721.
You can also read