BloombergNEF: Finding Value in a Sustainable Future - Demand Drivers Input Drivers Operational Efficiency Competitors - Energy and Mines Australia
←
→
Page content transcription
If your browser does not render page correctly, please read the page content below
BloombergNEF:
    Finding Value in a
    Sustainable Future
    Demand Drivers
     Input Drivers                 Policy
                                 Economics
                                 & forecasts
     Operational                Sustainability

      Efficiency                 Innovation
                                   & tech
                                  Finance
     Competitors

1     Energy and Mines, Perth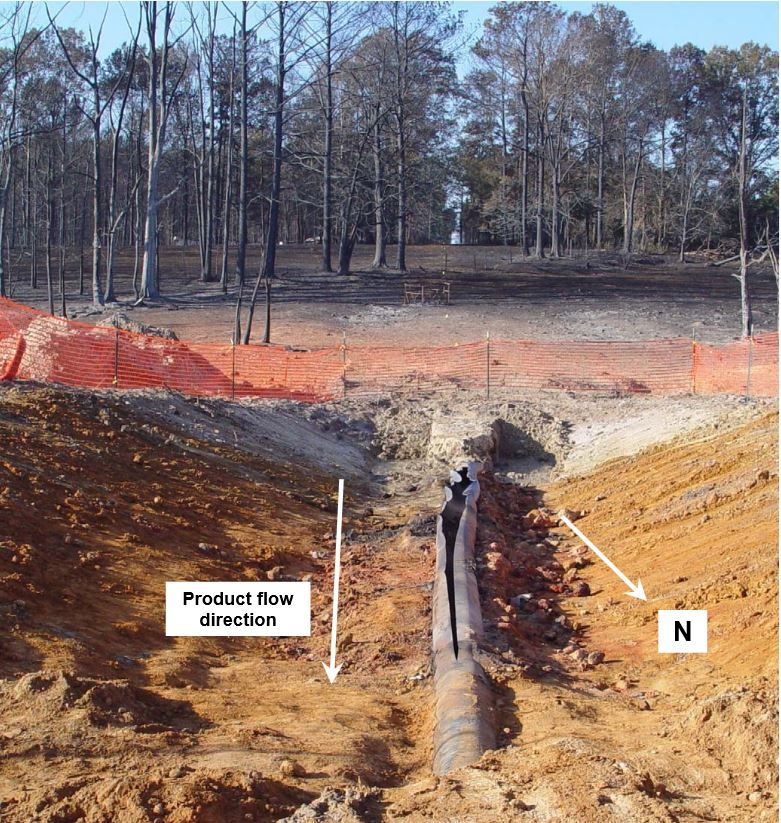
Cheap renewables are here

2   Energy and Mines, Perth
The cost of clean technologies
continue to decrease
Solar PV module prices              Onshore wind turbine prices Lithium-ion battery prices
     $/W                               euro / W                   $/kWh
      5                              1.40                         1,200
    4.5                              1.30
                       -94% since                    -37% since   1,000                                      -85% since
      4                              1.20
                          2008                          2008                                                    2010
    3.5                              1.10                          800
      3
                                     1.00
    2.5                                                            600
                                     0.90
      2
                                     0.80                          400
    1.5
      1                              0.70
                                                                   200
    0.5                              0.60
      0                              0.50                            0

                                                                          2010
                                                                                 2011
                                                                                        2012
                                                                                               2013
                                                                                                      2014
                                                                                                             2015
                                                                                                                    2016
                                                                                                                           2017
                                                                                                                                  2018
                                            2008
                                            2009
                                            2010
                                            2011
                                            2012
                                            2013
                                            2014
                                            2015
                                            2016
                                            2017
                                            2018
        2010

        2013

        2016
        2008
        2009

        2011
        2012

        2014
        2015

        2017
        2018

Source: BloombergNEF

3      Energy and Mines, Perth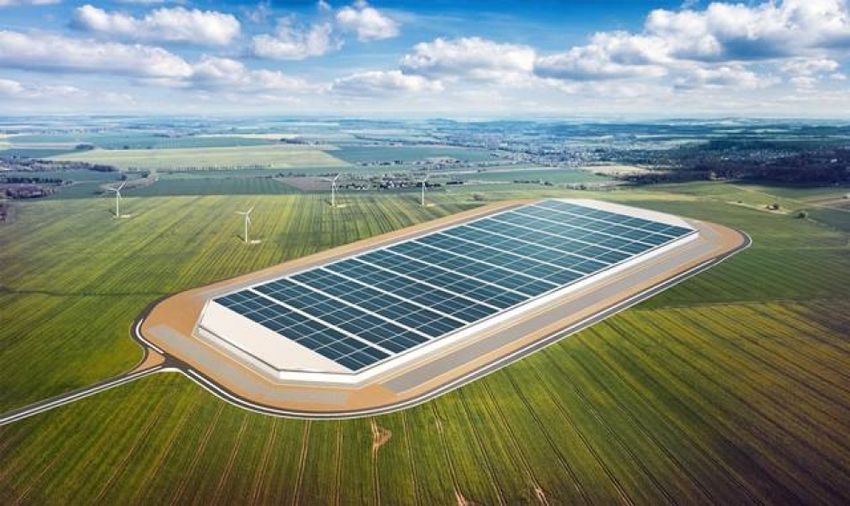
In Australia, coal generation
costs have gone up…
Price and capacity offers from black coal generators in Australia
Offered Capacity (MW)
3000
        2016
2000

1000

    0
        0-     10 -   20 -   30 -   40 -   50 -   60 -   70 -   100 - 300 -
        10     20     30     40     50     60     70     100    300   1000

3000
        2018
2000

1000

    0
        0-     10 -   20 -   30 -   40 -   50 -   60 -   70 -   100 - 300 -
        10     20     30     40     50     60     70     100    300   1000
                              Price (A$/MWh)
                                                                              Source: BloombergNEF, AEMO

4       Energy and Mines, Perth
…as have gas prices
Weekly gas spot prices in Eastern Australia
                    Domestic market pricing                    LNG linked pricing                   Partial de-coupling from LNG prices
A$/GJ
20
                              Ramp gas from                    Scarcity pricing                          Australian Domestic Gas
                              LNG producers                                                                Security Mechanism
15

10

    5

    0
        Jan

                        Jun

                                         Jan

                                                     Jun

                                                                    Jan

                                                                                                            Jan
                                   Oct

                                                              Oct

                                                                                                    Oct

                                                                                                                                       Oct
        Feb
        Mar

                         Jul

                                               Feb
                                               Mar

                                                      Jul

                                                                            Feb
                                                                            Mar

                                                                                    June
                                                                                      Jul

                                                                                             Sept

                                                                                                            Feb
                                                                                                            Mar

                                                                                                                     June
                                                                                                                              Jul

                                                                                                                                      Sept
                  Apr
                  May

                        Aug
                                   Sep

                                               Apr
                                               May

                                                              Aug
                                                              Sep

                                                                            Apr
                                                                                     May

                                                                                     Aug

                                                                                                                      Apr
                                                                                                                      May

                                                                                                                             Aug
        Nov
        Dec

                                   Nov
                                         Dec

                                                                    Nov
                                                                    Dec

                                                                                                    Nov
                                                                                                    Dec
        2014                2015                       2016                           2017                                2018
                 Adelaide            Sydney        Victoria           Brisbane         Wallumbilla               Singapore LNG spot

Source: BloombergNEF, Australian Energy Market Operator

5        Energy and Mines, Perth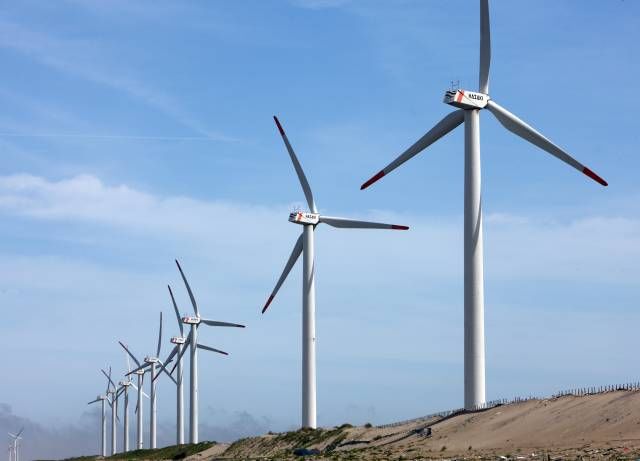
In Australia, new renewables
are already undercutting existing coal
Short-run cost of coal versus levelized cost of electricity of wind and solar in Australia
A$/MWh
200
         2016                                                     2018
180
160
140             Solar PV
                 LCOE
120
                                            Wind
100                                         LCOE
    80
                                                                                                     Wind
                                                                          Solar PV
    60                                                                      LCOE                     LCOE

    40                                                              Short-run cost of coal based on spot coal price
         Short-run cost of coal based on spot coal price
    20
     0

Source: BloombergNEF. Short-run cost of coal assumes a standard heat rate of 9.9GJ/MWh, an energy content of black coal of 25.1GJ/tonne and a range of 6000kCal thermal spot
prices at Newcastle hub in 2016 and 2018.

6        Energy and Mines, Perth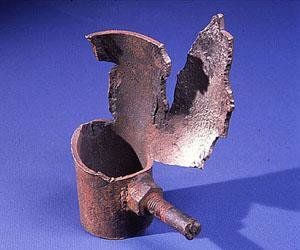
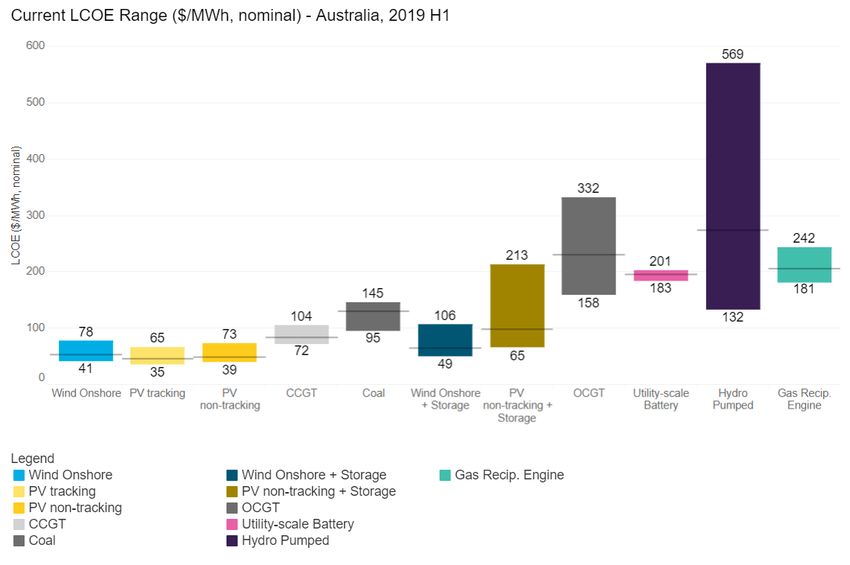
Australia LCOE stack

Source: BloombergNEF

7    Energy and Mines, Perth
Larger industrial systems are
expected to grow
Annual commercial installations
Number of systems                                                                                                        Net present value (A$/kW)

16,000                                                                                                                                    4,000
                                                                                            Commercial NPV

12,000                                                                                                                                    3,000
                                                                                                                                                     Commercial
                                                                                                              Industrial NPV
    8,000                                                                                                                                 2,000      Industrial

    4,000                                                                                                                                 1,000

        0                                                                                                                                 -
            2010                          2020                           2030                           2040                       2050
Source: BloombergNEF. Note: For more details see: Australia behind-the-meter PV and storage forecast (Web | Terminal).

8      Energy and Mines, Perth
Which could drive a massive
surge of behind-the-meter PV capacity
Annual capacity additions                                                                   Cumulative installed capacity

 GW                                                                                          GW
4.0                                                                                          60
3.5                                                                                          50
3.0
                                                                                             40
2.5
                                                Industrial
2.0                                                                                          30
                                                    Commercial
1.5                                                                                          20
                                                          Residential
1.0
                                                                                             10
0.5
0.0                                                                                            0
   2010               2020              2030              2040              2050               2010               2020   2030   2040   2050
Source: BloombergNEF. Note: For more details see: Australia behind-the-meter PV and storage forecast (Web | Terminal).

9      Energy and Mines, Perth
State-of-play for mining and
renewables
Mining generation projects, by tech Mining generation projects, by strategy
Installed capacity (MW)
400
Installed capacity (MW)
352
Small hydro 480
300 Embedded
792 generation
219
206 Wind
Hosting an IPP
200 201
127 121
Solar Miner as IPP
261
100
66 Renewable energy
39 645 subsidiary
10
0 Off-site PPA
2010 11 12 13 14 15 16 17
Source: BloombergNEF Source: BloombergNEF
10 Energy and Mines, PerthRenewable and off-grid
solutions for miners
Energy storage
/battery
Solar /inverters management
software
Mining
Fuel generators
/rental Redeployable
solar /rental
Hybrid micro-grids
Source: BloombergNEF
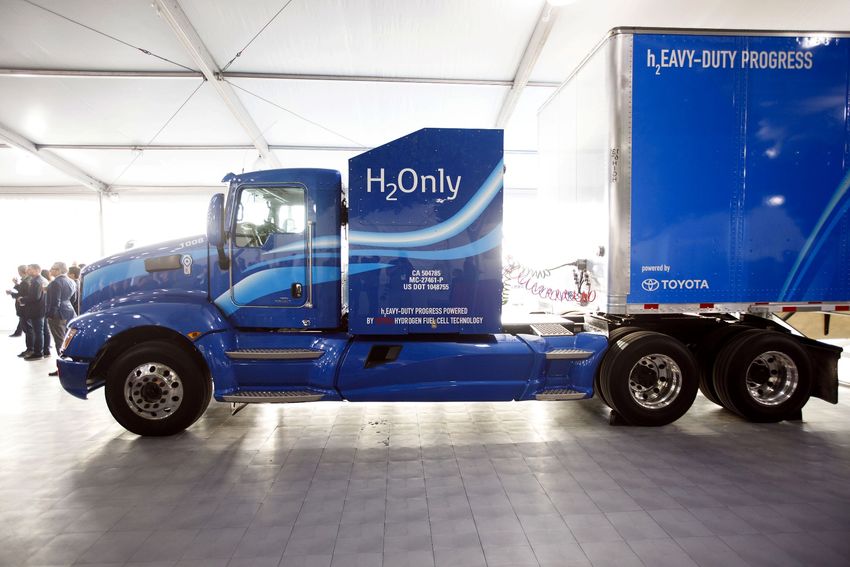
11 Energy and Mines, PerthA Hydrogen Future?
Transport
● {BPIX 321064668}
12 Energy and Mines, Perth
Source: BloombergChallenge 1: two thirds of the
energy is lost in conversion
Round-trip electrical efficiency of hydrogen
38%
2%
1.00 MWh 45%
0.33 MWh
Electricity input Loss Loss Loss Electricity out
(electrolysis) (compression for storage) (fuel cell)
Source: BloombergNEF, CSIRO
13 Energy and Mines, PerthChallenge 2: making clean hydrogen is costly Fuel cost ($/GJ) $32-41 Hydrogen from renewable electricity $15-20 Hydrogen from fossil fuels $3-11 Natural gas Source: BloombergNEF, Morgan Stanley, CSIRO 14 Energy and Mines, Perth
…but should get cheaper

Expected electrolyzer cost reductions by 2025
$/GJ

Source: CSIRO. Note: Figures for polymer electrolyte membrane (PEM) electrolyser. U.S. Department of Energy 2020 cost target: $19/GJ

15     Energy and Mines, Perth
Challenge 3: transporting
hydrogen is tricky…
Hydrogen embrittlement

Source: General Electric, Eaugen Furamera, Metropolitan Consulting Engineering & Forensics.

16    Energy and Mines, Perth
..and long-distance shipping
won’t come cheap
                                                              Delivered cost: $30/GJ

                                                                         + Shipping: $15/GJ

                                                               Production: $15/GJ
Source: BloombergNEF, CSIRO. Note: Cost estimates for 2025.

17    Energy and Mines, Perth
Challenge 4: producing at
scale requires a lot of power
78 EJ Projected demand in 2050 (Hydrogen Council)
Requires
29,250 TWh > than current
global generation
Source: BloombergNEF
18 Energy and Mines, PerthChallenge 5: Require a lot of
investment, and subsidies
Annual investment Annual subsidy
$bn/year 716 $bn/year
343
300
140
25
?
Hydrogen Renewables Oil and gas Hydrogen Renewables Fossil fuels
(requirement)* (2017) (2017) (2016) (2017)
Source: BloombergNEF, IEA, Hydrogen Council Source: BloombergNEF, IEA
19 Energy and Mines, PerthEnergy costs crucial to moving up the metals value chain 20 Energy and Mines, Perth
Movement towards regional
localization of supply chains
                                         Selected investments, partnerships and supply agreements for Northvolt

                                                                      $12m            $12m

                                                                                                               $12m
                                                               $18m

                                                                $62m                                            $12m

                                                                        $0.6m
                                                                                               $12m

                                                      █ Debt   █ Investment     █ Strategic partnership & investment   █ Supply agreement

Source: Regional Development Australia

21    Energy and Mines, Perth
Refined Product Control
D.R.C. cobalt capacity, 2019e Refined lithium capacity, Refined nickel capacity,
by processor country by location by location
Other
6%
MNCs
42%
112,400 metric tons
Chinese
52%
Source: BloombergNEF
22 Energy and Mines, PerthComponent manufacturing by region
Lithium-ion battery cathode production
thousand metric tons
454
324
2019
191
169 170 2021
51 51 41 39
36
7 7
Source: BloombergNEF China Korea Japan Europe U.S. Other
23 Energy and Mines, PerthBattery cell manufacturing by region
Battery cell manufacturing capacity by plant location
4%
3% 1% 11%
7%
12%
12%
2019: 1% 2025:
316GWh 2% 1,090GWh
12% 62%
73%
Source: BloombergNEF China U.S. South Korea Japan Europe Other
24 Energy and Mines, PerthWho can compete with China?
Cost of battery pack production Electricity use accounts for around half of
opex costs
$/kWh
$/MWh
450 160
400 140
350 120
300
100
250
80
200
60
150
40
100
50 20
0 0
China Korea U.S. Germany Poland Sweden China Fujian (CATL) Jiangxi (Farasis)
Source: BloombergNEF Source: BloombergNEF, Eurostat, Bloomberg
25 Energy and Mines, PerthCost of electricity is just the
beginning
$million/GWh (real 2019) Plant size
170
160
150
140 35GWh
130 -25%
120
Unsubsidized
110
100 Subsidized
90
80
2017 2018 2019
Commissioning year
Source: BloombergNEF, Eurostat, Bloomberg, Scientific American
26 Energy and Mines, PerthCopyright and disclaimer
The Bloomberg NEF ("BNEF"), service/information is derived from selected public sources. Bloomberg Finance L.P. and its affiliates, in providing the
service/information, believe that the information it uses comes from reliable sources, but do not guarantee the accuracy or completeness of this information, which is
subject to change without notice, and nothing in this document shall be construed as such a guarantee. The statements in this service/document reflect the current
judgment of the authors of the relevant articles or features, and do not necessarily reflect the opinion of Bloomberg Finance L.P., Bloomberg L.P. or any of their
affiliates (“Bloomberg”). Bloomberg disclaims any liability arising from use of this document, its contents and/or this service. Nothing herein shall constitute or be
construed as an offering of financial instruments or as investment advice or recommendations by Bloomberg of an investment or other strategy (e.g., whether or not
to “buy”, “sell”, or “hold” an investment). The information available through this service is not based on consideration of a subscriber’s individual circumstances and
should not be considered as information sufficient upon which to base an investment decision. You should determine on your own whether you agree with the
content. This service should not be construed as tax or accounting advice or as a service designed to facilitate any subscriber’s compliance with its tax, accounting or
other legal obligations. Employees involved in this service may hold positions in the companies mentioned in the services/information.
The data included in these materials are for illustrative purposes only. The BLOOMBERG TERMINAL service and Bloomberg data products (the “Services”) are
owned and distributed by Bloomberg Finance L.P. (“BFLP”) except that Bloomberg L.P. and its subsidiaries (“BLP”) distribute these products in Argentina, Australia
and certain jurisdictions in the Pacific islands, Bermuda, China, India, Japan, Korea and New Zealand. BLP provides BFLP with global marketing and operational
support. Certain features, functions, products and services are available only to sophisticated investors and only where permitted. BFLP, BLP and their affiliates do
not guarantee the accuracy of prices or other information in the Services. Nothing in the Services shall constitute or be construed as an offering of financial
instruments by BFLP, BLP or their affiliates, or as investment advice or recommendations by BFLP, BLP or their affiliates of an investment strategy or whether or not
to “buy”, “sell” or “hold” an investment. Information available via the Services should not be considered as information sufficient upon which to base an investment
decision. The following are trademarks and service marks of BFLP, a Delaware limited partnership, or its subsidiaries: BLOOMBERG, BLOOMBERG ANYWHERE,
BLOOMBERG MARKETS, BLOOMBERG NEWS, BLOOMBERG PROFESSIONAL, BLOOMBERG TERMINAL and BLOOMBERG.COM. Absence of any trademark
or service mark from this list does not waive Bloomberg's intellectual property rights in that that name, mark or logo. All rights reserved. © 2018 Bloomberg.
27 Energy and Mines, PerthBloomberg NEF (BNEF) is a leading provider
of primary research on clean energy,
advanced transport, digital industry,
innovative materials, and commodities.
BNEF’s global team leverages the world’s
most sophisticated data sets to create clear
perspectives and in-depth forecasts that
frame the financial, economic and policy
implications of industry-transforming trends
and technologies.
BNEF research and analysis is accessible via
web and mobile platforms, as well as on the
Bloomberg Terminal.
Coverage.
Clean energy
Advanced transport
Commodities
Digital industry
Client enquiries:
Bloomberg Terminal: press key twice
Email: support.bnef@bloomberg.net
Learn more:
about.bnef.com | @BloombergNEFYou can also read